
An objective approach to "Sell in May"

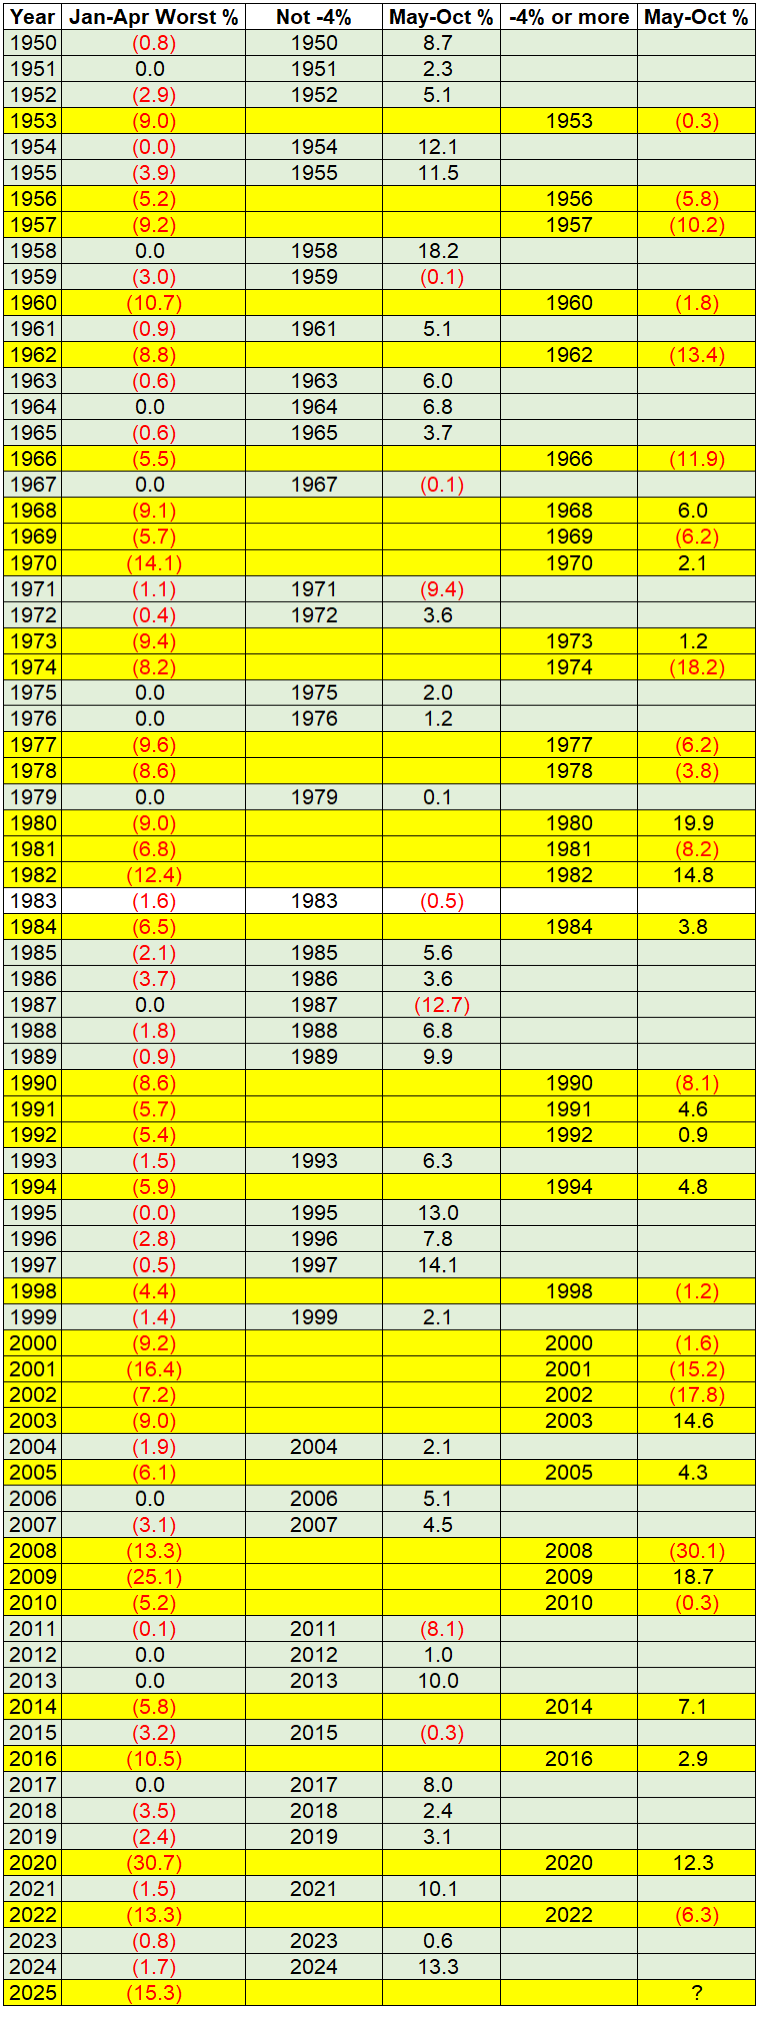
NOTE: This version displays a corrected table for the years 1950 to 2025. Due to a scanning error, the original version left off the years 1978 to 1987. Those years are included in the corrected table below.
Key points
- Overall, the phrase "Sell in May" should probably be replaced with "adjust your expectations starting in May"
- Evidence suggests that stock market performance during the first four months of the year presages the probability of strong performance during the ensuing six months
- Despite a spate of recent favorable indicator signals, one useful "Sell in May" model suggests that while the outlook for stocks is positive overall, it may not necessarily be smooth sailing between now and the end of October
Is there really something to "Sell in May?"
The proper answer to the question above is most likely, "Yes, sometimes, sort of, but it's complicated."
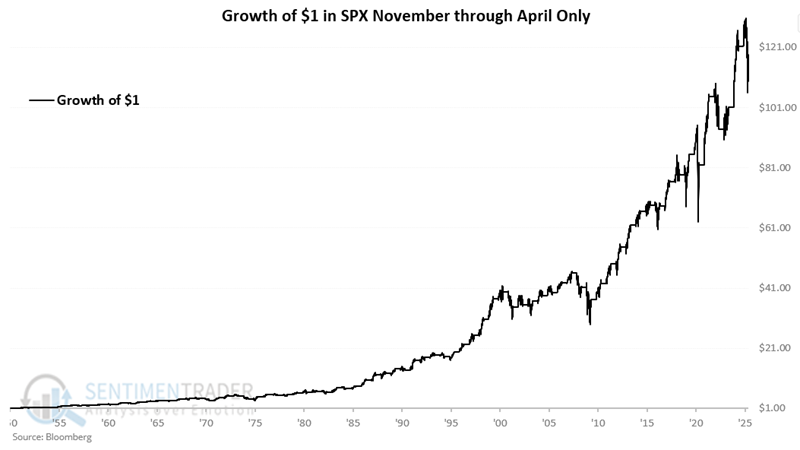
It is a fact that the stock market performed much better from November through April than from May through October. The chart below displays the hypothetical growth of $1 in the S&P 500 from November through April starting in 1950. $1 grew 11,756% to $118.56.
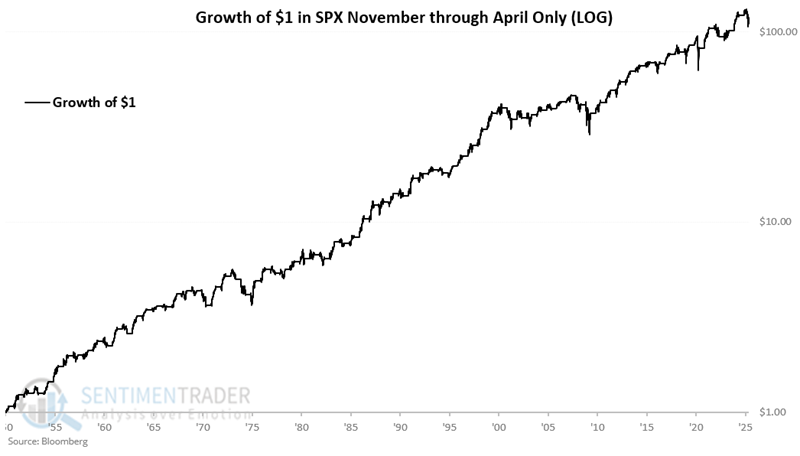
The chart below displays the same results on a logarithmic scale.
The chart below displays the hypothetical growth of $1 in the S&P 500 from May through October starting in 1950. $1 grew 186.7% to $2.88.
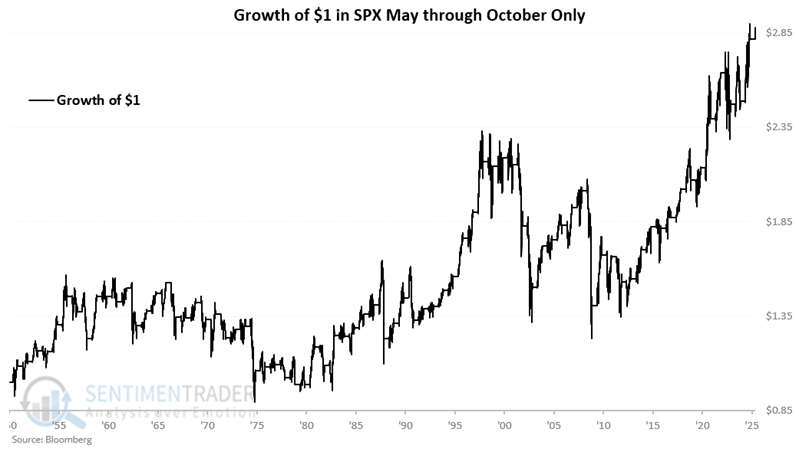
So 11,756% is indisputably better than 186.7%. But 186.7% is still ultimately a meaningful gain.
The conundrum is this: Yes, stocks have performed much better overall during November through April. But it is clearly a mistake to assume that May through October will automatically be unfavorable for stocks in any given year.
Factoring in SPX performance year-to-date
Now, let's consider the S&P 500's performance during the first four months of the year in deciding whether or not to "sell in May." As our test, we will measure the S&P 500's performance during the first four months relative to the close on December 31st of the previous year.
A = December 31st close of prior year
B = Lowest SPX closing price from January 1st through April 30th
C = B / A
Trading rules on April 30th:
If C > 0.96, then continue to hold SPX
If C <= 0.96, then sell SPX and buy back in on October 31st
In other words, if the S&P 500 index does not register a 4% or more decline for the year by April 30th, we will NOT sell in May. If it does register a decline of 4% or more during the first four months, we will sell in May and stay out of the market until October 31st.
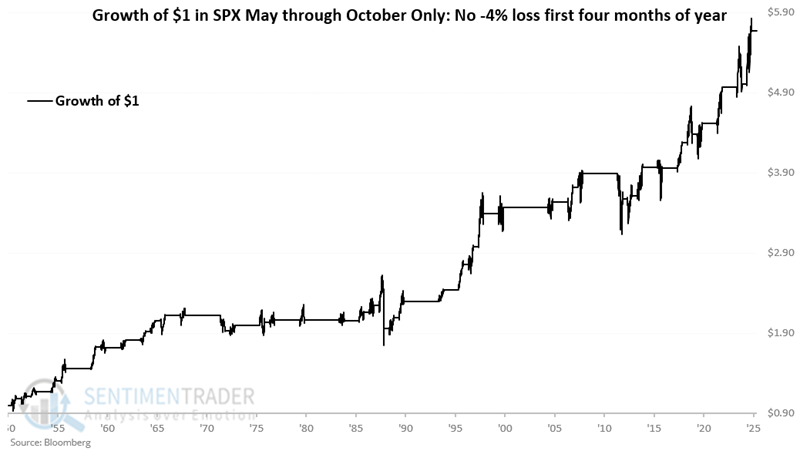
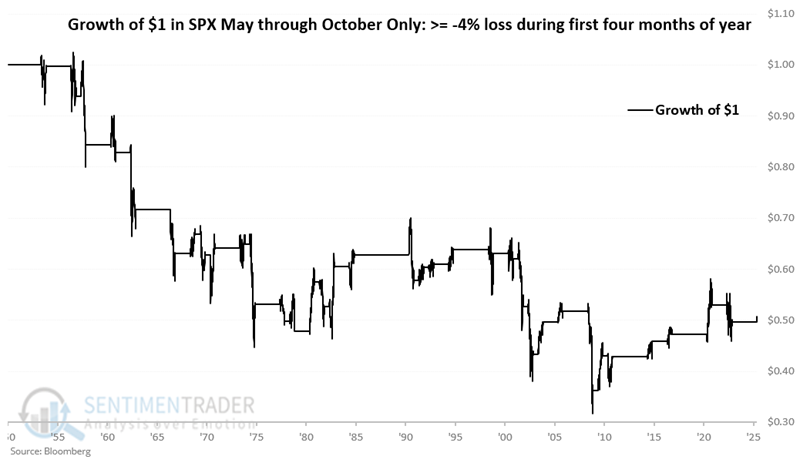
The chart below displays the hypothetical growth of $1 invested in SPX from May through October only during years when the worst year-to-date decline through April did not exceed -4%. $1 grew 467.1% to $5,67. Notice also the "lower left to upper right" nature of the results.
The chart below displays the hypothetical growth of $1 invested in SPX during May through October only during years when the worst year-to-date decline through April was -4% or greater. $1 declined -49% to $0.51. Here, note the "upper left to lower right" nature of results.
The former equity curve above trends from lower left to upper right, while the latter trends primarily from upper left to lower right. While there are no guarantees, this suggests that investors press their bets if the market holds up well during the first four months (i.e., no loss of -4% or more). It also suggests that investors adjust their expectations if the market struggles significantly at some point during the first four months.
Summarizing performance
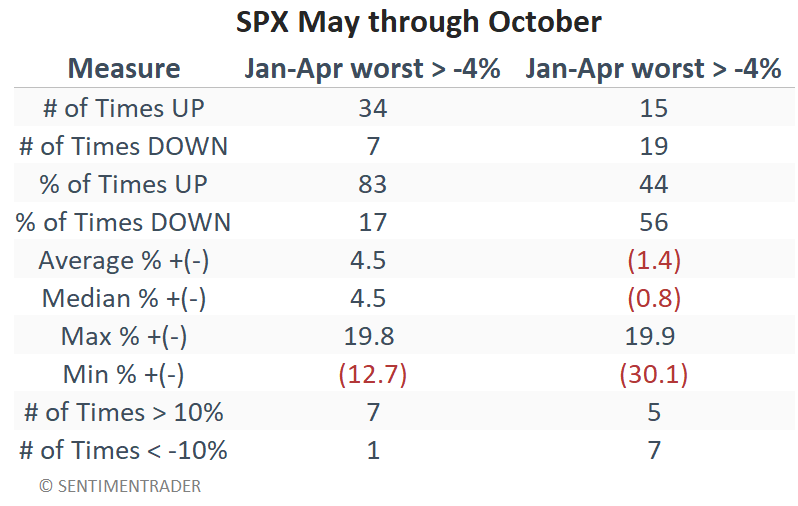
The table below summarizes the S&P 500's performance from May through October, depending on whether the worst year-to-date loss through the end of April was more or less than -4%.
The table below displays year-by-year results. Years with a January-April maximum year-to-date loss that did not reach -4% are highlighted in green. Years with -4% or more are highlighted in yellow.
What the research tells us…
The first four months of 2025 saw a maximum year-to-date loss of -15.3%, well beyond our -4% cutoff. Does this mean that stocks will decline between now and the end of October 2025? Not at all. If history is a guide, all this means is that the odds of a gain over the next five months have declined from greater than 80% to less than 45%. The real message is less about "selling everything" and more about "not expecting smooth sailing." It also suggests that stock and sector selection will be important for those hoping to maximize gains in the months ahead.