
An objective approach to assessing inflation

NOTE: As I am out of town for a few days, I am revisiting some material I have highlighted in the past. This piece focuses on inflation, its impact on stock prices, and the current implications based on the most recently reported inflation data. The bulk of the material below is reproduced from an article dated 2024-03-15.
Key points
- Inflation remains a hot topic among investors and consumers
- Still, objective indicators suggest that inflation - at the moment - should not be a significant source of concern for stock market investors
- In this piece, we review/update several previous reports on inflation and assess the current state of affairs
The state of the Producer Price Index
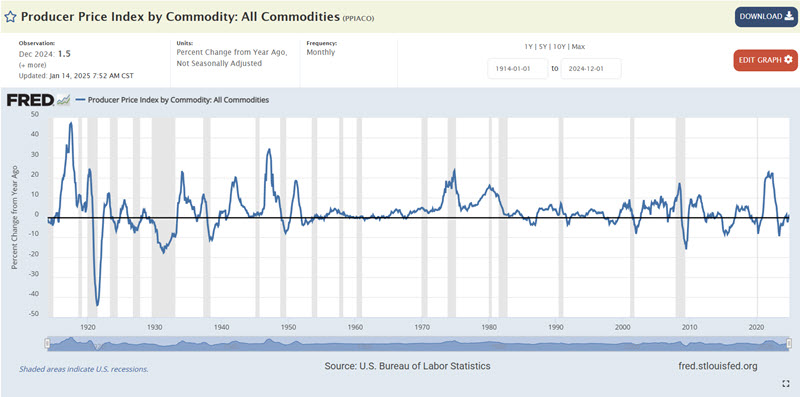
The chart below displays the historical 12-month % rate-of-change for the Producer Price Index since 1914.
In this piece (What to make of PPI inflation) dated 2023-01-19, I highlighted the performance of the S&P 500 Index based on the 12-month change in the Producer Price Index (PPI).
In this piece (PPI inflation and the stock market - Part I), dated 2023-02-21, I introduced a simple three-indicator stock market model using various measures of PPI performance.
Finally, in this piece (PPI inflation and the stock market-Part II), dated 2023-02-22, I highlighted the history of Dow Jones Industrials' performance based on the status of the three indicator models highlighted in the previous piece and updated below.
Given the continued hand-wringing surrounding inflation, reviewing the model highlighted in these previous pieces seems like a good time.
What you need to know about inflation and stock prices
The most relevant adage regarding inflation and stock prices is "The market hates uncertainty." Few things create more uncertainty - for individuals and businesses - than unchecked inflation or deflation. A little bit of inflation is expected and is baked into the cake as far as investors are concerned. A normal, moderate inflation rate will not make much difference to investors. However, when inflation begins to accelerate, fear can grip the market, as investors and businesses have no idea how far it might run and, in turn, how much impact it might ultimately have on their bottom line.
The absolute level of inflation (for this piece, we consider the 12-month change in both the Producer Price Index and the Consumer Price Index) is important. It can induce fear as companies recalculate the anticipated impact on income and expense if it gets outside the typically moderate range. The rate of change is also an important factor. Interestingly, once the rate of change moderates - even if the absolute level of inflation is relatively high - the stock market can respond favorably, as it discounts the likelihood that the worst has passed.
The most recent bout of inflation occurred in 2021-2022. The stock market began to sense trouble in late 2021 and declined sharply during the first half of 2022 as the 12-month change in the Producer Price Index soared to a peak above 22% and the Consumer Price Index soared to a peak of almost 9% by July 2022. The stock market bottomed out in September 2022, even though PPI and CPI inflation still stood at 15.5% and 8.2%, respectively. Despite these high levels, the market correctly perceived that inflation would moderate and began to look ahead.
As of the latest readings released in January 2025, the current rate of PPI inflation is 1.5%, and CPI inflation is 2.9%. As a result - and as detailed below - these are favorable inflation levels for stocks.
Review of PPI Indicators #1 through #3
I have previously introduced three indicators based on the Producer Price Index. To quickly recap:
Indicator #1: Look at the 12-month percentage change in PPI. Below +9% and above -12% is bullish, and outside of that range is bearish.
Indicator #2: This is calculated as the Producer Price Index 12-month percentage change minus the Consumer Price Index (CPI) 12-month percentage change. Below +7.00 is bullish; above that is bearish.
Indicator #3: Look at the 1-month percentage change in the PPI. Between +4% and -2.2% is bullish. Outside of that range is bearish.
PPI Stock Market Model
Our PPI Stock Market Model model considers the state of all three of the above PPI indicators at the end of each month to assess the status of this model as "bullish" or "bearish" for stocks in the following month.
If a given indicator is bullish at the end of a month, that adds one point to the model. As such, the model can read +3, +2, +1, or 0 at the end of any month.
For example, this model will "officially" consider the PPI values reported this week at the end of March 2023, and a model value will be calculated for April. Based on the latest readings, we can get a head start on this process (all three indicators are presently "bullish"). However, the official designation as "bullish" or "bearish" for the new month does not occur until the end of the month.
To clarify, if the model readings change from bearish to bullish (or vice versa) based on the latest data released mid-month, the model does not change from bearish to bullish until the close of the month's last trading day.
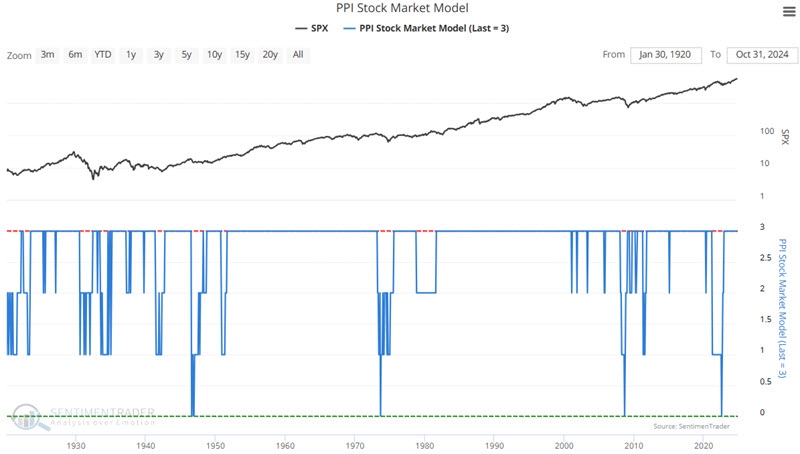
The chart below displays the month-end status of this model since 1914.
The current state of affairs remains favorable
Indicator #1: 12-month percentage change in PPI. The current 12-month rate of change in PPI is 1.5%, which is favorable as it is below +9% and above -12%.
Indicator #2: The Producer Price Index 12-month percentage change minus the Consumer Price Index (CPI) 12-month percentage change presently clocks in at 1.40 points. Since this is below +7.00, this indicator is favorable.
Indicator #3: The 1-month percentage change in the PPI is +0.06%. This indicator is favorable because this value is between +4% and -2.2%.
This model has been reading +3 since the end of December 2022 and will read +3 again at the end of January 2025.
The logarithmic chart below displays the growth of $1 in the Dow Jones Industrials since 1914 if held only when the PPI Model = +3 (i.e., if all three PPI indicators were rated bullish at the end of the previous month) through December 2024. $1 grew to $11,119.
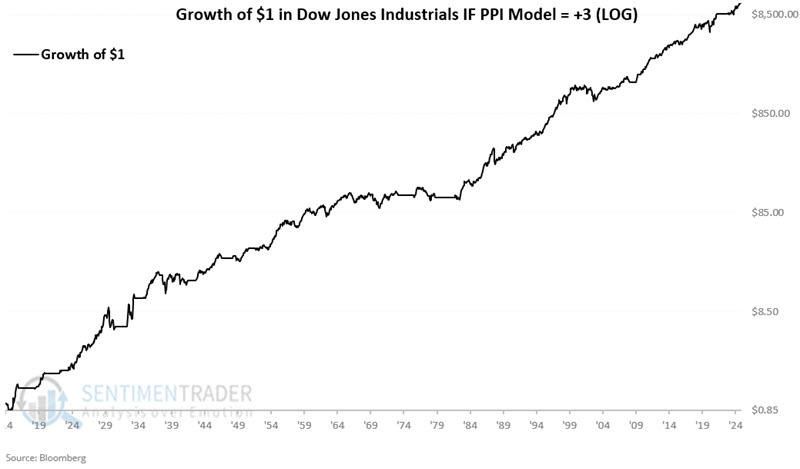
Does this imply that stocks can't go down in the month ahead? Not at all. It only suggests that we should not worry about inflation as a reason stocks suffer significantly.
By contrast, the chart below displays the growth of $1 in the Dow Jones Industrials since 1914 if held only when the PPI Model is LESS THAN +3 (i.e., 0, +1, of +2). The cumulative loss is -93.7%.
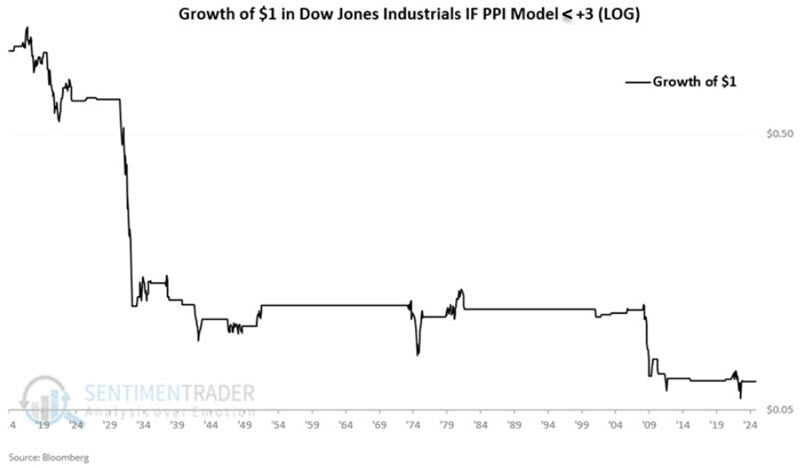
The devastating decline during the early 1930s (a result of deflation rather than inflation) accounted for much of the overall decrease during unfavorable periods. So, let's look at post-1932 sell signals to assess their usefulness.
The chart below displays the growth of $1 in the Dow Jones Industrials since July 1932, when the PPI Model reads anything less than +3.
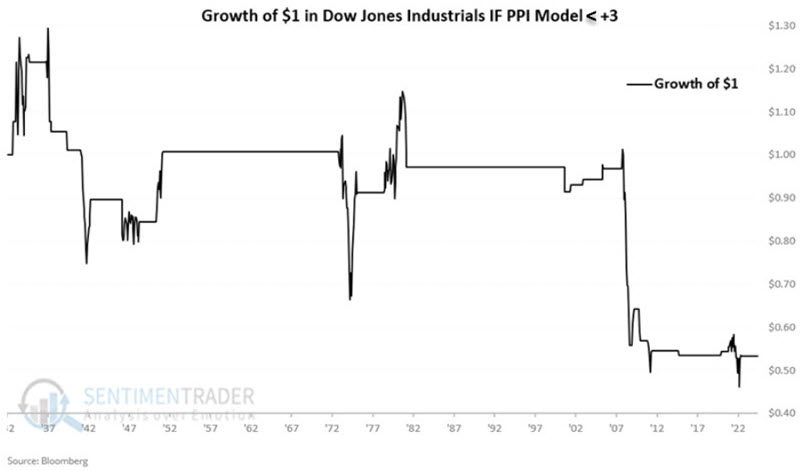
While there are points in the chart above where the stock market rallied, the bottom line is that extremes in PPI readings did an excellent job of warning investors before several severe stock market declines. The cumulative growth during unfavorable periods since 1932 is a loss of -47%.
Summary of performance
The table below shows the Dow's performance during favorable (+3 readings) periods and unfavorable (< +3 readings) periods. A "buy signal" occurs at the end of a month in which the model rises from below +3 to +3. A "sell signal" occurs at the end of a month in which the model drops below +3.
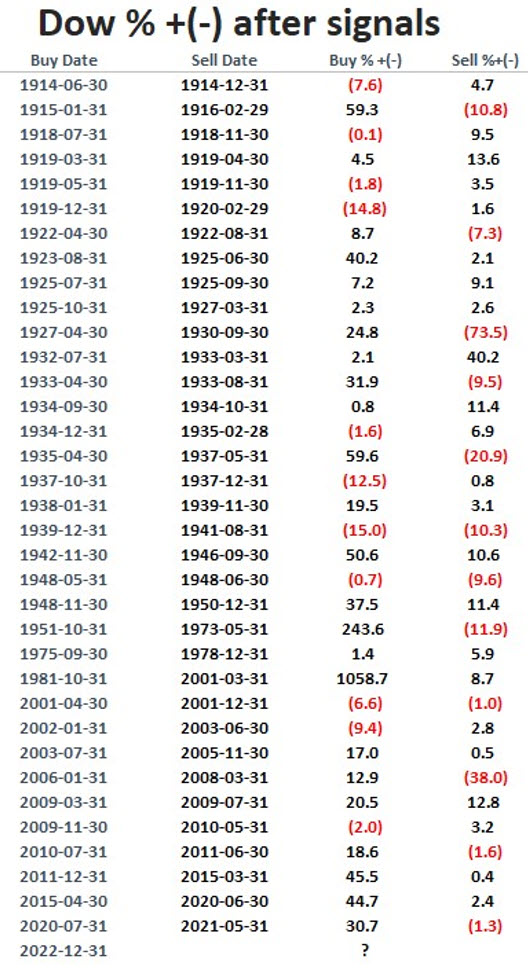
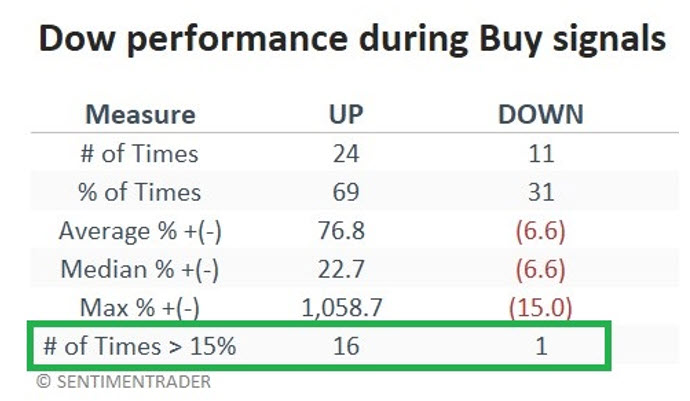
Since the buy signal on 2022-12-31, the Dow gained +34.4 through the end of December 2024. The table below summarizes the Dow's performance during buy signals.
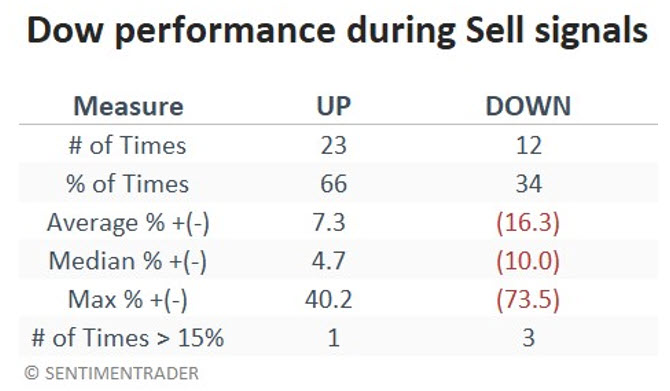
The table below summarizes the Dow's performance during sell signals.
What the research tells us…
Inflation can impact the stock market dramatically. However, for investors, the real key is to assess the current state of inflation "undramatically." Headlines and narratives regarding inflation are typically intended to generate an emotional response. The trick is to examine the data as objectively as possible. The reality is that many forms of inflation (rent and food, for example) remain challenging for many consumers. However, our objective here is not to assess the impact of inflation on the "man in the street" but rather to determine the likely effects of inflation on stock prices.
The current favorable status of the PPI Stock Market Model model (i.e., a +3 reading) detailed here does not guarantee higher stock prices. But it does suggest that any fearmongering based on the latest inflation data is likely misguided. Investors might look at this model at the end of each month.