
An (not for the faint of heart) opportunity in biotech

Key points
- Biotech is one of the most volatile and unpredictable sectors
- In the current market environment, the preference to shy away from a sector like biotech is strong
- With those caveats firmly in mind, the most aggressive of speculators may find some recent signals in this sector particularly intriguing
Biotech traders are understandably fearful
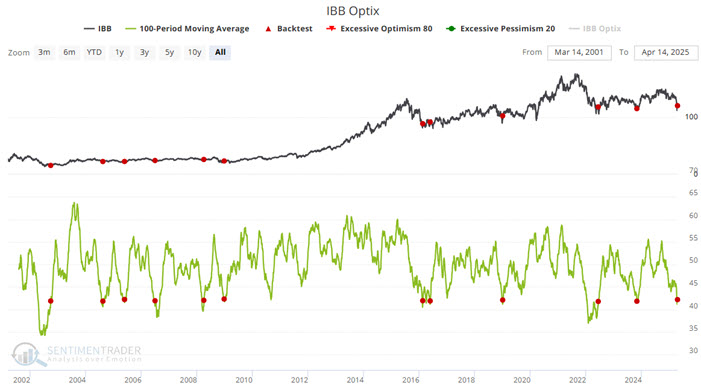
The iShares Biotechnology ETF (IBB) tracks the ICE Biotechnology Index and trades roughly 1.5 million daily shares. From its high in November 2024 to its low in April 2025, IBB plunged 27% in value. It's no surprise that traders have swung heavily to the bearish side. However, as purveyors of sentiment extremes, we know that this type of crowd action can often lead to opportunity.
The chart below highlights those dates when the 100-day moving average for our IBB Optix indicator crossed above 41.75 for the first time in three months. The most recent signal occurred on 2025-04-14.
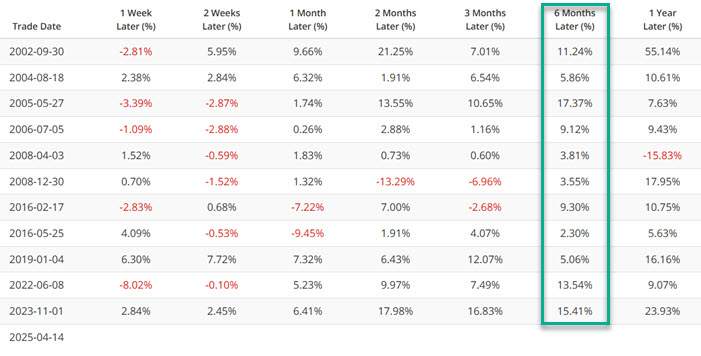
The table below displays IBB performance following previous signals.
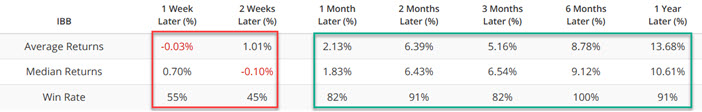
The table below summarizes IBB's performance from the chart and table above.
Biotech's' correlation to the healthcare sector might matter
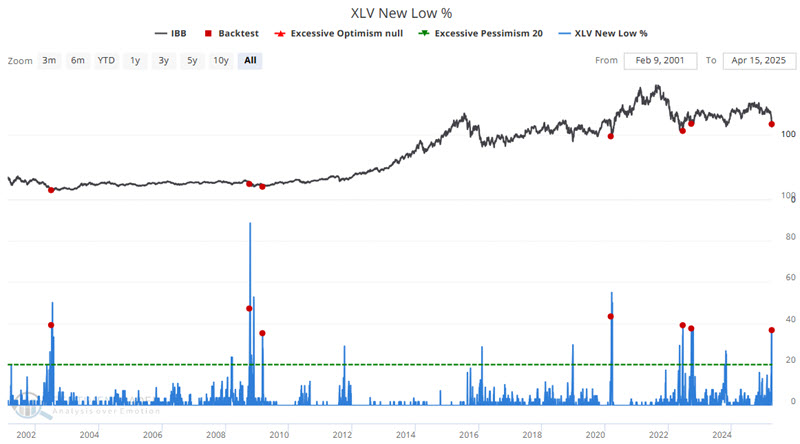
During the recent market plunge, the number of healthcare stocks making new 52-week lows spiked to a significantly high level above 35%, often a sign of an overdone decline. Ticker IBB enjoys an almost 80% correlation with the Health Care Select Sector SPDR Fund (XLV). As a result, what affects the broader healthcare sector can also impact biotech.
The chart below highlights those dates when the XLV New Low % indicator crossed above 35% for the first time in three months. As you can see, this doesn't happen often, so the sample size is relatively small. Nevertheless, the results are compelling.
The table below summarizes IBB performance following previous signals.
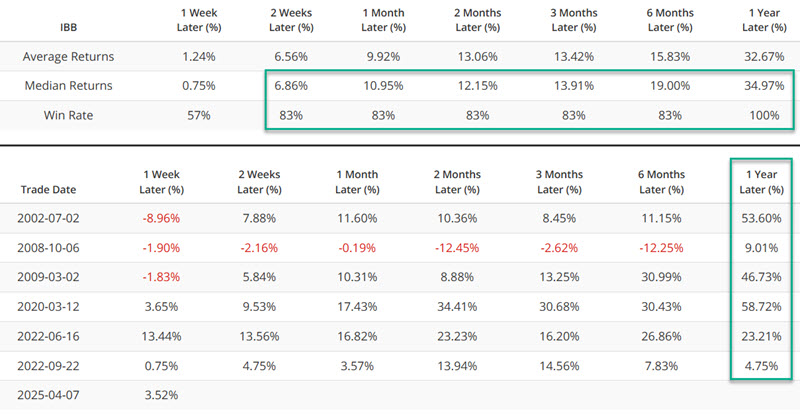
Note that the most recent signal occurred directly in the heat of the recent market plunge and that IBB has already bounced notably higher. That said, the twelve-month historical results suggest that there could be further upside potential.
XBI also experiences a significant sentiment extreme
The SPDR S&P Biotech ETF (XBI) is another biotech ETF. It tracks the S&P Biotechnology Select Industry Index and trades roughly 10 million daily shares. It, too, recently experienced an extreme sentiment.
The chart below highlights those dates when the 3-day moving average for our XBI Optix indicator crossed below 5 for the first time in three months.
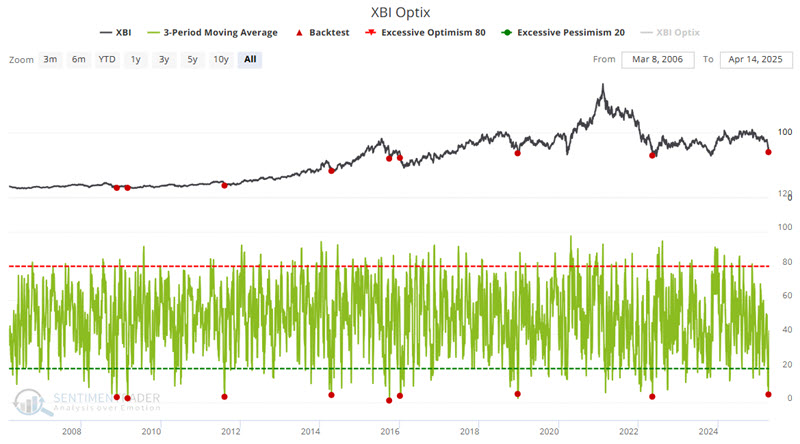
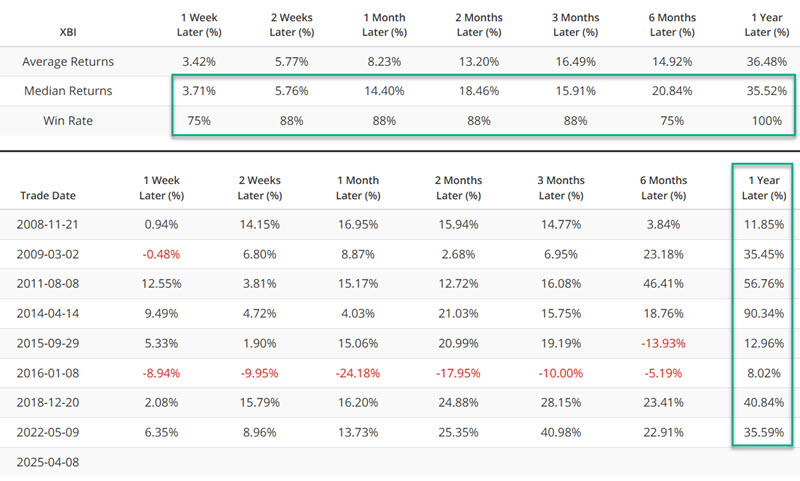
The table below summarizes XBI performance following previous signals.
What the research tells us…
The historical performance of the biotech sector, as shown by the signals highlighted above, is compelling. But nothing is ever guaranteed. No signal is ever guaranteed to be correct the next time around. Likewise, biotech is one of the most volatile sectors a person could choose to trade. Additionally, the current market environment is essentially one of "risk off" leanings. Volatile sectors tend to be even more volatile during such periods. All in all, there are many good reasons to steer clear of an unpredictable sector like biotech at the moment. That said, there are also at least a few compelling reasons to consider a small position in the expectation that the year ahead may be quite surprising to the upside.