
An industrial strength rally

Key points:
- The industrial sector broke out to a record high, while all others are at least 1% below theirs
- Lonely breakouts by industrials have been a decent sign for the U.S. economy and stock market
- While retail investors seem to be selling, corporate insiders have been buying, helping support the average stock
An industrial-sized breakout
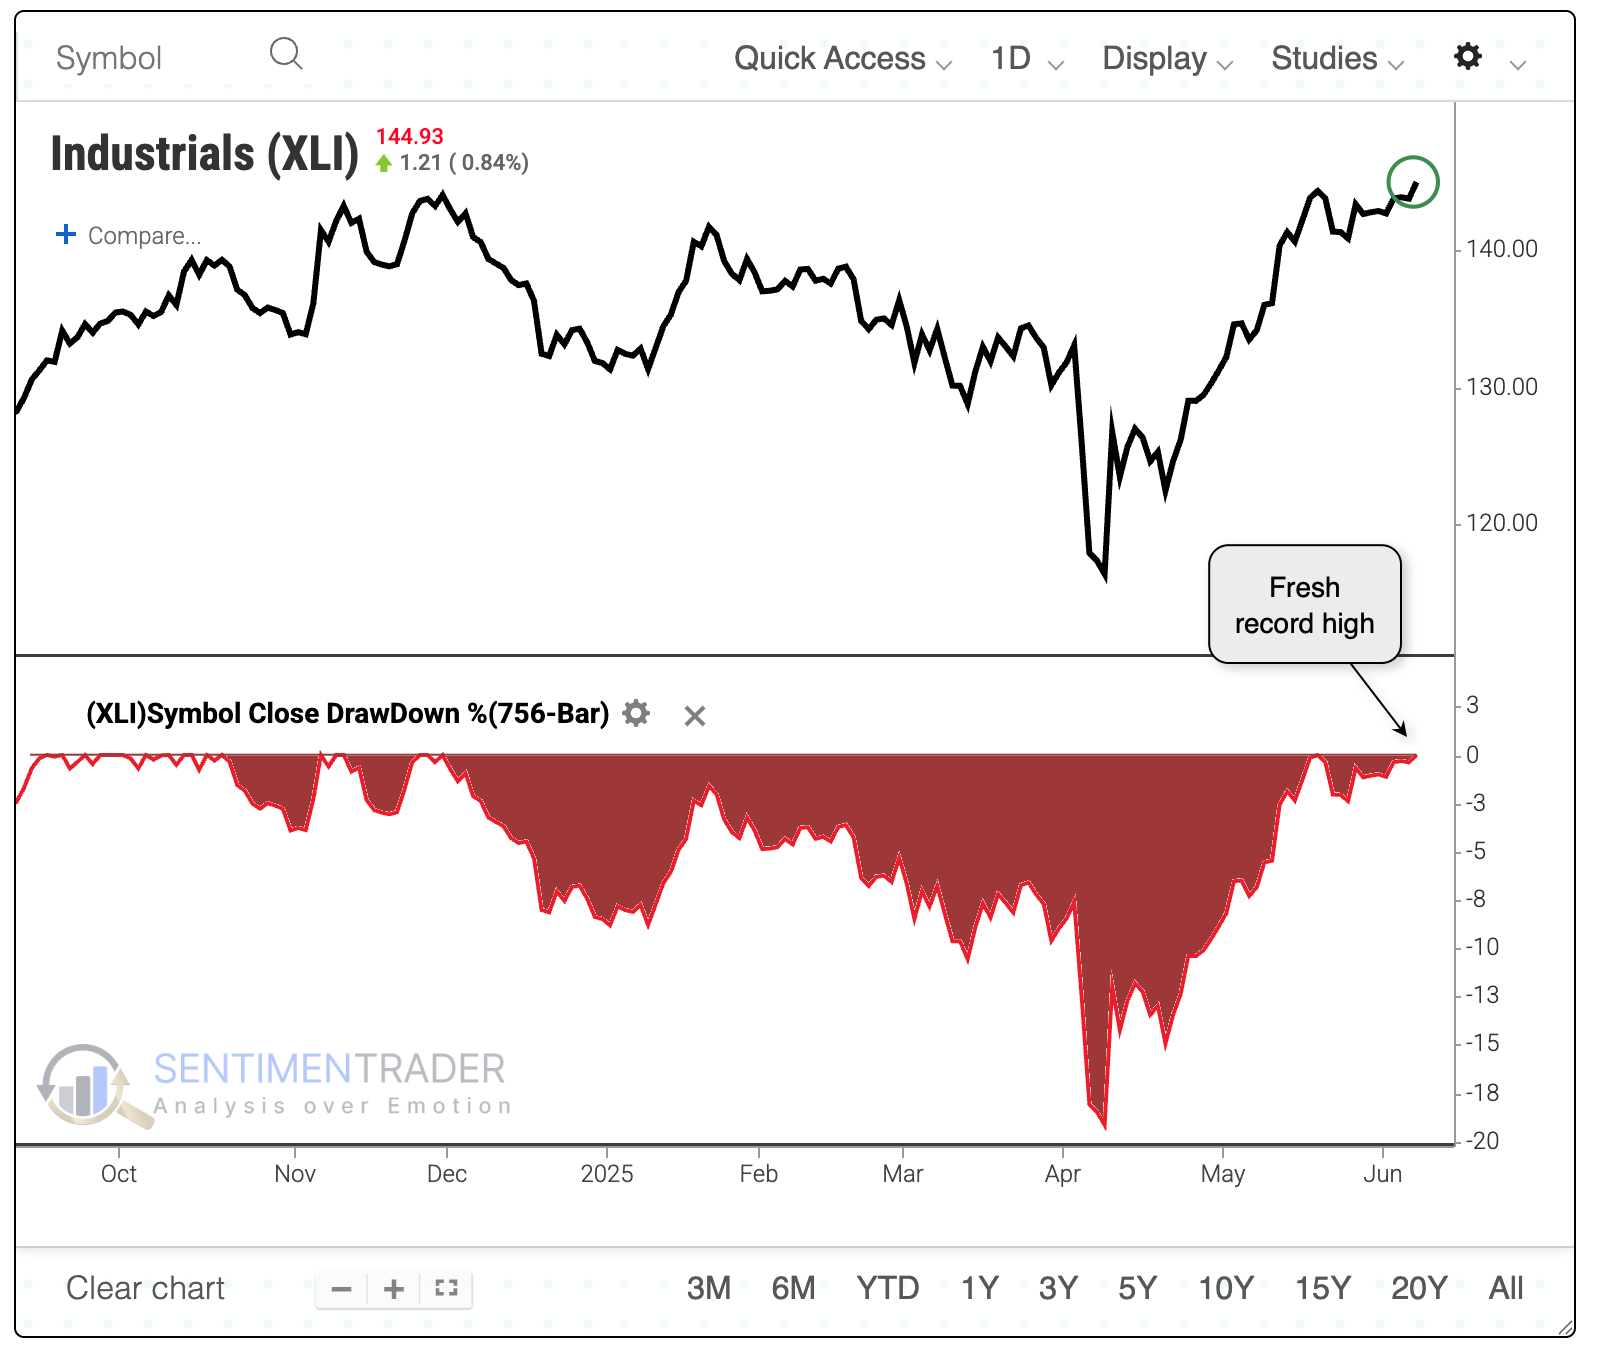
One sector has reached a record high, and it should be a good one.
Among major S&P 500 sectors, industrials are the first to power to a new high. All the others, including the S&P 500 itself, are at least 1% off their own highs.
From Perplexity:
The industrials sector includes companies that manufacture and distribute capital goods, provide commercial and professional services, and offer transportation services. In addition to manufacturing, the sector encompasses commercial services like waste management, data processing, and security. Transportation is another key, with companies involved in logistics, airlines, railroads, and shipping playing a crucial role in the movement of goods and people. The industrials sector is highly sensitive to economic cycles, typically expanding during periods of economic growth and contracting during recessions. Its performance is often viewed as a barometer for the broader economy.
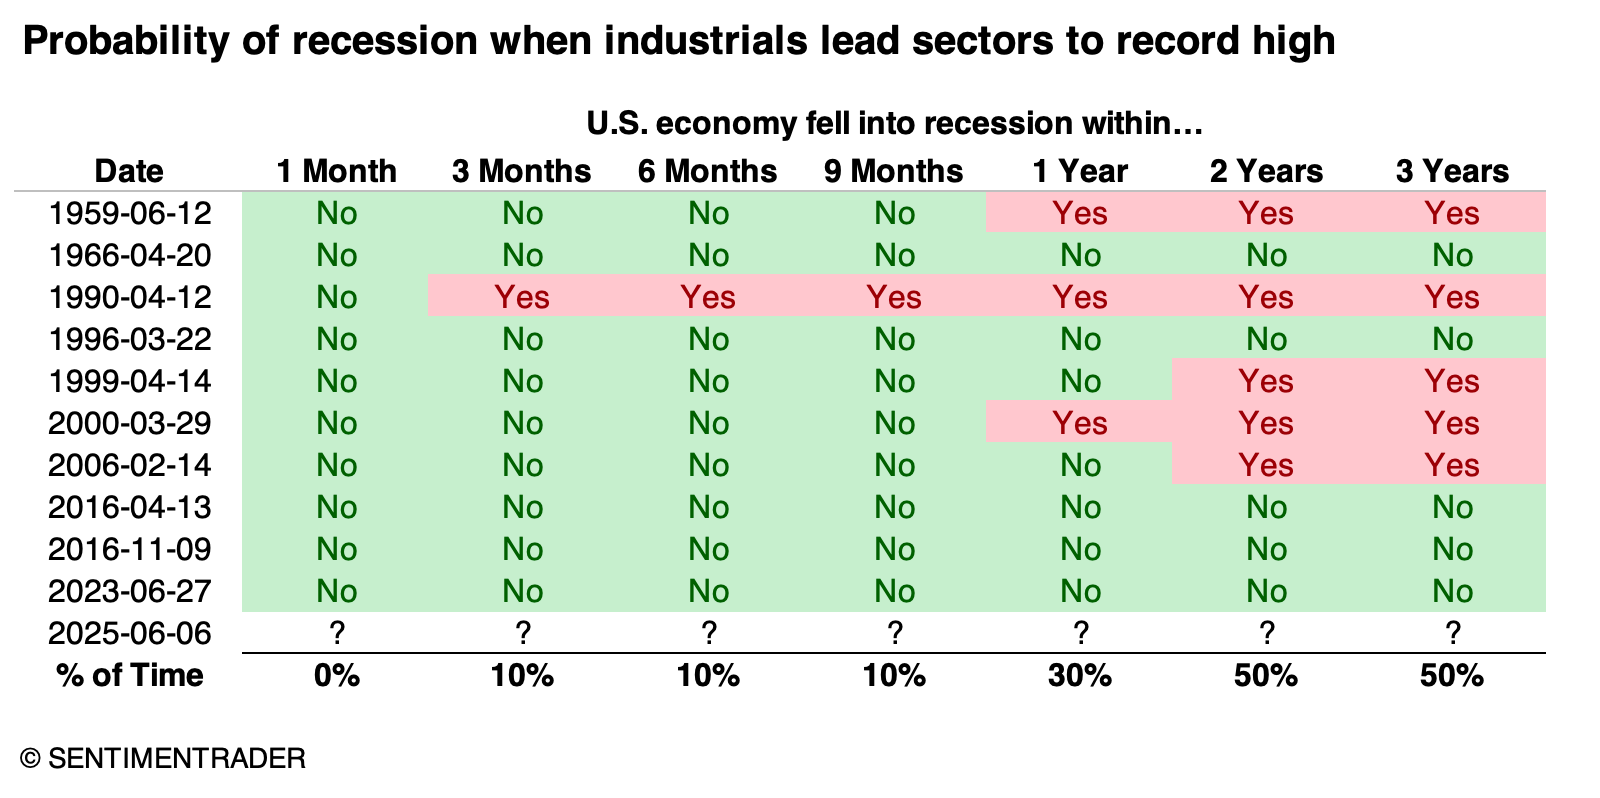
This is supposed to be a good sign for the economy, and by extension, the stock market.
Below, we can see that it was, for the most part. When the industrial sector led all others to record territory, the U.S. fell into a recession only once within the following nine months. However, two more instances were added within a few months after that, including the vicious internet bubble peak of 2000.
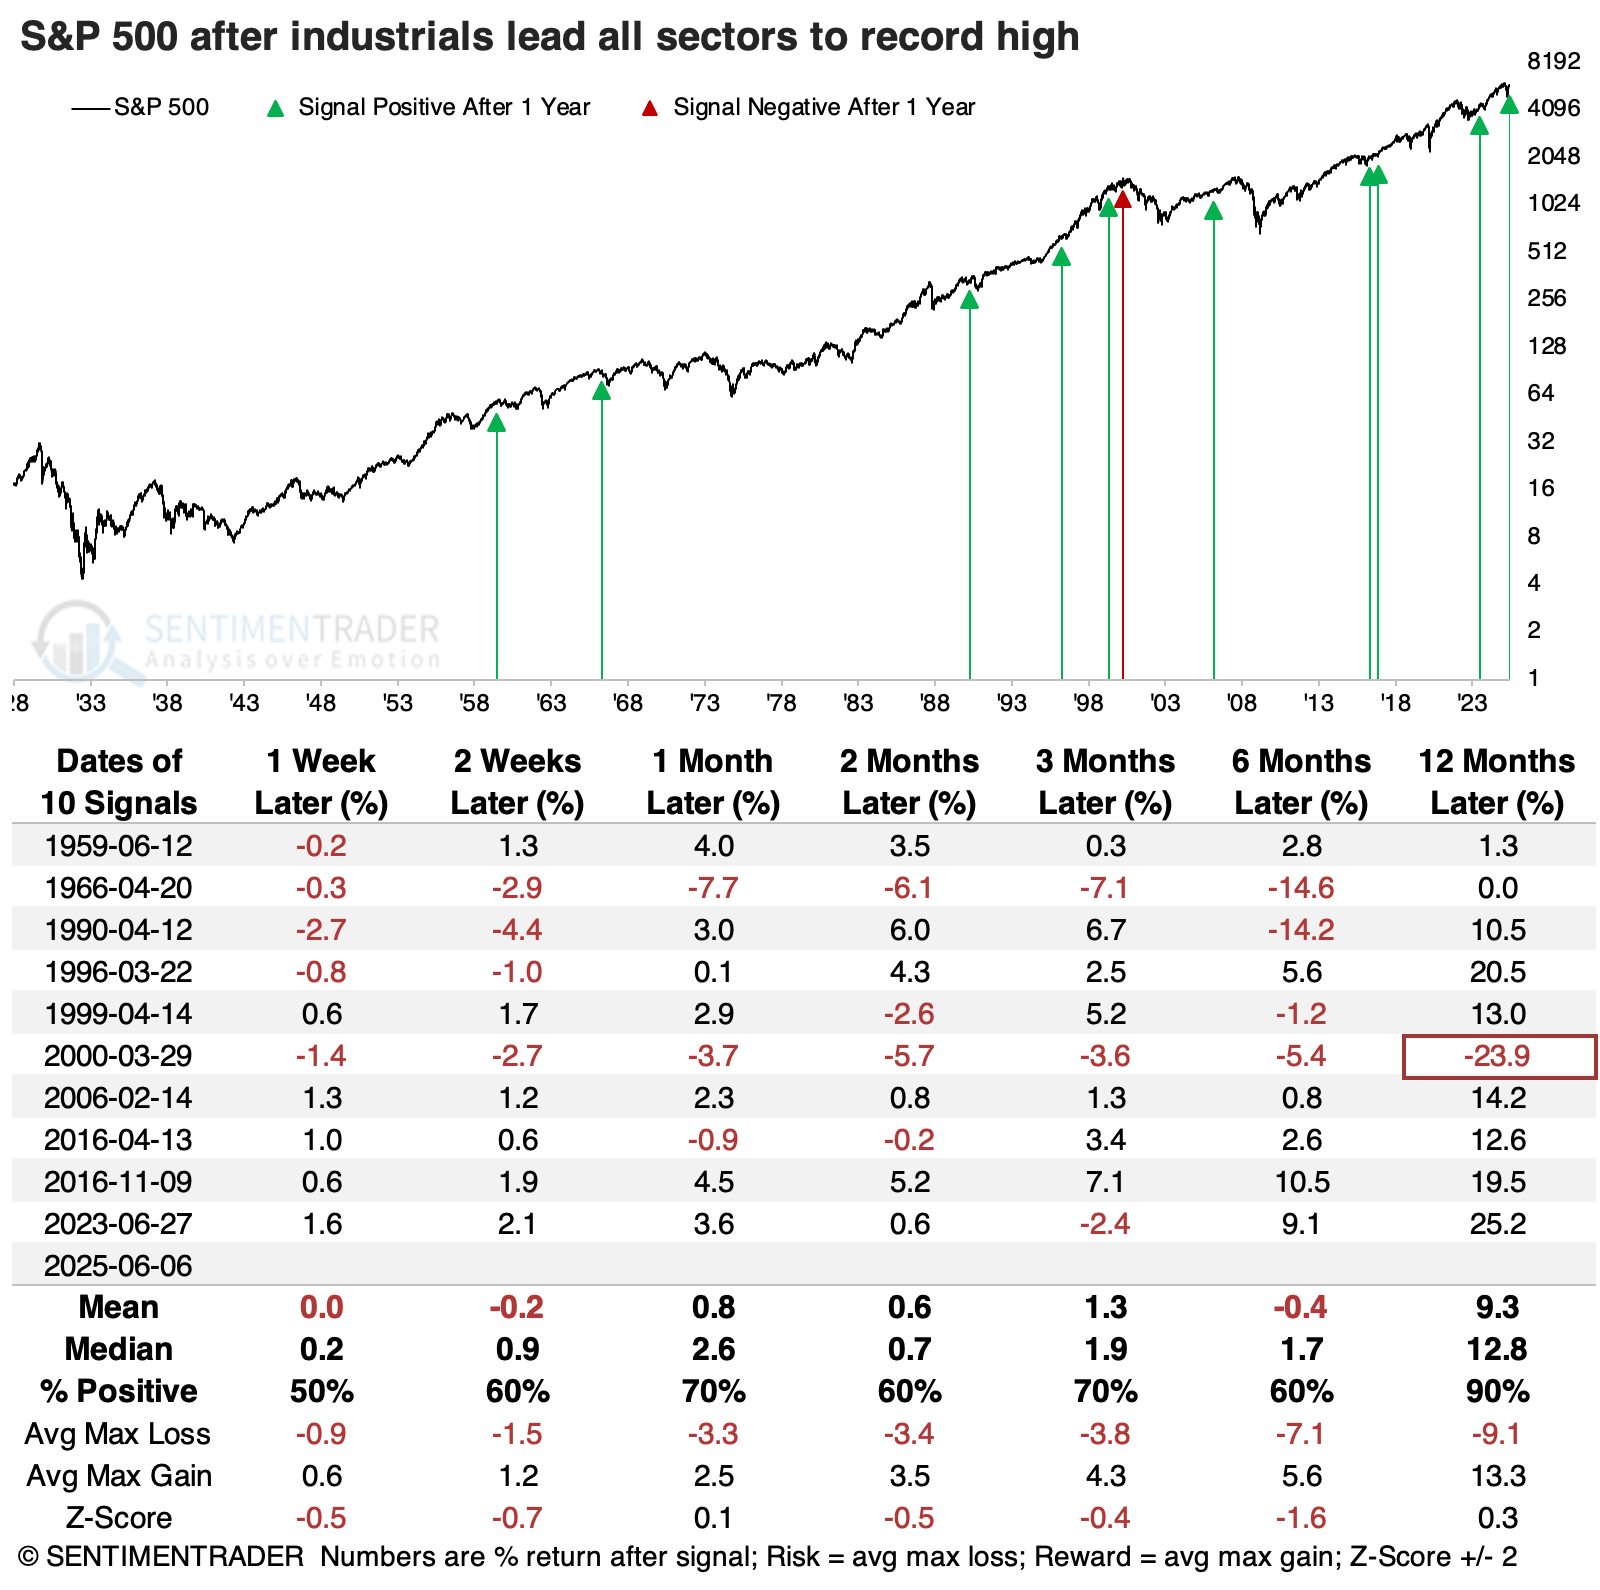
A decent sign for stocks, including industrials themselves
This dynamic is played out in the table below, showing S&P 500 returns after industrials led. The single loss - and it was a doozy - was the blow-off peak in March 2000. All the others preceded gains, though they weren't necessarily strong and without some interim pain. Even though the 1990 signal was the quickest failure in terms of leading to a recession, the S&P 500 didn't fare too poorly.
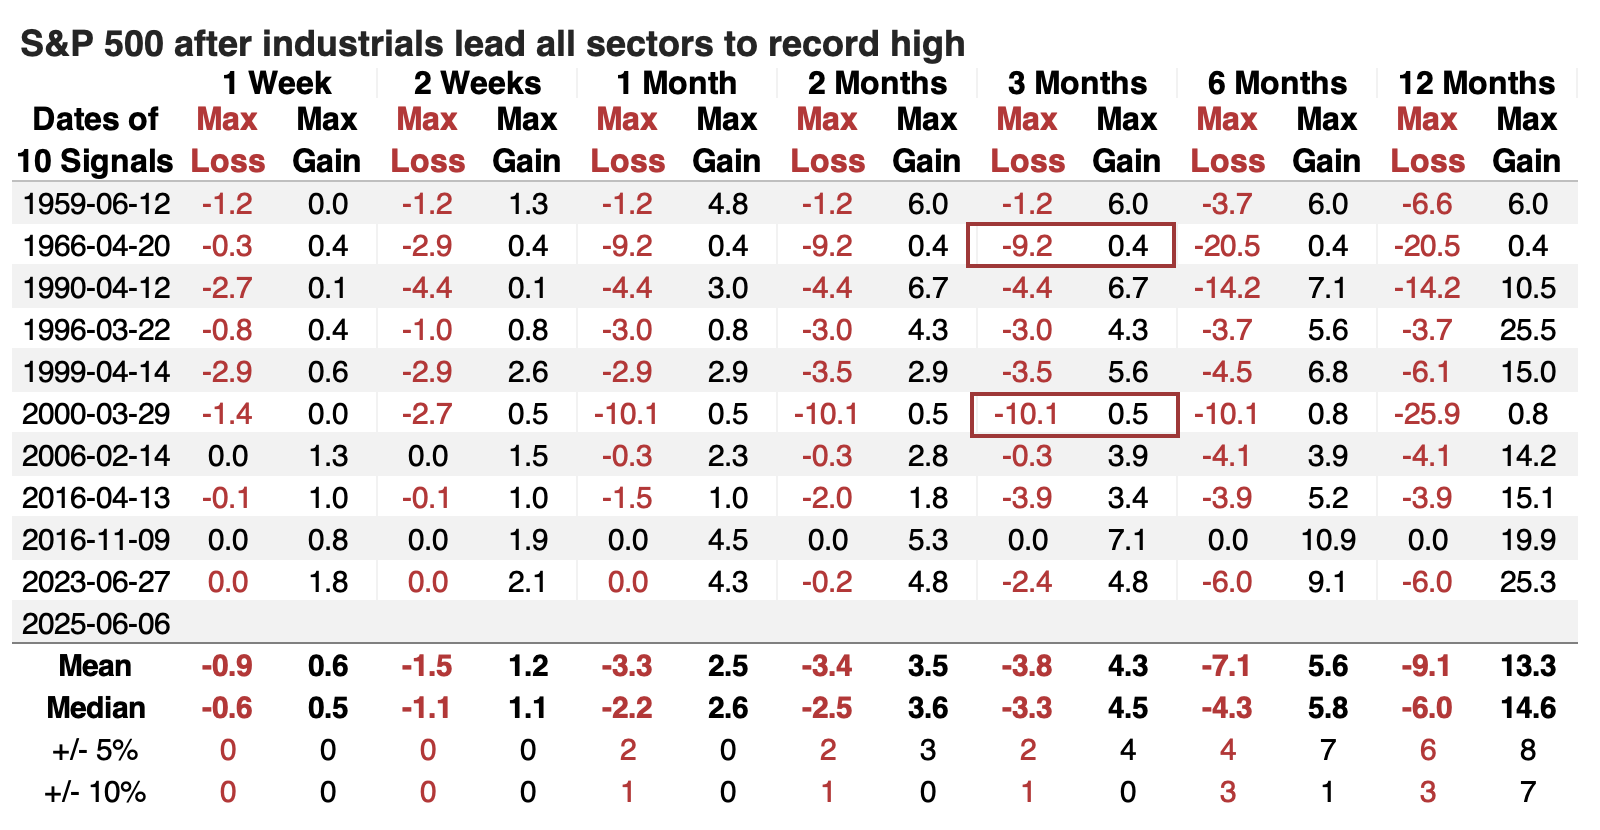
A table of maximum gains and losses across time frames shows that the 2000 signal was the only one that preceded more than a -10% drawdown within the next three months, though 1966 came close and got much worse after that. Drawdowns within the first three months were minimal among the other signals.
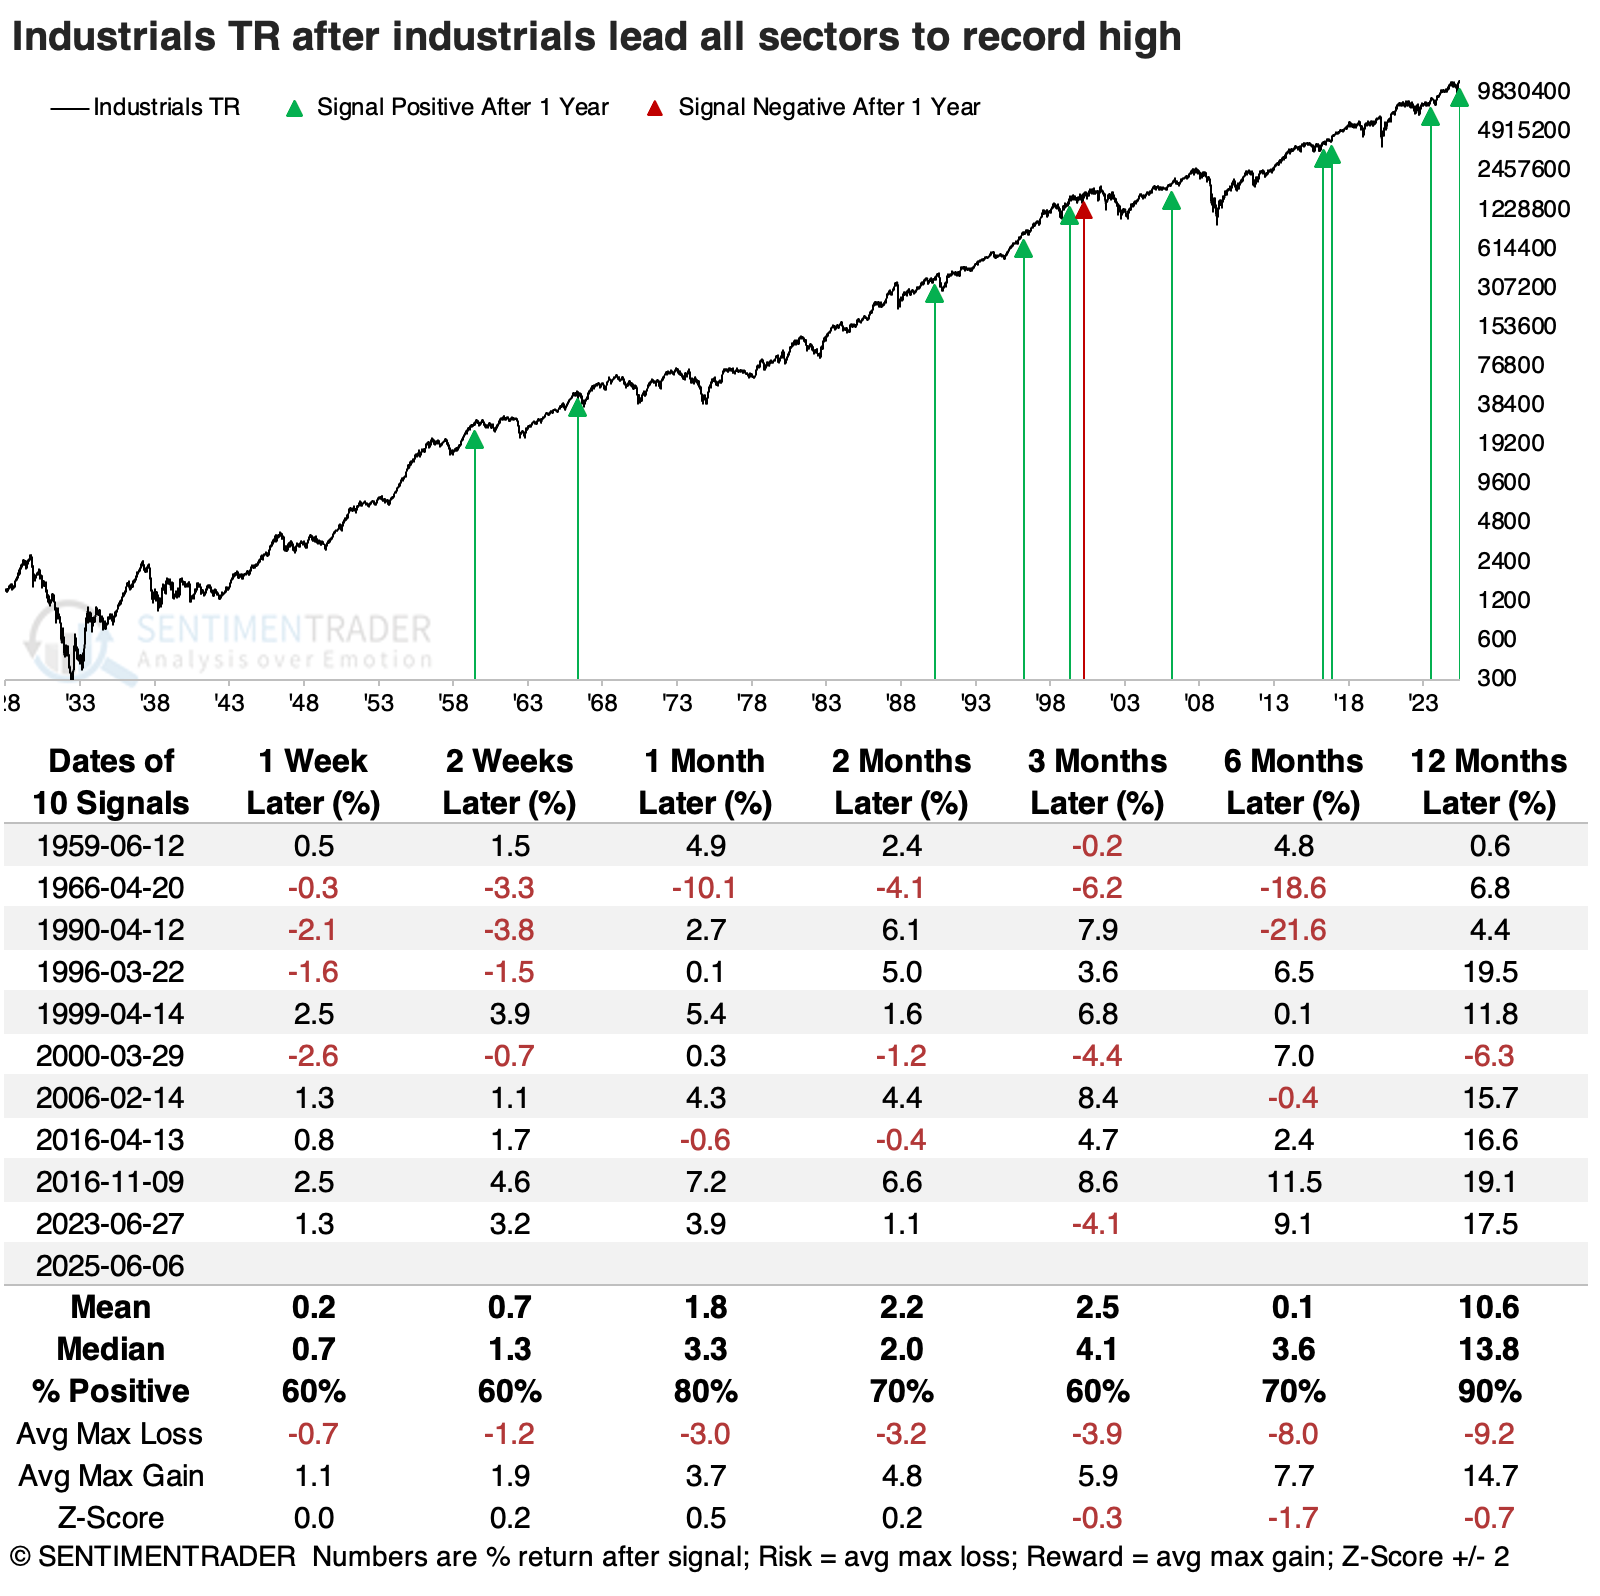
The total return for industrials was consistently positive after it led other sectors to a new high, but not without risk. After 1966 and 1990, the sector witnessed double-digit losses over the following six months. But there was only one minor loss over the next year, as even it succumbed to the year 2000 hangover.
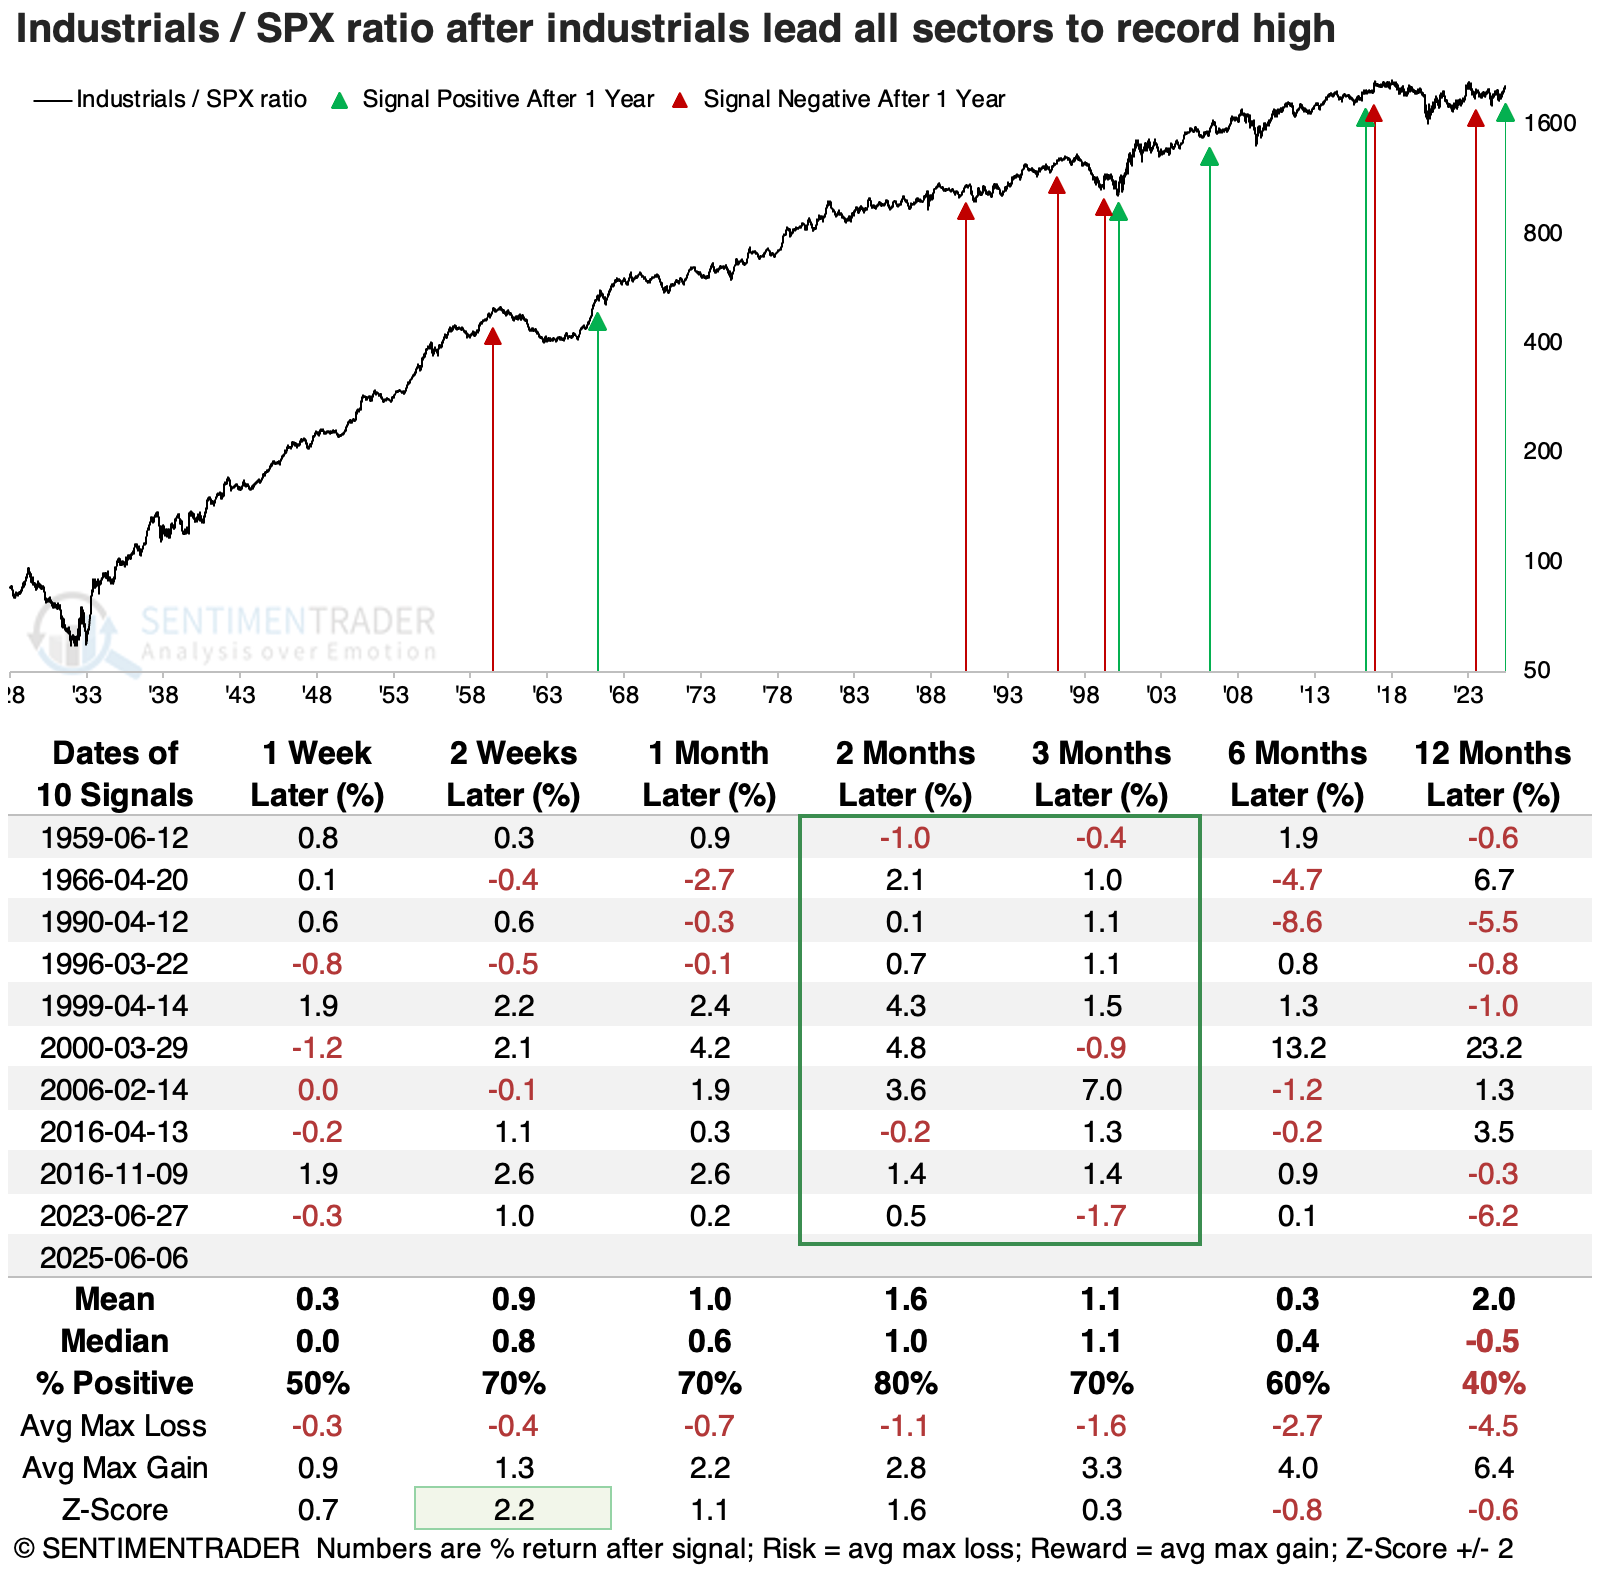
Relative to the S&P 500, industrials held up well, particularly over the next two to three months. The sector outperformed the broader market most of the time, and when it didn't, its underperformance was minor.
After these signals, there was a modest bias toward cyclical sectors over longer time frames.
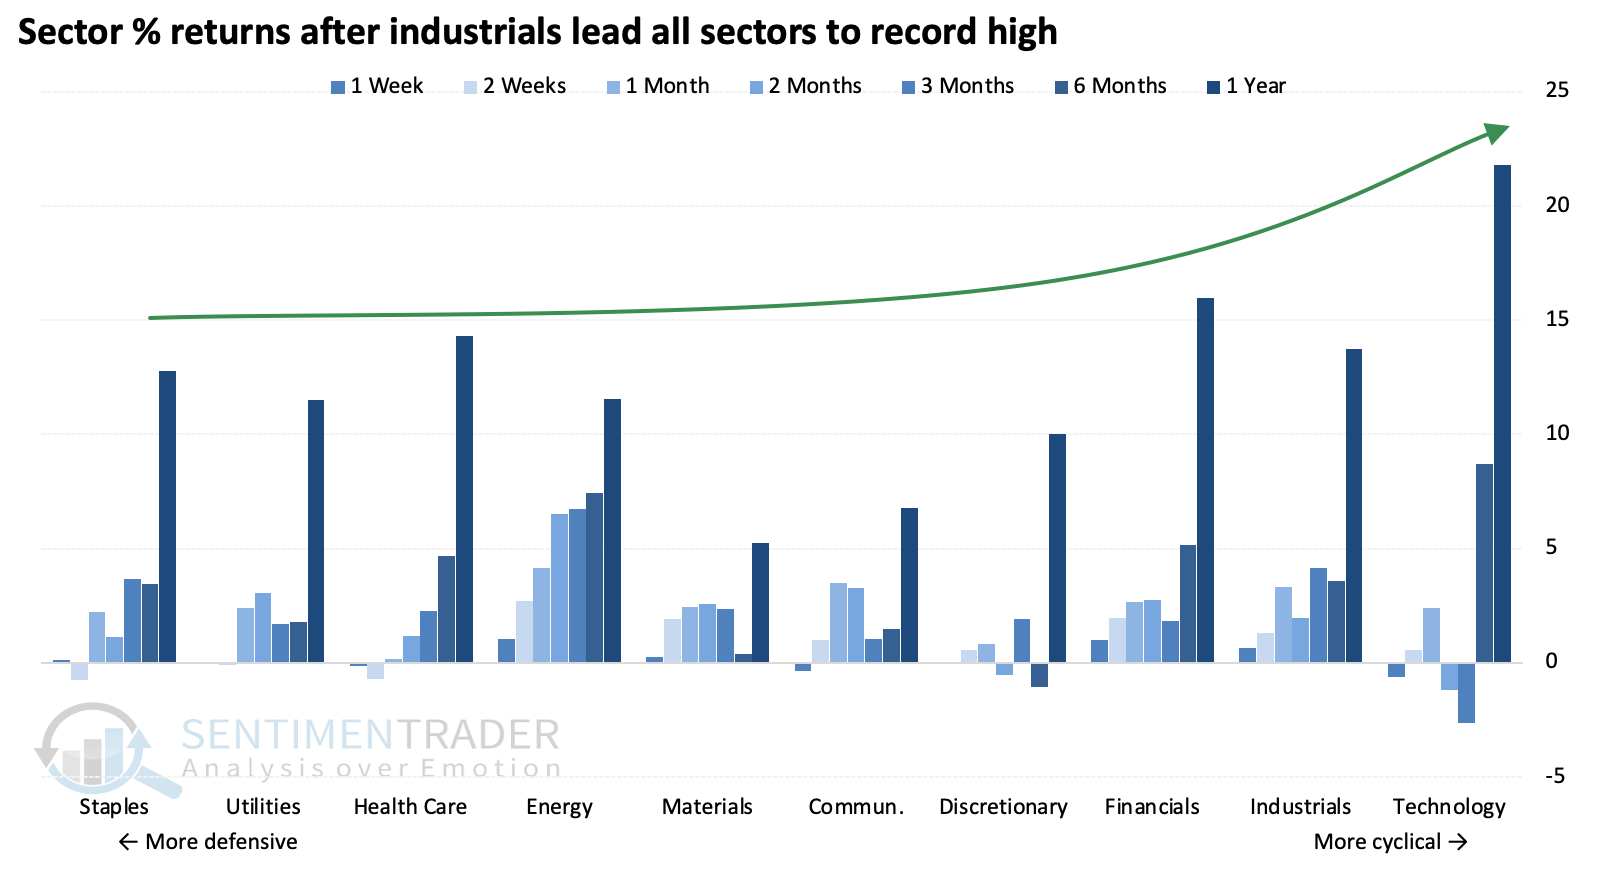
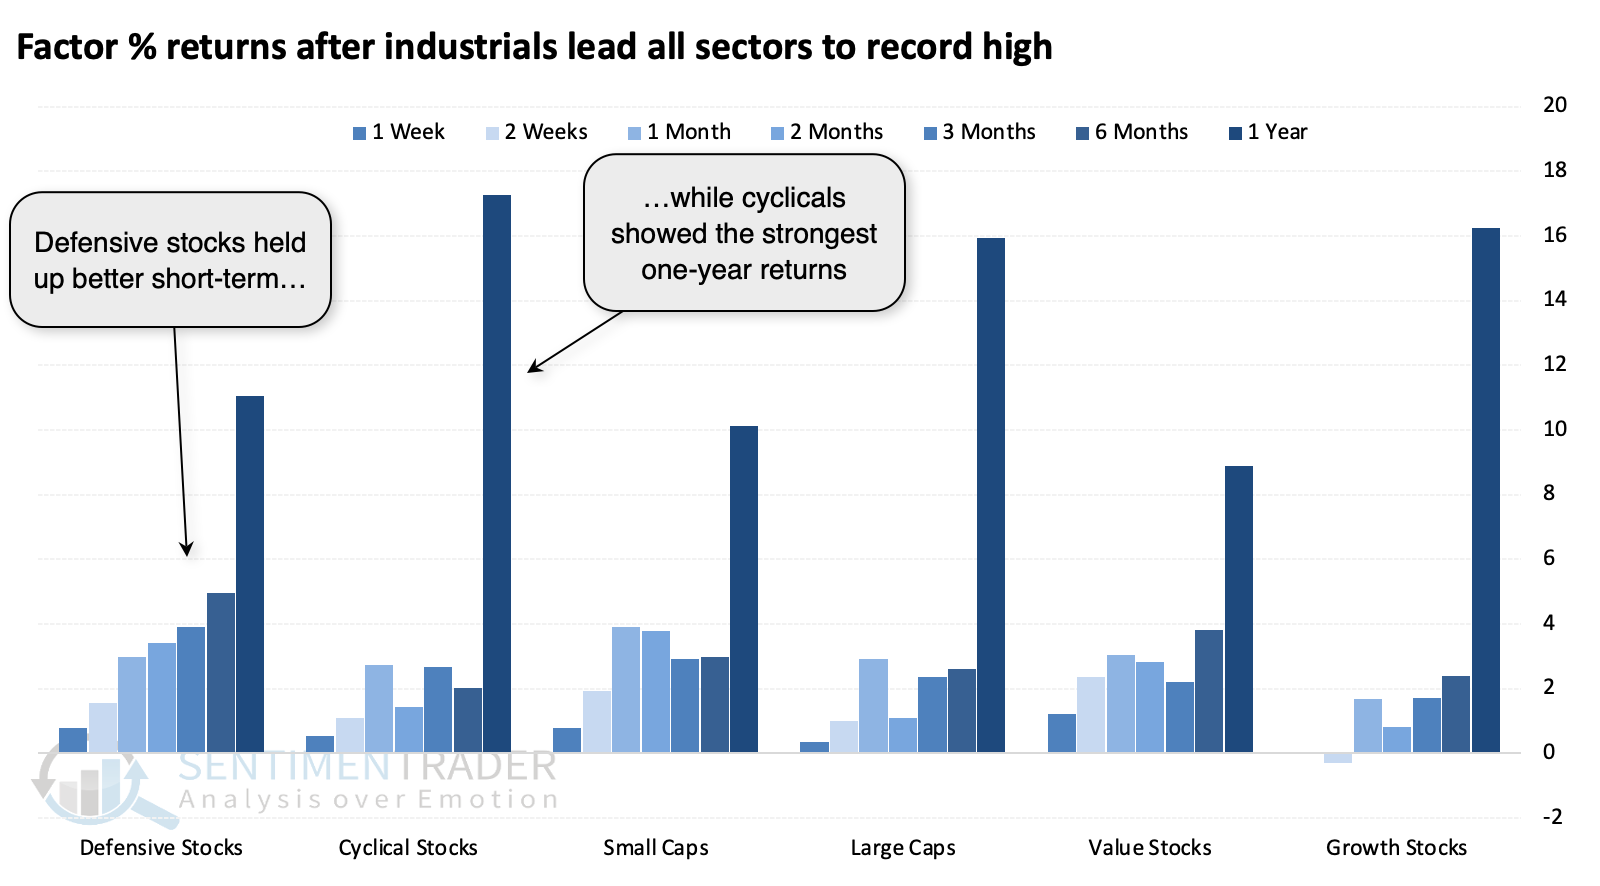
Among factors, we can see that defensive-oriented stocks tended to hold up better over shorter time frames, while cyclical sectors enjoyed the largest one-year average returns, powered by financials, industrials, and technology.
Industrial stocks have held up, in part thanks to insiders
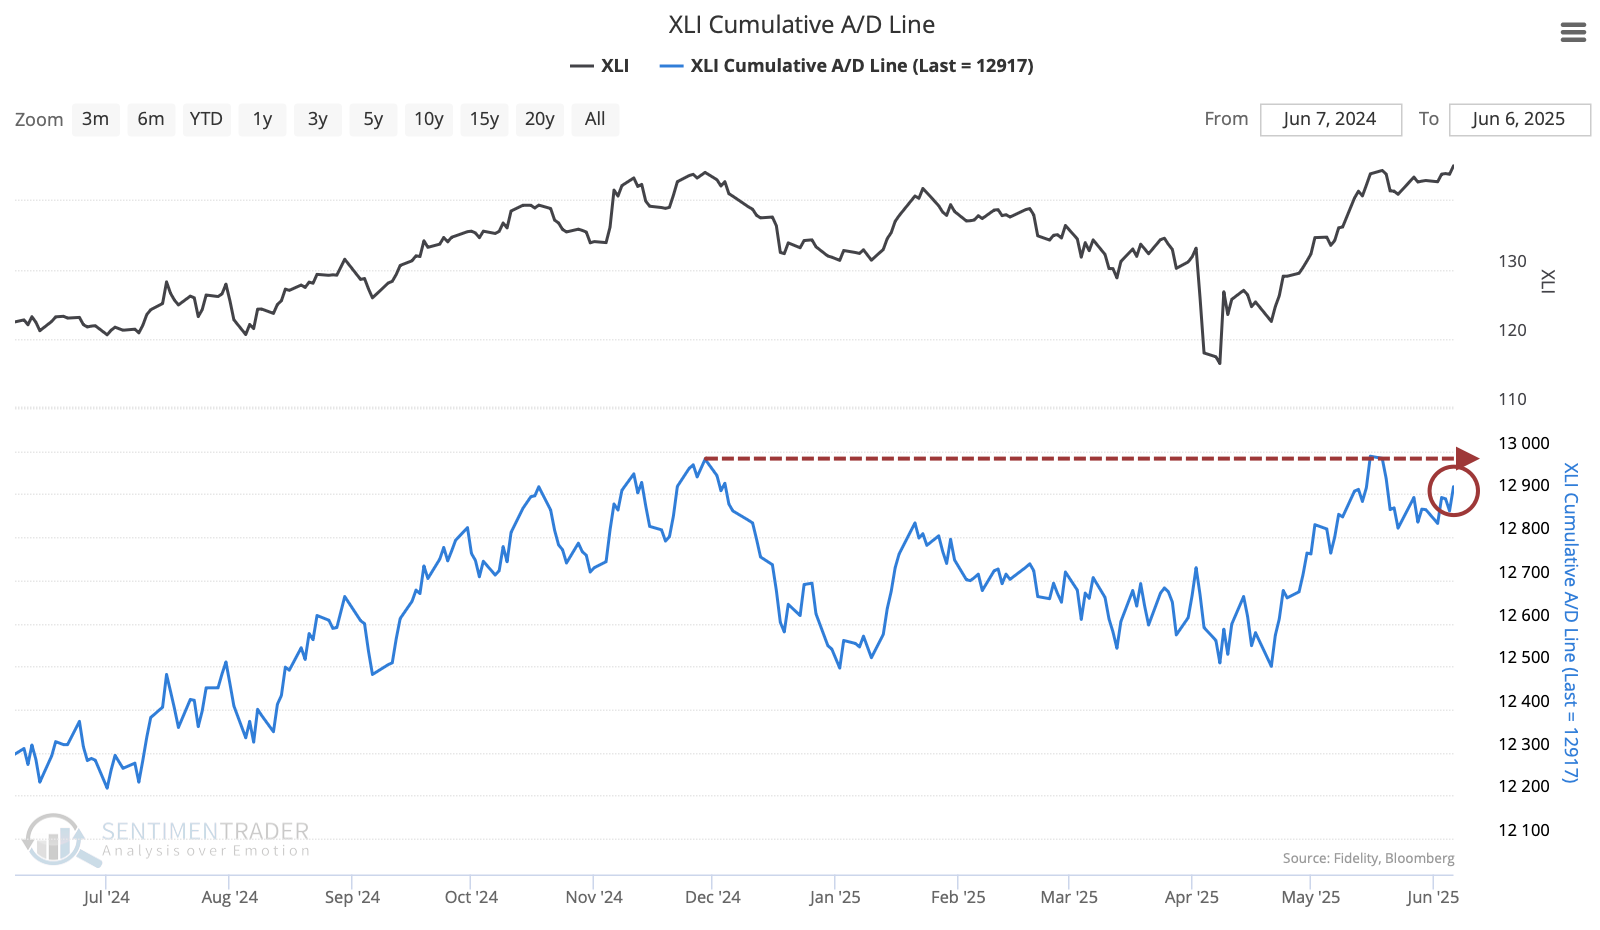
Stocks in the sector have been holding up well, and there aren't too many warning signs. It would be nice if the Cumulative Advance/Decline Line would make a new high along with the index.
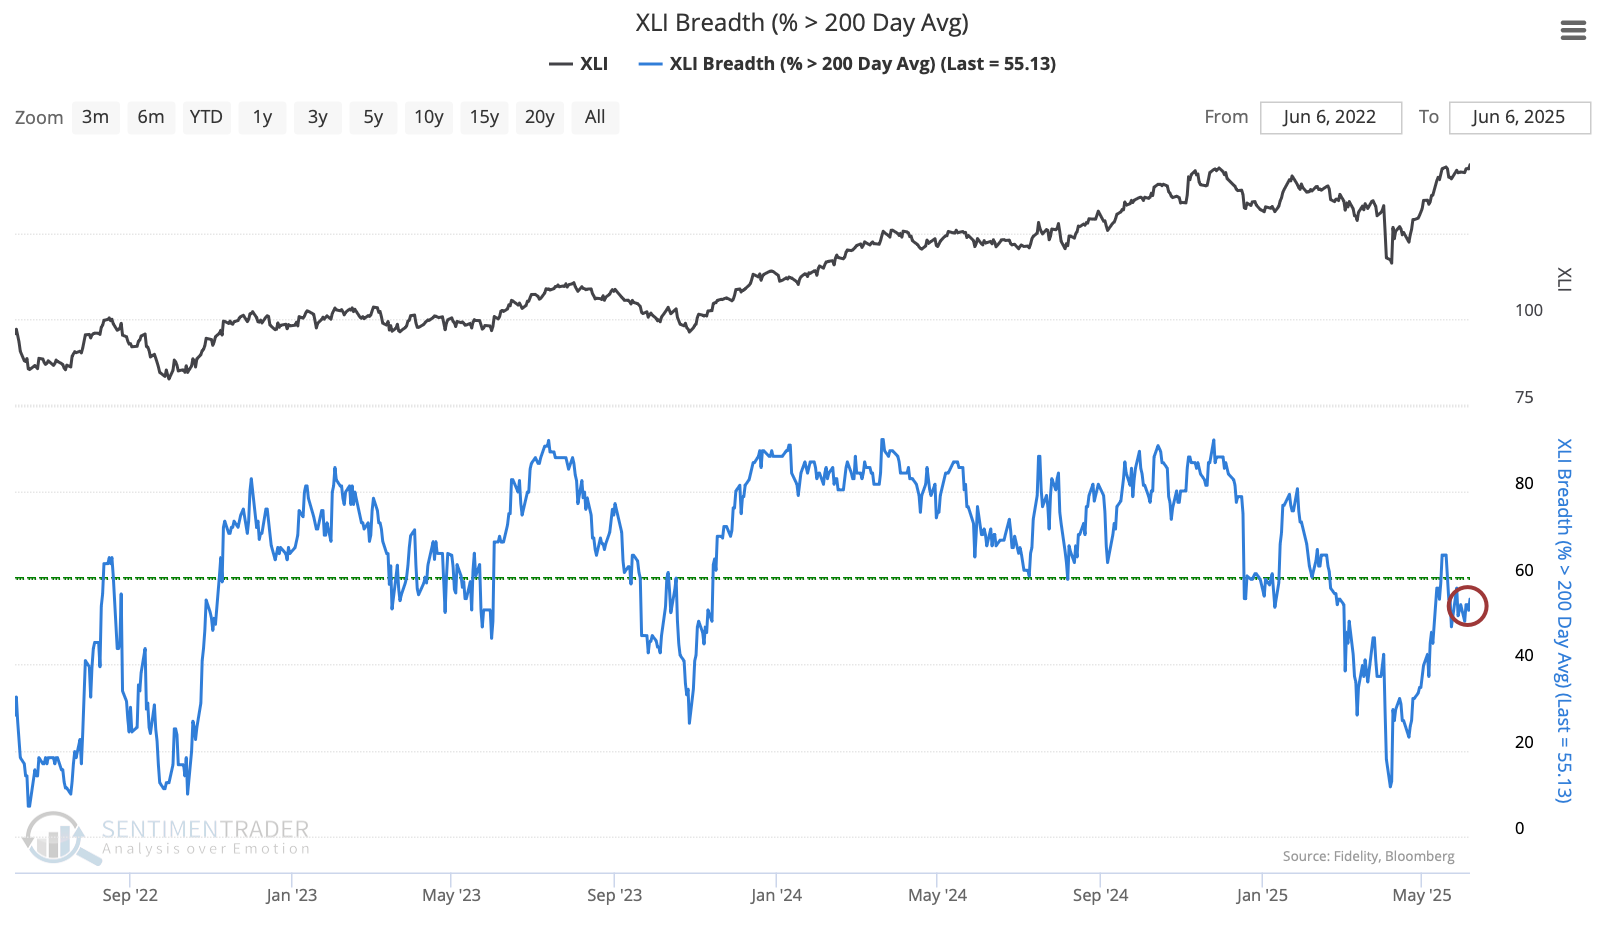
We would also like to see more stocks join the index above their 200-day moving average. Fewer than 60% of industrial stocks are still trading above their long-term average, which is below the threshold for a healthy environment in the sector.
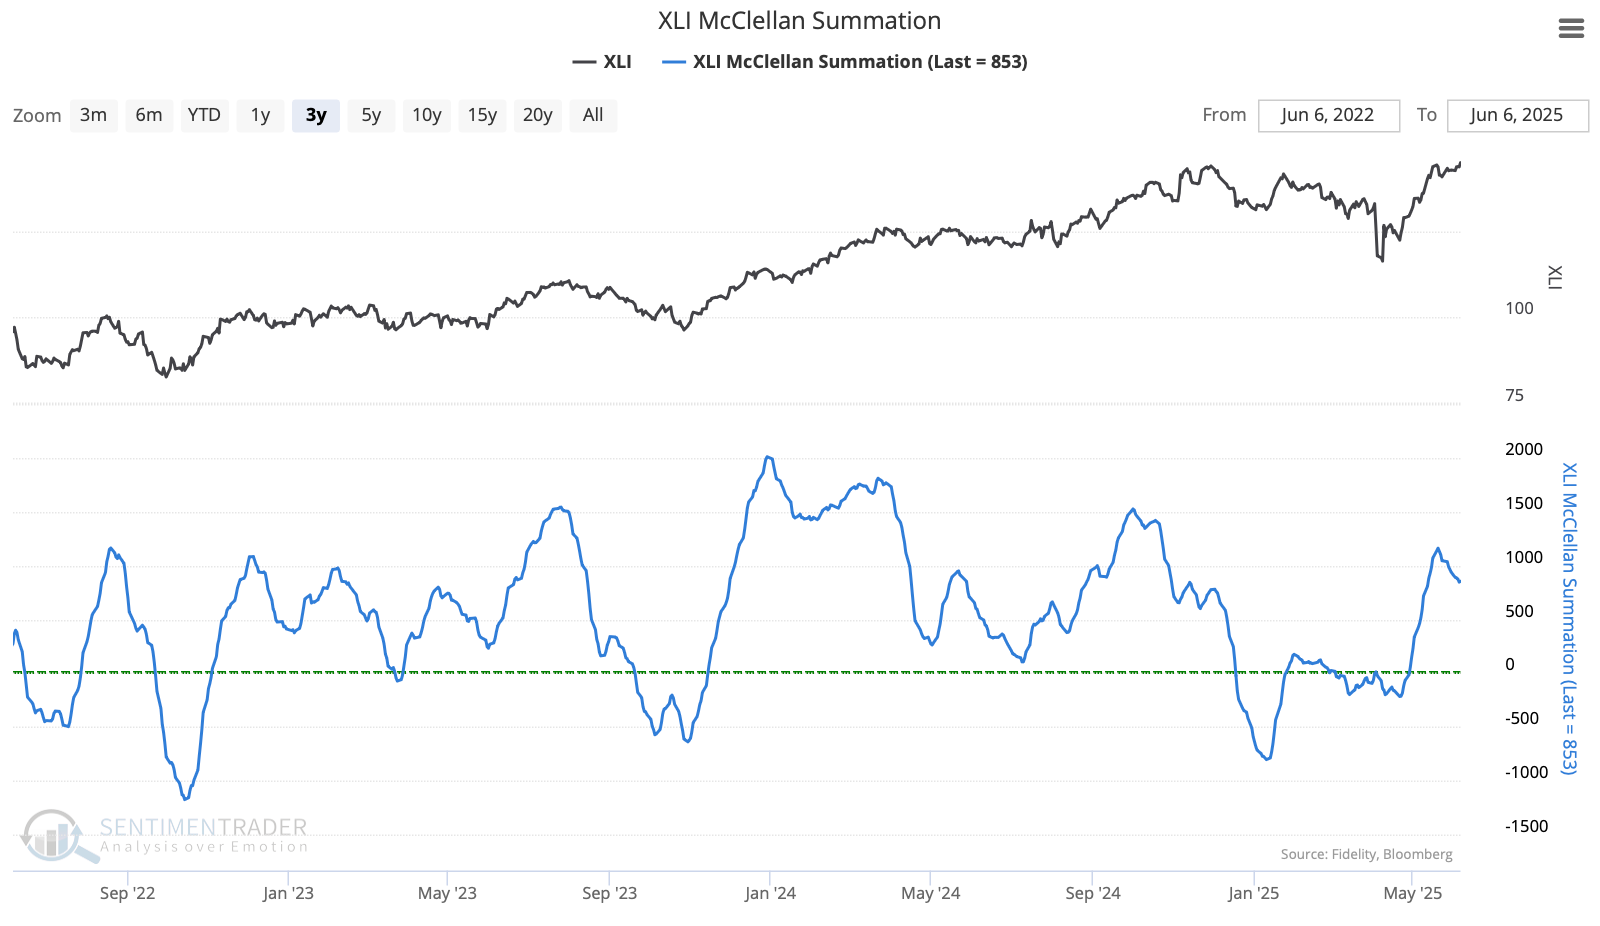
On the plus side, the long-term McClellan Summation Index is well above zero, and even holding above +500, which is typical for strong, sustained advances.
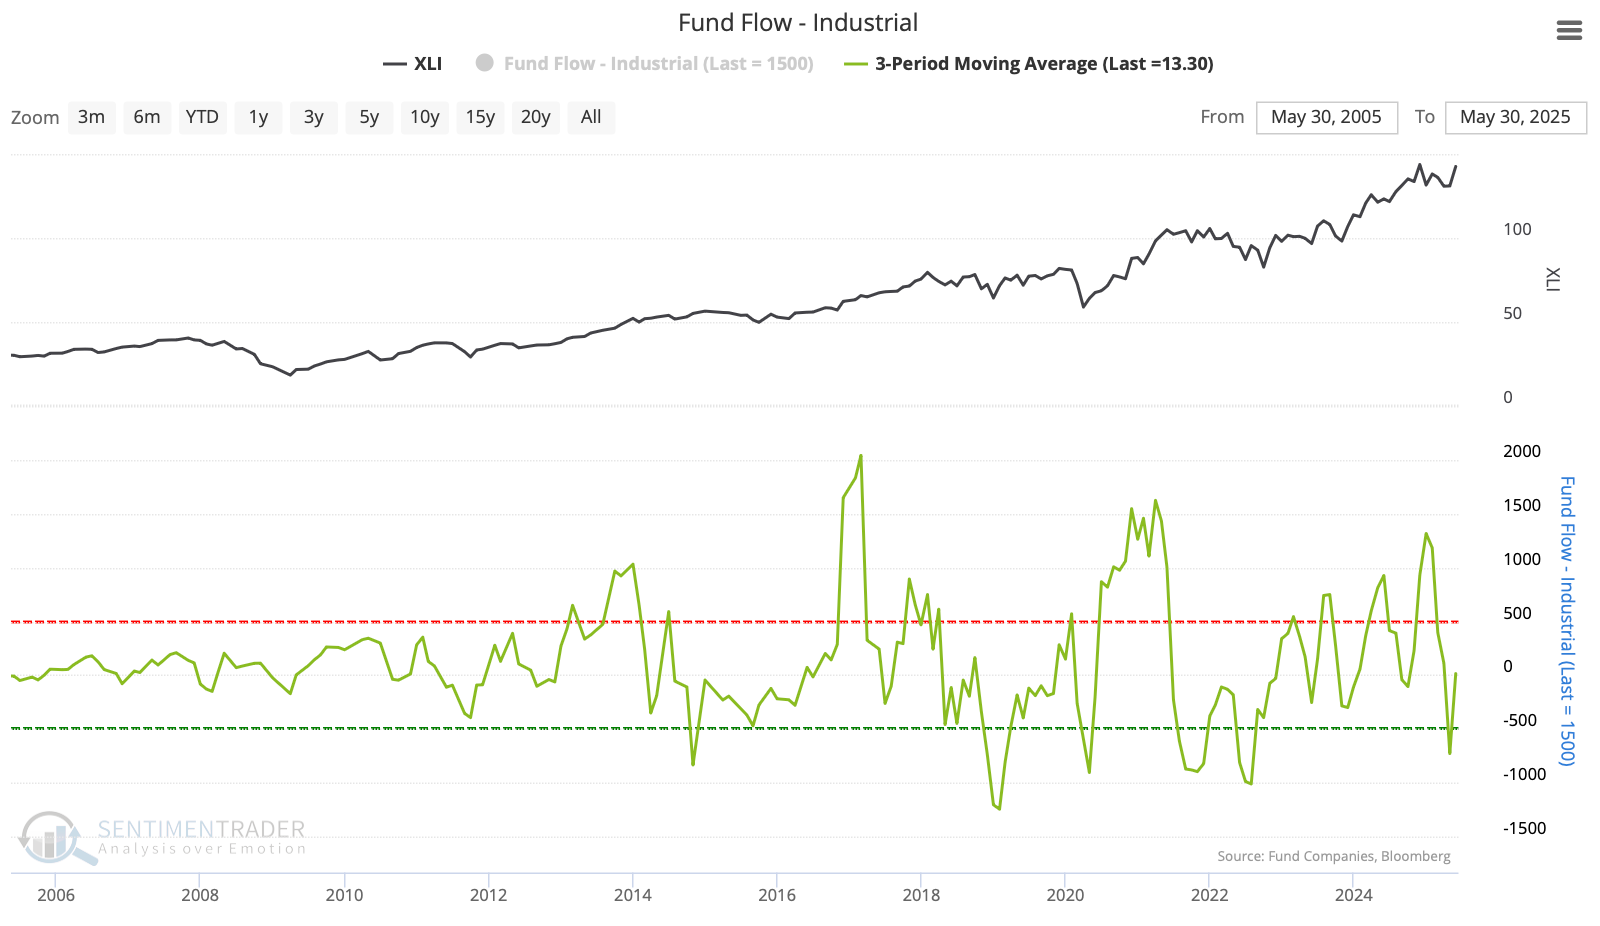
This is despite mostly retail-fueled outflows among industrial ETFs over the past several months.
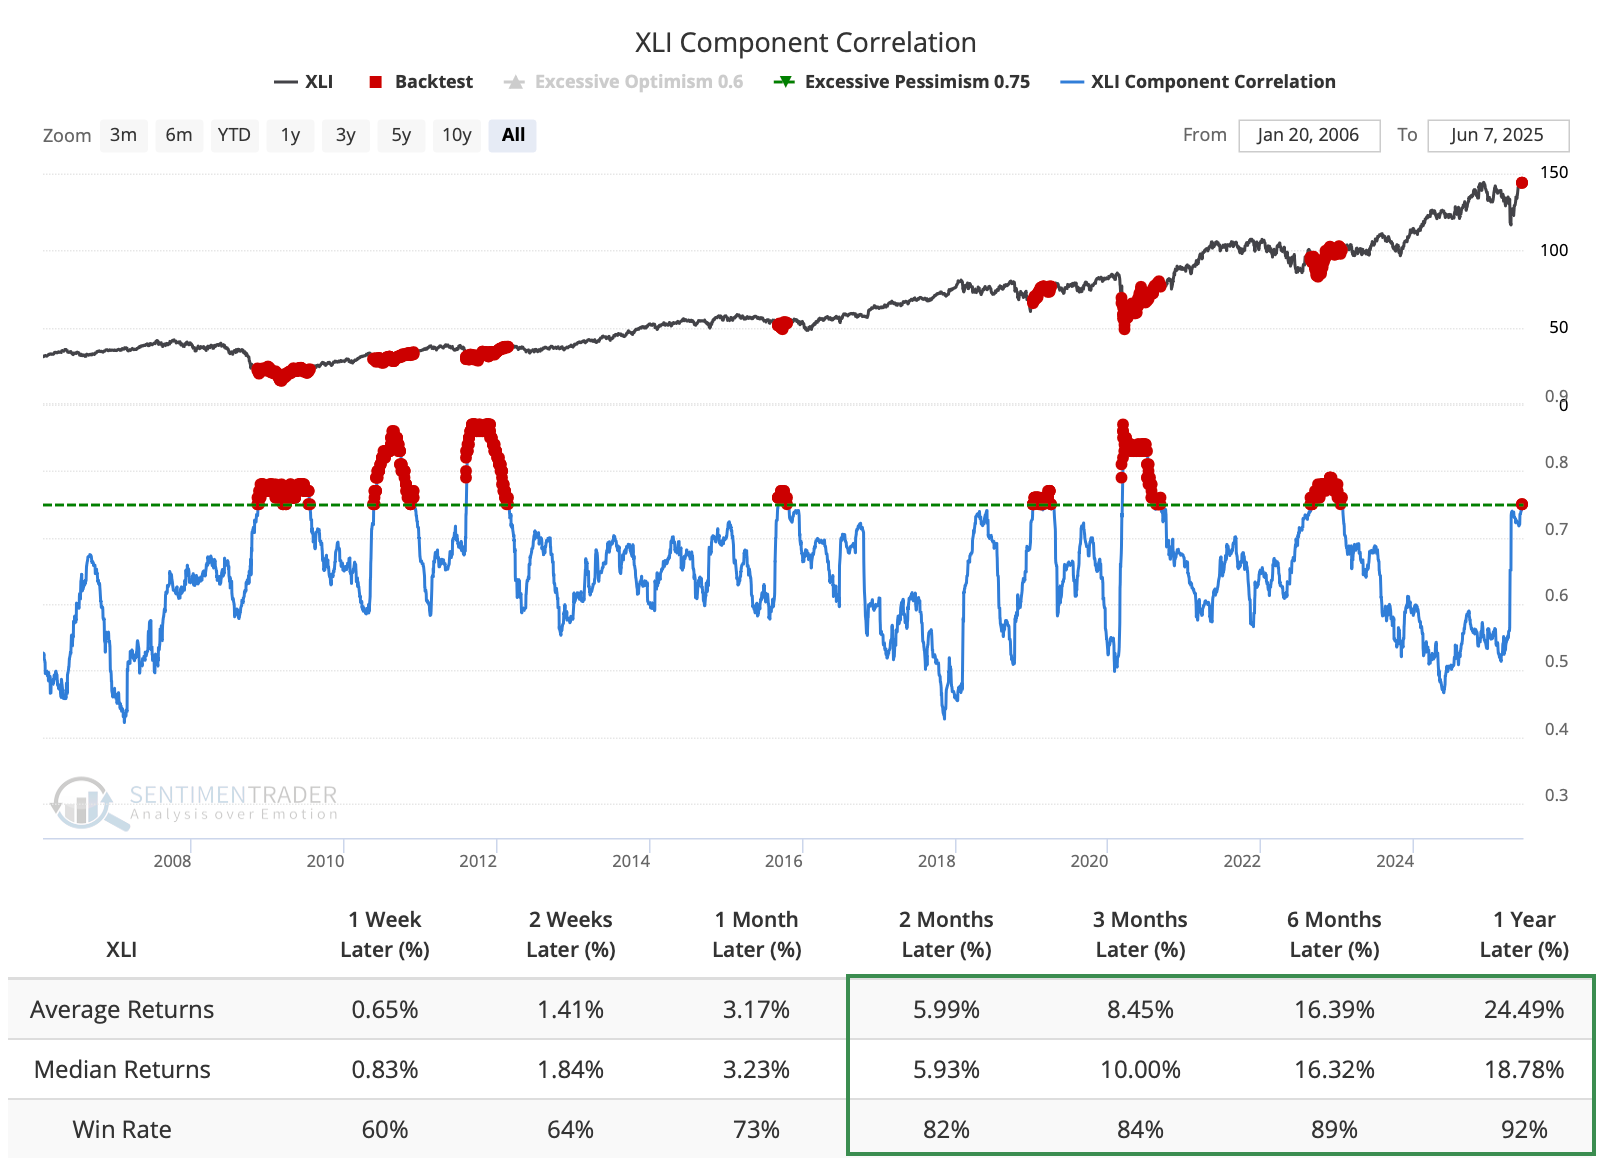
Another indication of retail (though not just retail) concern is the high level of correlation among stocks in the sector. We tend to see the stocks moving together when investors are anxious, as they buy and sell virtually all of them en masse without regard to individual merits. When the correlation among stocks has been as high as it is now, XLI has done well going forward.
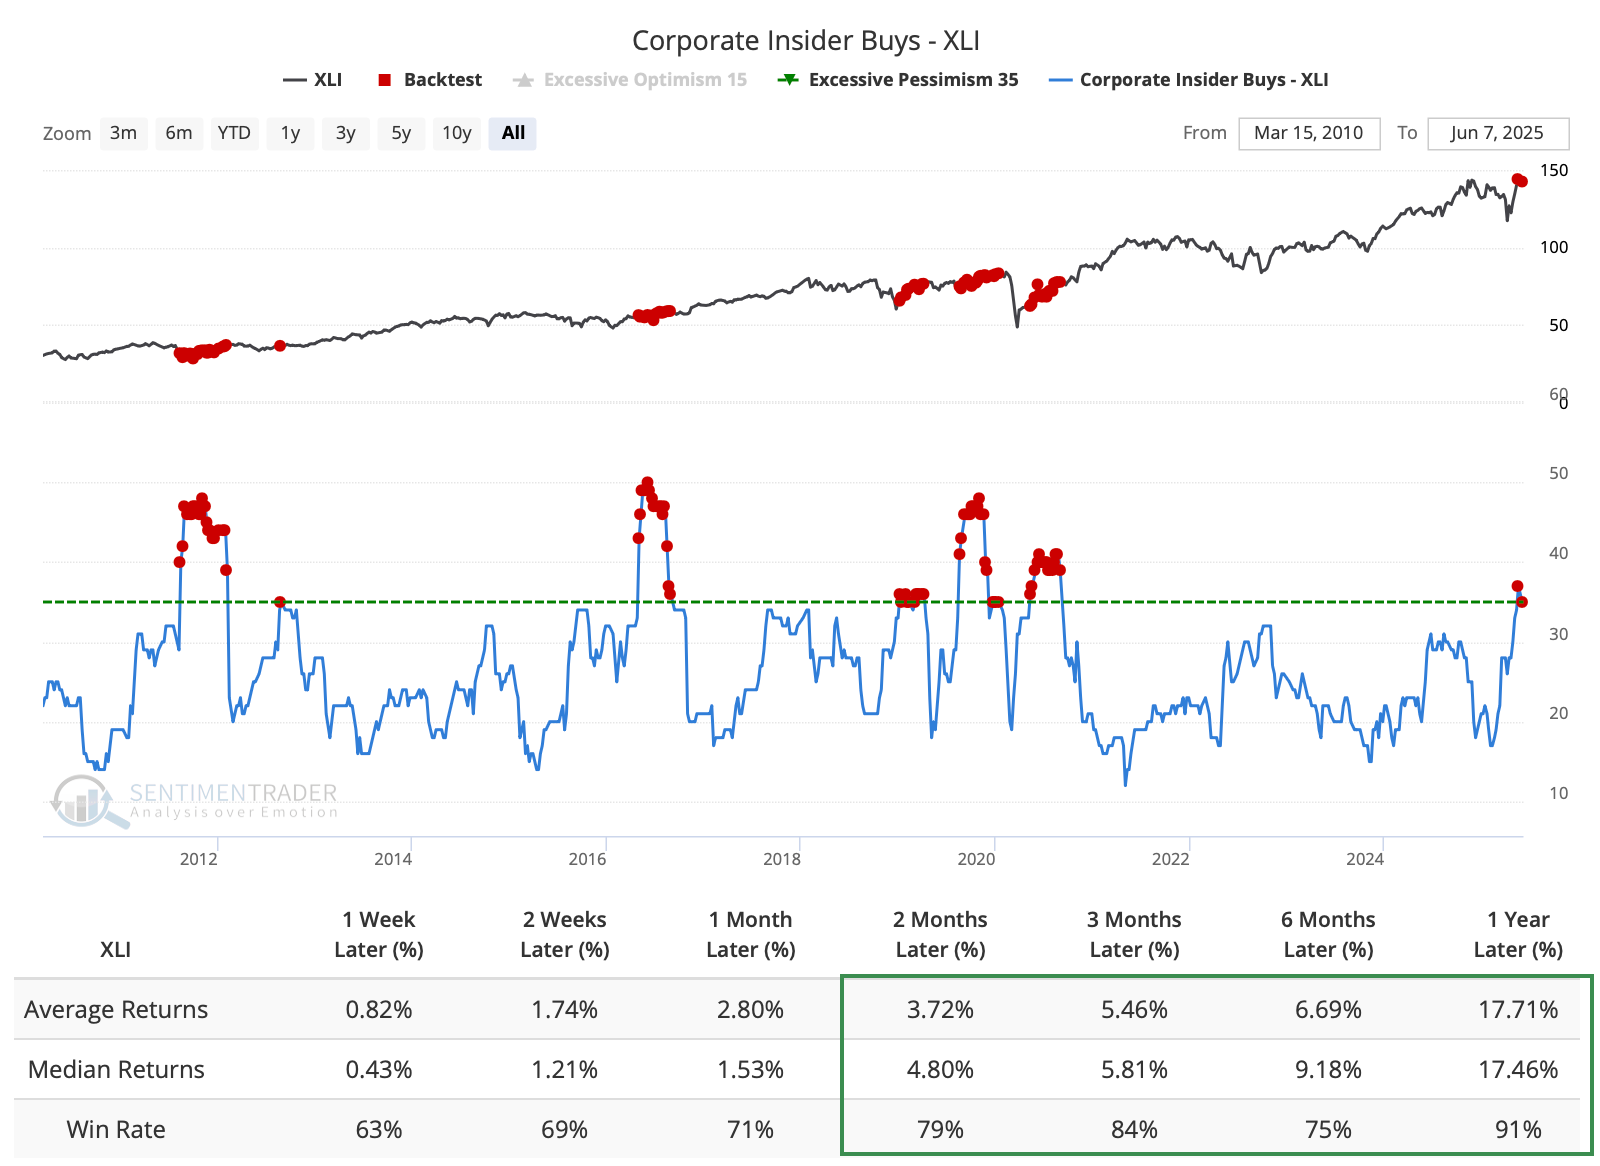
As those investors exited the stocks and funds, corporate insiders among industrial companies have been scooping up shares.
What the research tells us...
Industrial stocks have been holding up well, for the most part. They've been able to withstand some retail selling pressure, buoyed by interest among insiders at the companies. The average stock is mostly fine, and the larger ones have been doing well enough to push the overall sector index to a record high.
When this sector has led all others to a new high, it has been a good sign, though not infallible. Soon after a similar breakout by the sector in 1990, the U.S. economy fell into a modest recession. And when it happened in March 2000, it coincided with a blow-off peak in the stock market. Other than those instances, the stock market mostly avoided significant or lasting harm, at least for several months and typically much longer.