
An increasing number of stocks are showing bullish trend score conditions

Key points:
- Cyclical sector stocks have outperformed since May 19th, when indexes began to consolidate
- This positive momentum has led to an increase in stocks generating trend score buy signals
- One exception is housing-related companies, where stocks have dropped to multi-month lows
Opportunities continue to expand across cyclical sector stocks
The S&P 500 and other major stock indexes, such as the Russell 1000, peaked on May 19, 2025, and have since entered a consolidation phase that has lasted nearly two weeks. This period of sideways movement suggests a market environment marked by increased dispersion, where some stocks continue to advance while others begin to decline. Such conditions can be ideal for traders using relative strength indicators, as they help identify leadership names that are gaining momentum despite the broader index's stagnation. By focusing on stocks exhibiting strong relative performance, traders can align with emerging strength while avoiding exposure to those trending lower during this consolidation.
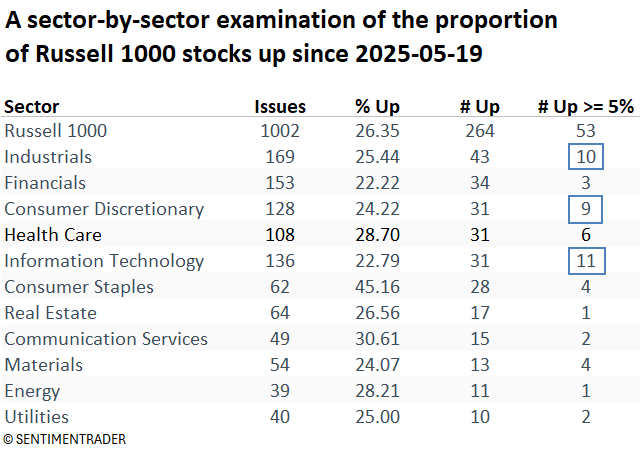
As shown in the table below, 264 stocks, representing 26% of the Russell 1000, which tracks the 1,000 largest U.S. companies by market cap, have advanced since May 19 despite a stagnant broad market. Cyclical sectors are leading, with the majority of 5 %+ gainers concentrated in offensive areas, particularly technology, which accounts for 11 such stocks.
On Monday, the following Russell 1000 stocks in the consumer discretionary, financials, industrials, and technology sectors registered 2-month absolute and relative highs, indicating that these stocks are displaying leadership status.
Although I've highlighted several names on the list in previous reports, let's examine some of the new emerging trends.
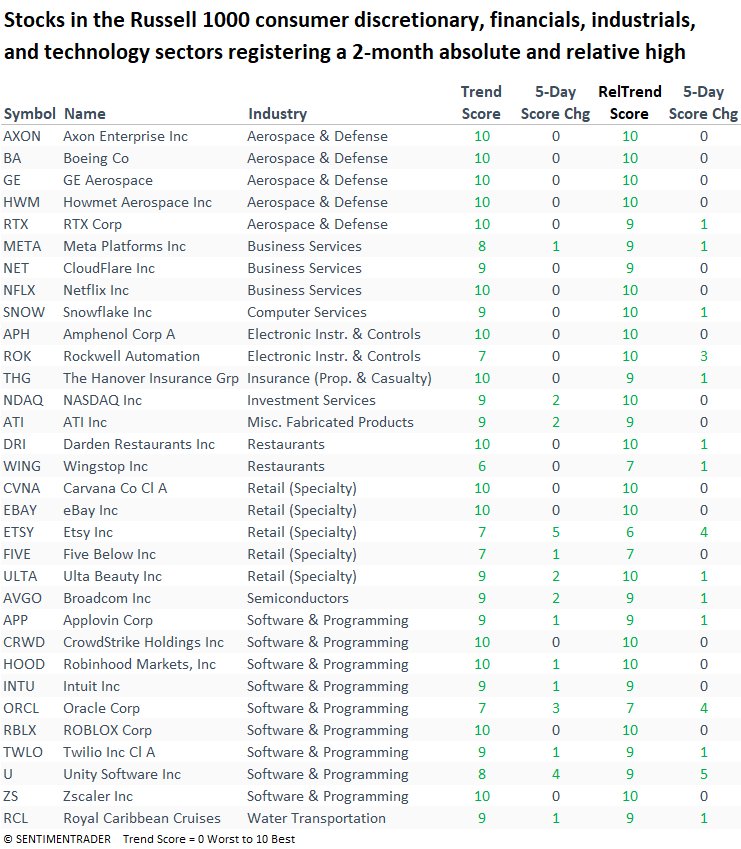
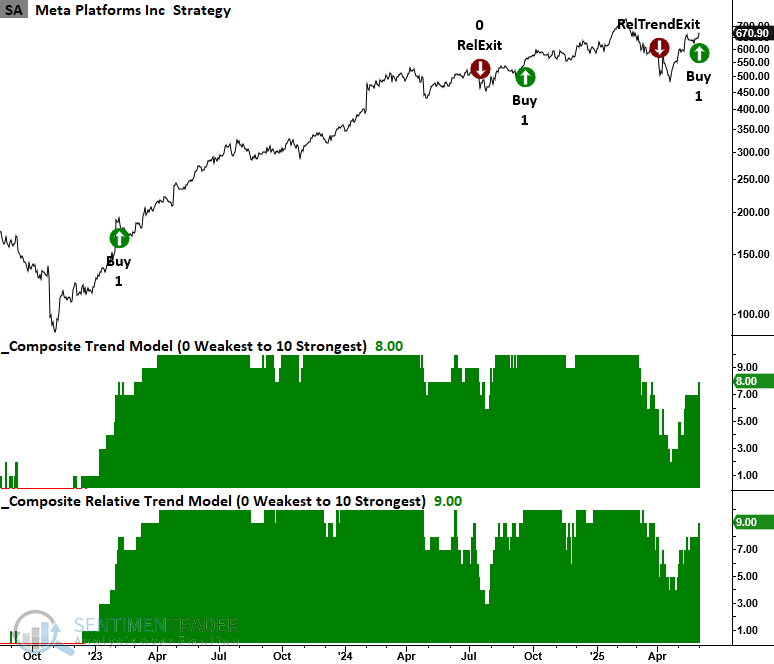
Meta triggered a trend score buy signal on Monday when its trend and relative trend composites simultaneously reached a score of eight or higher, and it closed at a 2-month absolute and relative high.
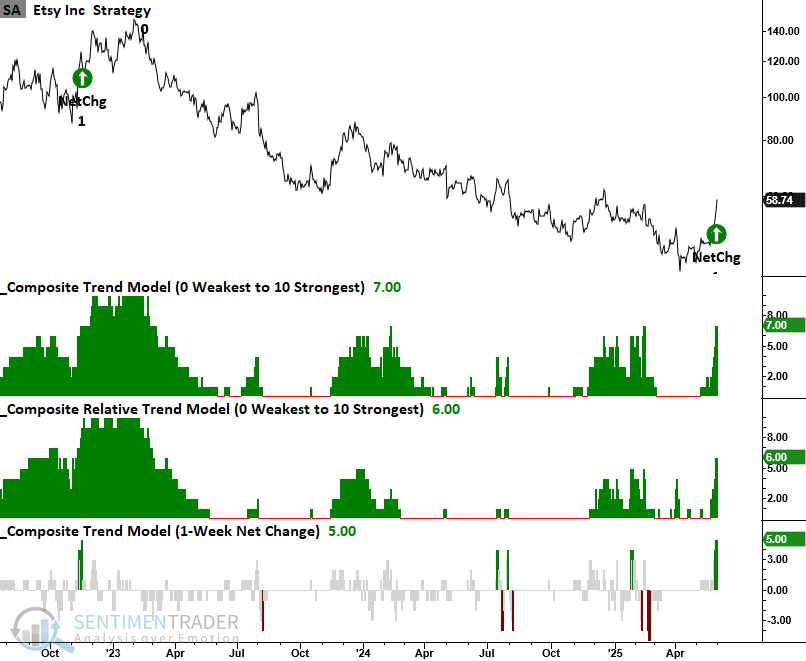
Etsy, a specialty retailer, triggered a trend score net change signal when its composite jumped by five points over five sessions. As a reminder, the net change signal is intended to identify a bearish-to-bullish reversal in advance of a trend score buy signal. i.e., it's a trade that could develop into a portfolio holding should the trend score conditions align as described with Meta.
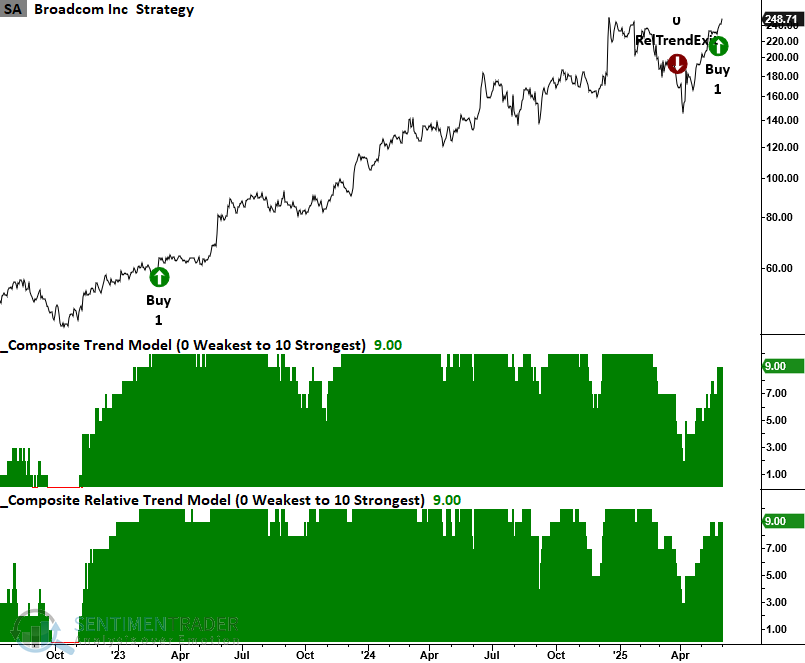
If you recall, in my report "Nasdaq signal with near-perfect record just triggered", I highlighted a trend score net change signal for the S&P 1500 semiconductor industry. Broadcom (AVGO) recently triggered a trend score buy signal and looks poised to reach a new all-time high today.
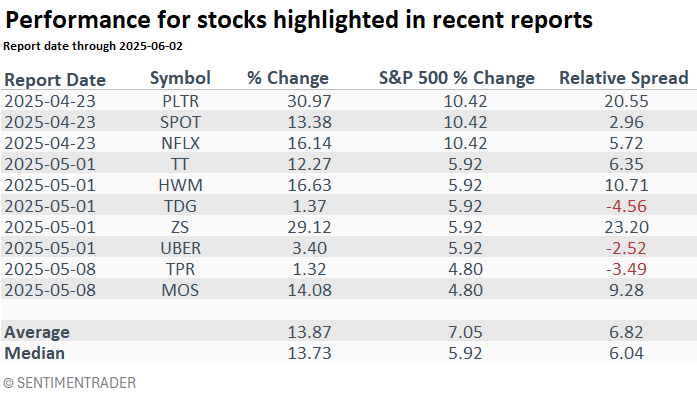
How have other highlighted stocks performed
While I've highlighted numerous stocks, especially in my report "Technology dominates the relative highs breakout list", the following table focuses on those featured in a chart with our trend score indicators.
All show gains, as expected in a broadly rising market. Notably, 70% outpaced the S&P 500 by a median of 6%.
Wondering why my focus is primarily concentrated in cyclical sectors? Click here to see why.
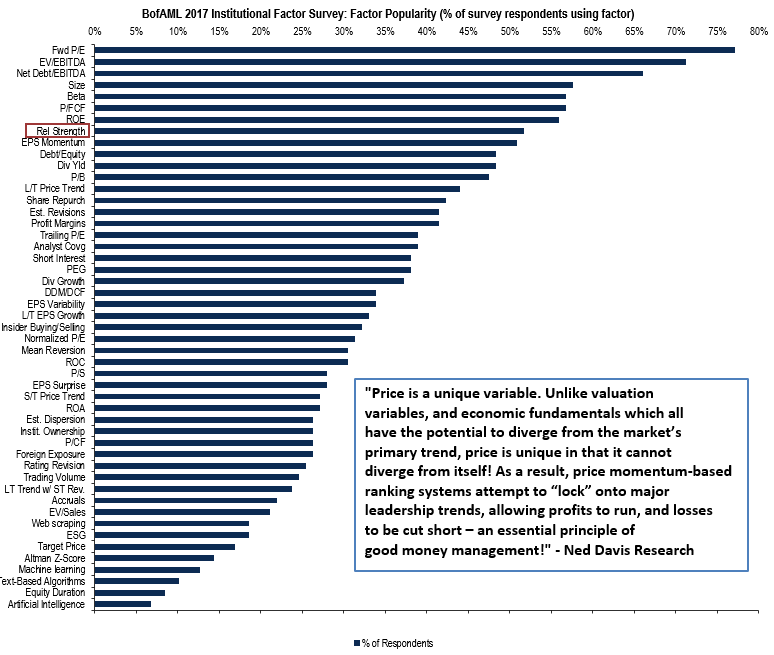
A factor worth one's time and money
This chart from Bank of America's 2017 factor survey, once a staple in my presentations, ranks relative strength as the 8th most used factor among institutional investors. If it's not already part of your process, it's worth serious consideration.
It's interesting to see that AI was a factor in 2017, though it ranked dead last. I'm curious where it stands now. If anyone has access to the latest survey, I'd appreciate it if you could share.
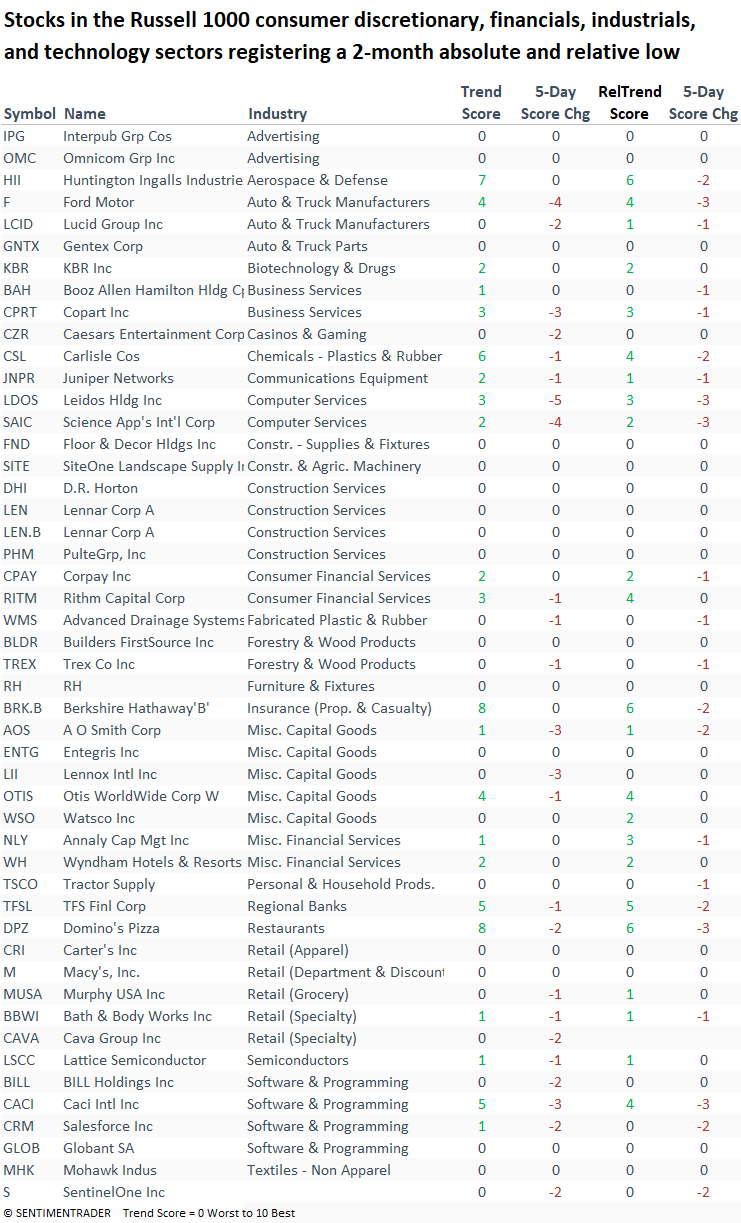
An area one should continue to avoid
The following table highlights cyclical sector stocks that recorded a 2-month absolute and relative low on Monday. Housing-related names dominated the list, covering builders, flooring suppliers, lumber, HVAC suppliers, and more.
With the 30-year mortgage rate hovering around 7% and elevated housing supply, this interest rate-sensitive area should be avoided.
What the research tells us...
An increasing number of stocks within cyclical sectors, particularly technology, are showing favorable trends, with several triggering new buy signals. This relative strength reflects growing investor confidence in innovation-driven areas of the market. In contrast, interest rate-sensitive stocks, especially those linked to the housing sector, continue to struggle. Many have recently hit multi-month lows, indicating that higher borrowing costs are contributing to a sluggish environment. In uptrends, it's critical to align with leadership to outperform the broad market.