Products
SentimenTrader Trading Tools
‍
Backtest Engine
My Trading Toolkit
Correlation Analysis
Seasonality
Market Prediction
Indicators & Data API
‍
Proprietary Indicators & Charts
Market Data API
Strategies & Scanner
‍
50+ Trading Strategies
Smart Stock Scanner
Smart Option Scanner
Research Reports
‍
Research Solutions
Reports Library
Free Resources
Simple Backtest Calculator
Simple Seasonality Calculator
The Kelly Criterion Calculator
Sentiment Geo Map
Public Research Reports
Education
Sentiment Indicators
Technical Indicators
Pricing
Company
About
In the News
Testimonials
Client Success Stories
Contact
Log inLoginSign up
< BACK TO ALL REPORTS

An increase in buying pressure in the last hour of trading

Dean Christians
2023-04-10
The last-hour indicator, a measure of buying or selling pressure, increased for seven consecutive sessions. After similar periods of late-day buying, the S&P 500 was higher 82% of the time over the next month.

Key points:

  • The last-hour indicator increased for seven consecutive sessions
  • After similar periods of late-day buying pressure, the S&P 500 showed a consistent upward bias

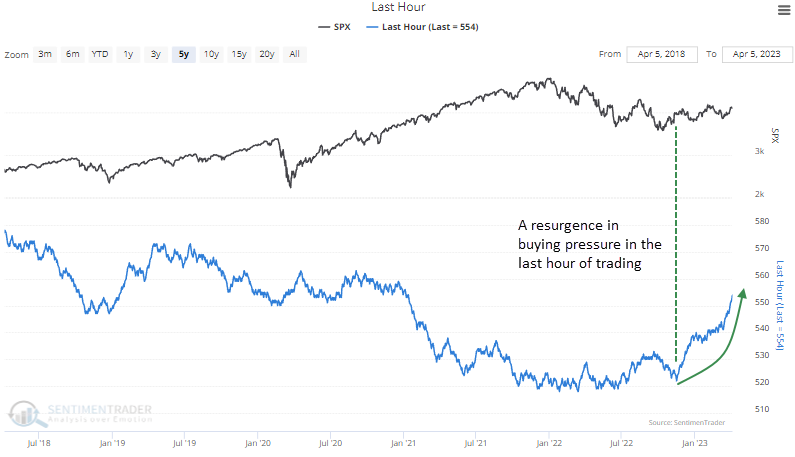
Buying pressure is outpacing selling pressure in the last hour of trading 

A resurgence amongst traders and investors to cover shorts or accumulate stocks late in the day sent the last-hour indicator meaningfully higher over the last five months.

The indicator, a cumulative advance-decline line for the last hour of trading, measures whether buyers or sellers dominate the most critical time frame of the day.

The buying pressure accelerated last week when the last hour of trading recorded seven consecutive higher closes.

Consistent buying pressure in the last hour of trading is typically a characteristic of bull markets as investors seek to avoid the overnight upward drift in stocks.

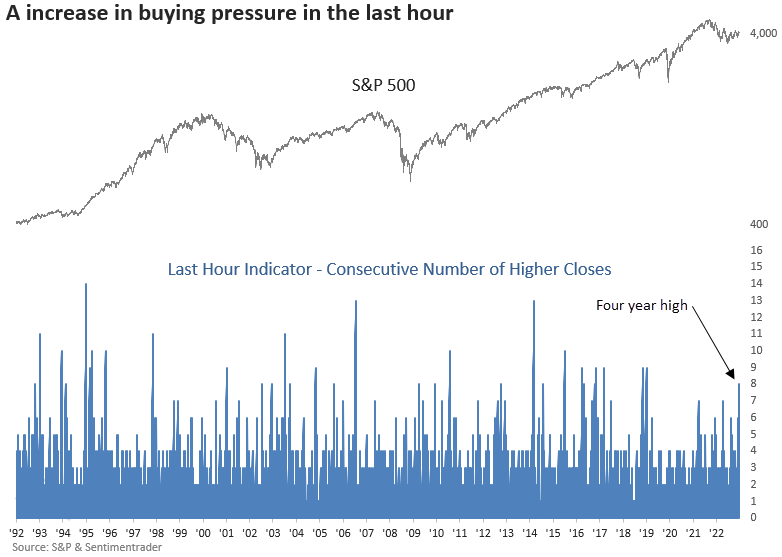
To read more about this indicator and a strategy derived from it, see the research report titled A Sell Signal in the Cumulative Advance-Decline Line for the Last Hour of Trading.

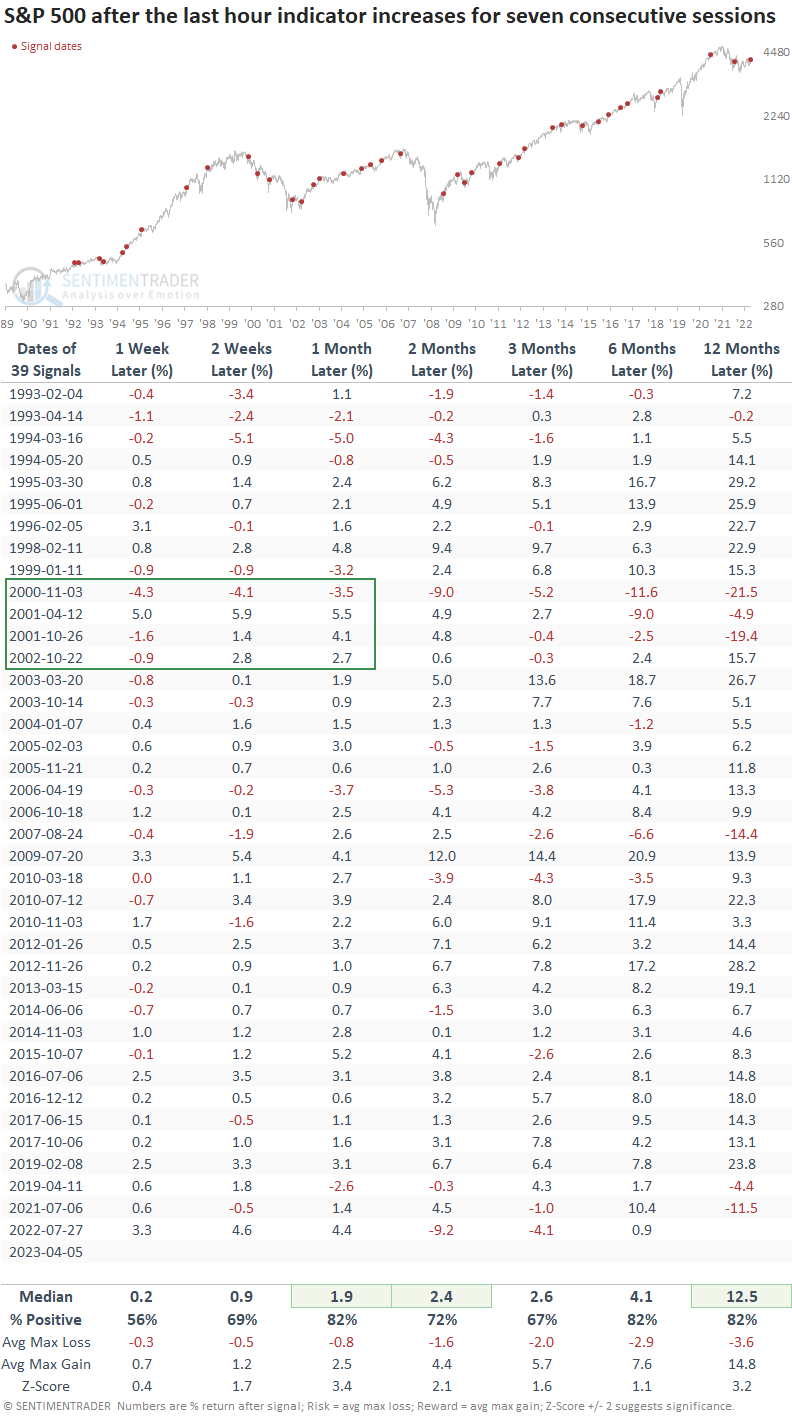
Similar periods of late-day buying pressure preceded positive returns

When the last-hour indicator increases for seven consecutive sessions, the S&P 500 rallied consistently across all time frames with solid win rates and z-scores. A month later, the index was higher 82% of the time and recorded 17 consecutive profitable signals between 2006 and 2019. 

In the 2000-02 bear market, the signal showed a gain in 3 out of 4 cases over the next month. And in 2007-08, it avoided an alert as consistent buying pressure never materialized. 

What the research tells us...

Over the previous five months, the last-hour indicator has steadily risen as buying pressure outpaced selling pressure in the last hour of trading. Last week, the buying accelerated, with seven consecutive increases for the S&P 500 in the final hour. After similar win streaks, the large-cap index exhibited solid returns, win rates, and z-scores, especially a month later.

PRODUCTS
SentimenTrader
Trading Tools
Indicators & Data API
‍
Strategies & Scanner
‍
Research Reports
FREE
RESOUrCES
Simple Backtest
Calculator
Simple Seasonality
Calculator
The Kelly Criterion
Calculator
Sentiment Geo Map
‍
Public Research Reports
‍
Education
Sentiment Indicators
‍
Technical Indicators
‍
Pricing
Bundle pricing
‍
FAQ
‍
Announcements
‍
COMPANY
‍
About
‍
In the News
‍
Testimonials
‍
Client Success Stories
CONTACT
‍
General Inquiries
‍
Media Inquiries
‍
Financial Professionals Inquiries
‍
© 2026 Sundial Capital Research Inc. All rights reserved.
Setsail Marketing
TermsPrivacyAffiliate Program
Risk Disclosure: The information and tools provided are for research and analytical purposes only and are not intended as investment advice. Market analysis involves uncertainty, and outcomes may differ from expectations. Users should conduct their own due diligence and consider their individual circumstances before making any financial decisions. Past performance is not necessarily indicative of future results.

Hypothetical Performance Disclosure: Hypothetical performance results have many inherent limitations, some of which are described below. No representation is being made that any account will or is likely to achieve profits or losses similar to those shown; in fact, there are frequently sharp differences between hypothetical performance results and the actual results subsequently achieved by any particular trading program. One of the limitations of hypothetical performance results is that they are generally prepared with the benefit of hindsight. In addition, hypothetical trading does not involve financial risk, and no hypothetical trading record can completely account for the impact of financial risk of actual trading. for example, the ability to withstand losses or to adhere to a particular trading program in spite of trading losses are material points which can also adversely affect actual trading results. There are numerous other factors related to the markets in general or to the implementation of any specific trading program which cannot be fully accounted for in the preparation of hypothetical performance results and all which can adversely affect trading results.

Testimonial Disclosure: Testimonials appearing on this website may not be representative of other clients or customers and is not a guarantee of future performance or success.