
An In-Depth Look at the Sentimentrader's New TCTM Thrust Model - Part II

Key points
- We focus on metrics that identify extreme buying pressure through volume surges, new highs, and overbought breadth conditions.
- These components such as the 21-Day High Spike and various Volume Ratio Thrusts capture the "accumulation" phase of a market launch.
- The composite model continues to show that when these diverse signals cluster together (Signal Count >= 30%), the probability of a sustained bull market rises significantly.
The Composite Thrust Model Components
Identifying the primary market trend is one of the most critical tasks for any trader or investor. The Tactical Composite Trend Model (TCTM) is the culmination of decades of professional trading and financial market research, designed to aid in this process. The TCTM utilizes a weight-of-the-evidence approach, combining seven key time-tested components to identify major market turning points. This report will focus on one of those key components: the Sentimentrader's New TCTM (S-TCTM) Composite Thrust Model.
The following analysis utilizes a Composite Thrust Model that includes ten measures for identifying extreme momentum through internal and external participation.
Component Descriptions
- Rate of Change Thrust
- Breadth Thrust S&P 500
- Breadth Thrust NYSE
- Percentage of issues above the 10-day bearish to bullish reversal
- Percentage of issues above the 50-day moving average surge
- Percentage of issues at a 21-Day high surge
- Percentage of issues overbought surge
- 2/3 Vol Ratio Thrust
- 2 Day Vol Ratio Thrust
- Volume Thrust
Composite Thrust Model Signal Criteria
- Condition = Composite Signal Count >= 30%.
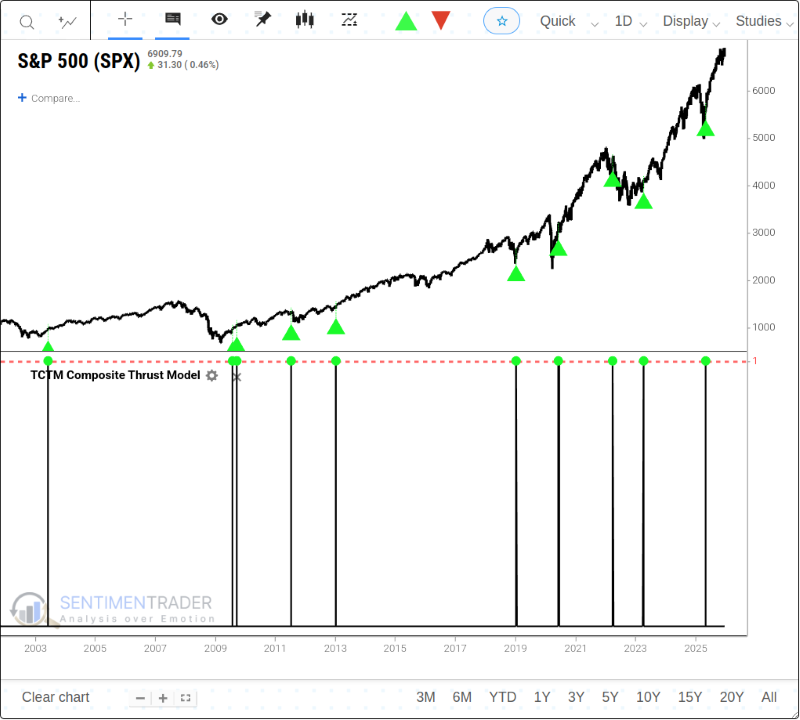
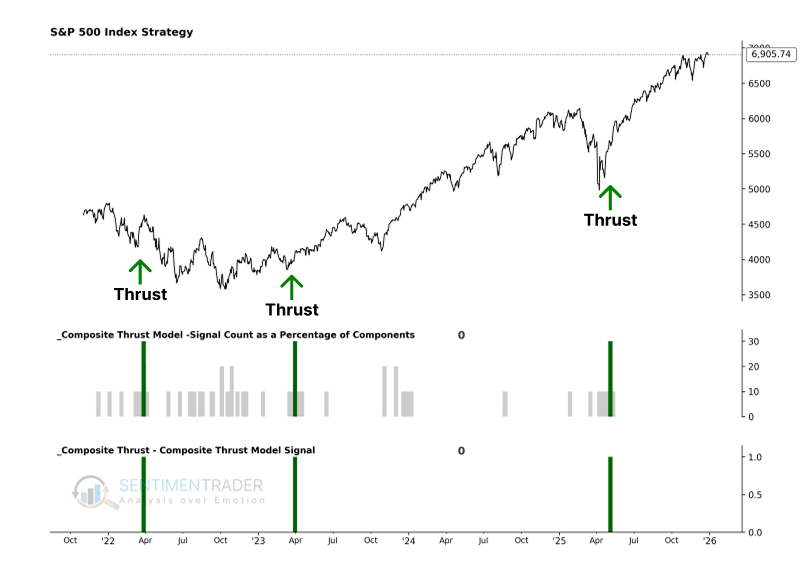
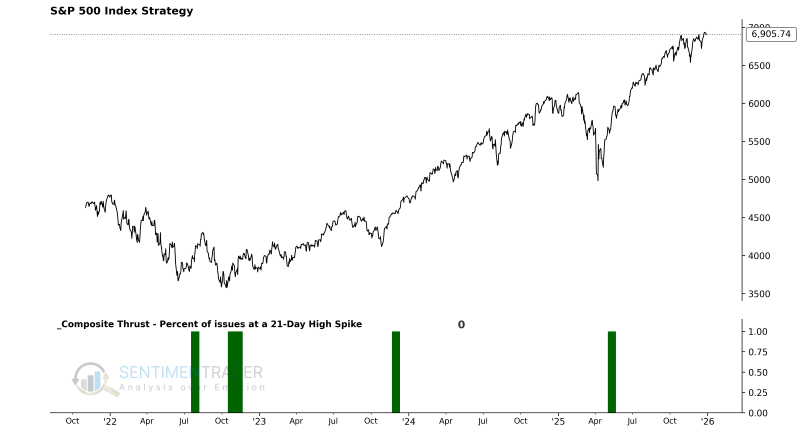
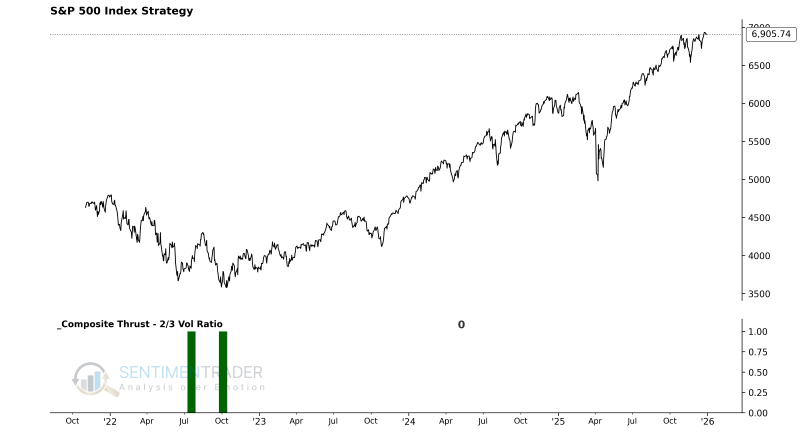
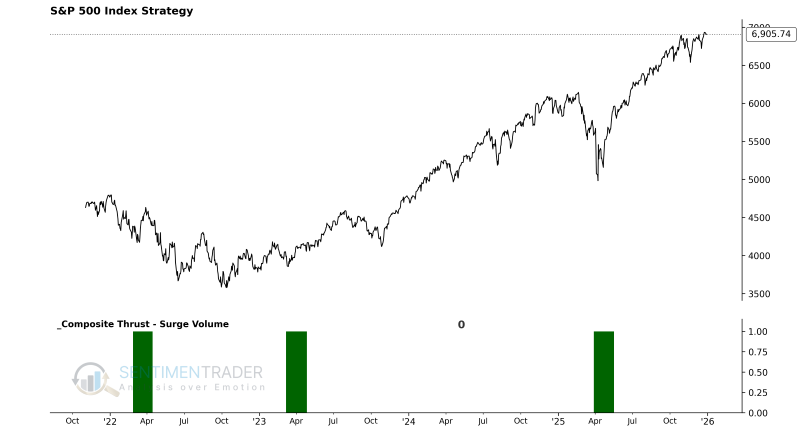
As the chart below illustrates, these individual components are combined into a single composite indicator-the Composite Thrust Model-which uses a 0 or 1 value to issue alerts. Currently, the model shows a reading of 0, indicating no thrust signal is active.
Utilizing the S-TCTM Composite Thrust Model
The model's output allows us to define the market environment as "Favorable" or "Unfavorable" without subjective interpretation. Specifically:
- When the Composite Thrust Model flips from 0 to 1, the primary trend is considered Favorable for stocks.
With this framework, we can construct a systematic trend-following strategy to see how this approach has performed historically.
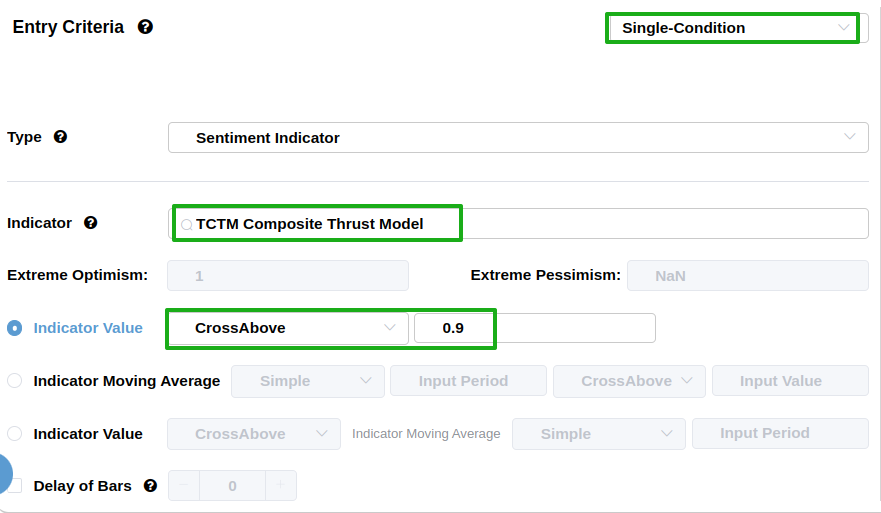
Using the Backtest Edge engine, we can set up the entry and exit criteria to follow the model's signals. The setup is straightforward:
The Entry Criteria are set for when the S-TCTM Composite Thrust Model equals 1, initiating a long position when the trend becomes favorable.
We can skip setting an explicit exit for this test, as we are primarily interested in the forward returns after the signal triggers.
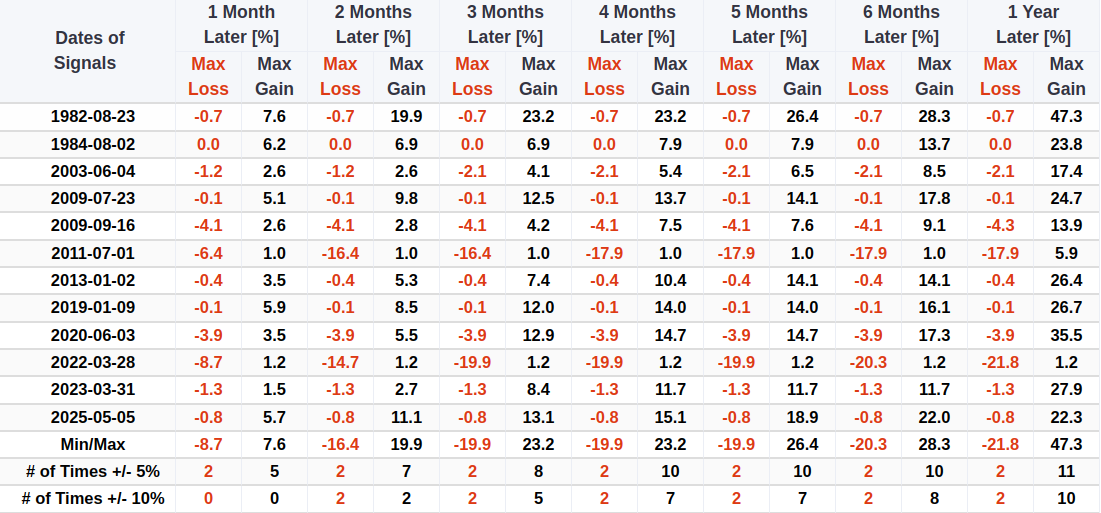
As shown in the table below, market performance is typically robust following the triggering of this signal. For related backtest, click here.
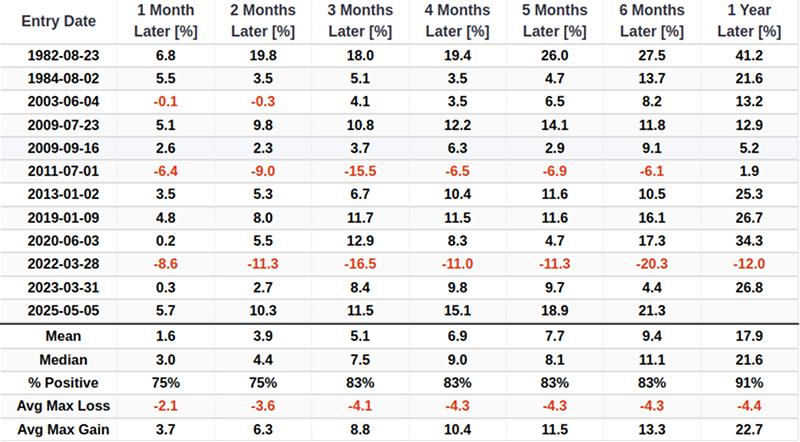
Historically, whenever this signal has triggered, the market has performed exceptionally well one year later, with 10 out of 12 instances showing a maximum gain exceeding 10%.
Component Deep Dive (Part II)
Percentage of issues at a 21-Day high surge
This model measures the percentage of stocks reaching a 21-day high. When it exceeds 54%, it has historically signaled a favorable environment for equities.
Components
21-Day High Spike Model
This model aims to identify the moment of rapid transition from deep dormancy to extreme activity. It focuses on "Sentiment Pulse" logic: the market breadth indicator first experiences a period of extremely low activity (few new highs), followed by a sudden explosion where the proportion of stocks hitting new highs leaps significantly.
Signal Criteria
- Condition 1 = The percentage of S&P 500 stocks hitting a 21-day high previously fell below 10%.
- Condition 2 = After meeting Condition 1, the percentage of stocks hitting a 21-day high surges to break above 54%.
- If Conditions 1-2 are met, a 21-Day High Spike Model signal is issued.
Current Day Chart
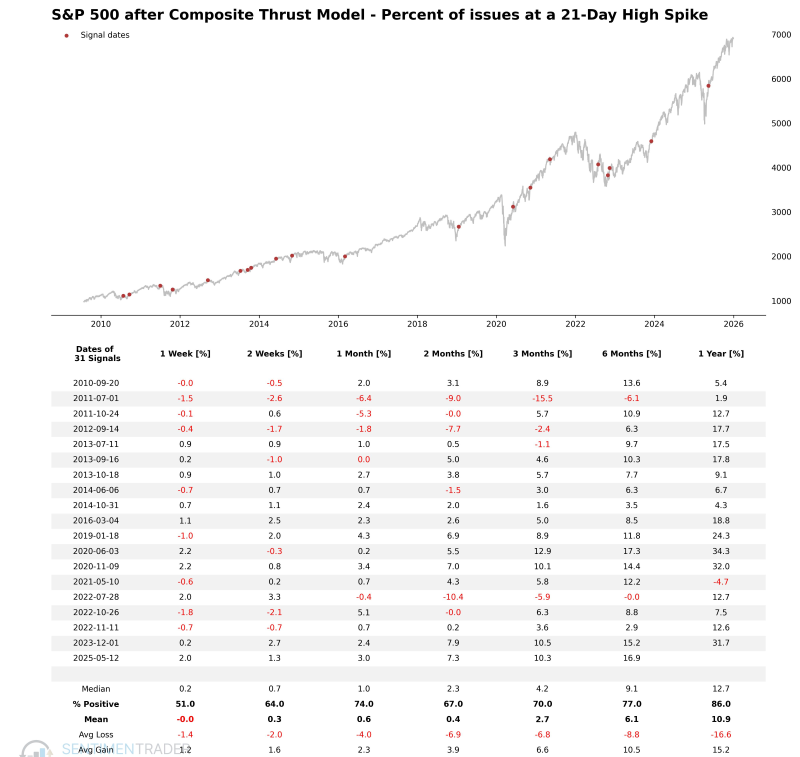
Signal Performance
As seen in the chart, the win rate increases as the time horizon extends.
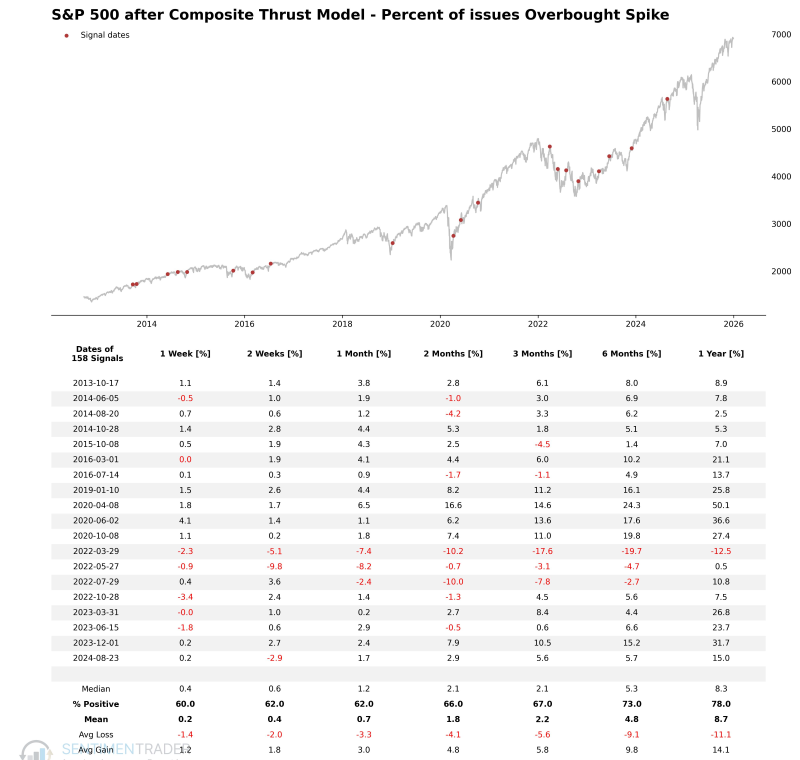
Percentage of issues overbought surge
The model uses the stochastic oscillator, a technical indicator that measures momentum by comparing the current closing price to the high and low price over a lookback period. The standard setting is 14 days, and the oscillator ranges from 0% lowest to 100% highest.
The algorithm identifies when the percentage of S&P 500 issues with a 14-day stochastic oscillator above 80% reaches 71%. We screened out repeats by pinpointing the first occurrence in 42 days and with a reset that requires the value to fall below 20%.
Components
- Percentage of S&P 500 stocks with a 14-day Stochastic Oscillator > 80 (SO14Above80)
Overbought Spike Model
This model aims to identify moments when the market enters an extremely overheated state that possesses strong upward inertia. It focuses on "Overbought Confirmation" logic: when a large majority of S&P 500 stocks enter the overbought zone (Stochastic > 80) simultaneously, it reflects an extreme short-term bullish consensus and a massive influx of capital.
Signal Criteria
- Condition 1 = The percentage of S&P 500 stocks with a 14-day Stochastic above 80 rises to exceed 71%.
- Condition 2 = The indicator must have previously completed a reset process (falling below 20%) to ensure the signal captures the start of a new overheating pulse.
- If Conditions 1-2 are met, an Overbought Spike Model signal is issued.
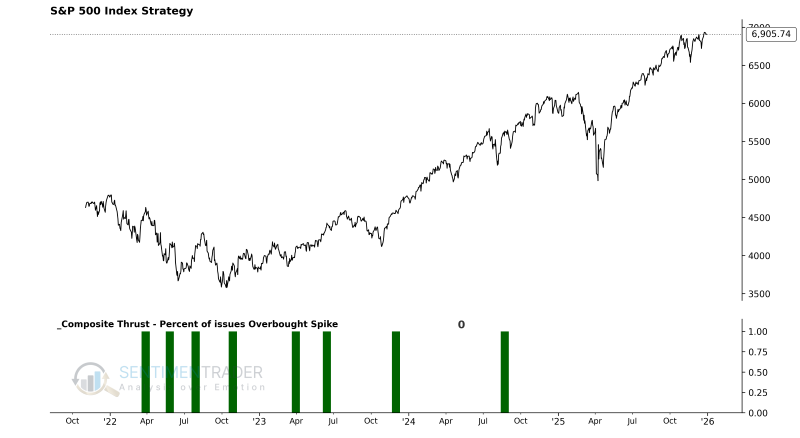
Current Day Chart
Signal Performance
The signal possesses a decent win rate across the 3 to 12-month timeframes.
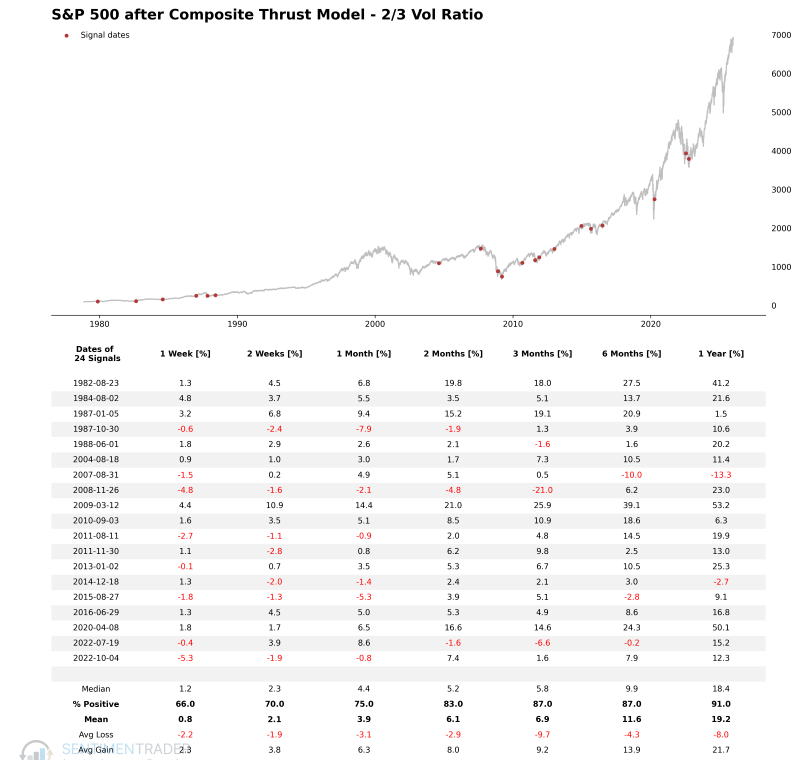
2/3 Vol Ratio Thrust
The algorithm identifies when the NYSE Up Volume Ratio exceeds 88% in 2 out of the last 3 sessions.
Components
2/3 Vol Ratio Model
This model aims to identify moments of sustained, extreme buying pressure. It focuses on "Volume Accumulation" logic: by monitoring whether the Up Volume Ratio breaks extreme thresholds multiple times within a short window (3 trading sessions), it confirms the breadth and continuity of capital inflows. Compared to a single day of high volume, this high-frequency occurrence of extreme volume ratios typically signals the official launch of a major uptrend.
Signal Criteria
- Condition = In a rolling 3-day window, the NYSE Up Volume Ratio reaches or exceeds 88% on at least 2 days.
- If the condition is met, a 2/3 Vol Ratio Thrust signal is issued.
Current Day Chart
Signal Performance
The signal possesses a decent win rate across the 1 to 12-month timeframes.
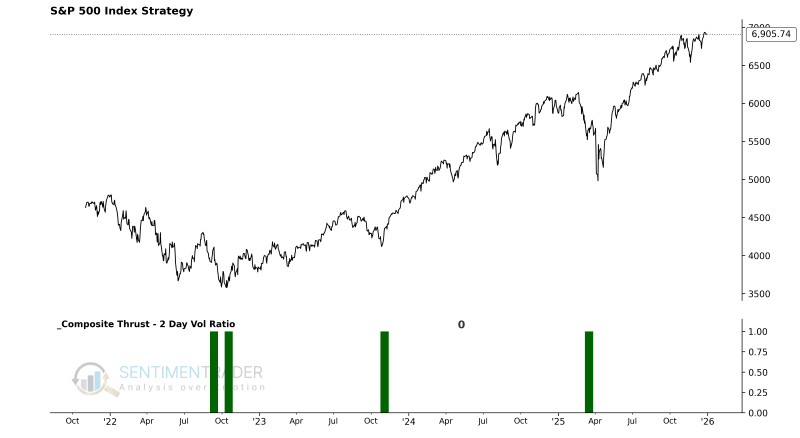
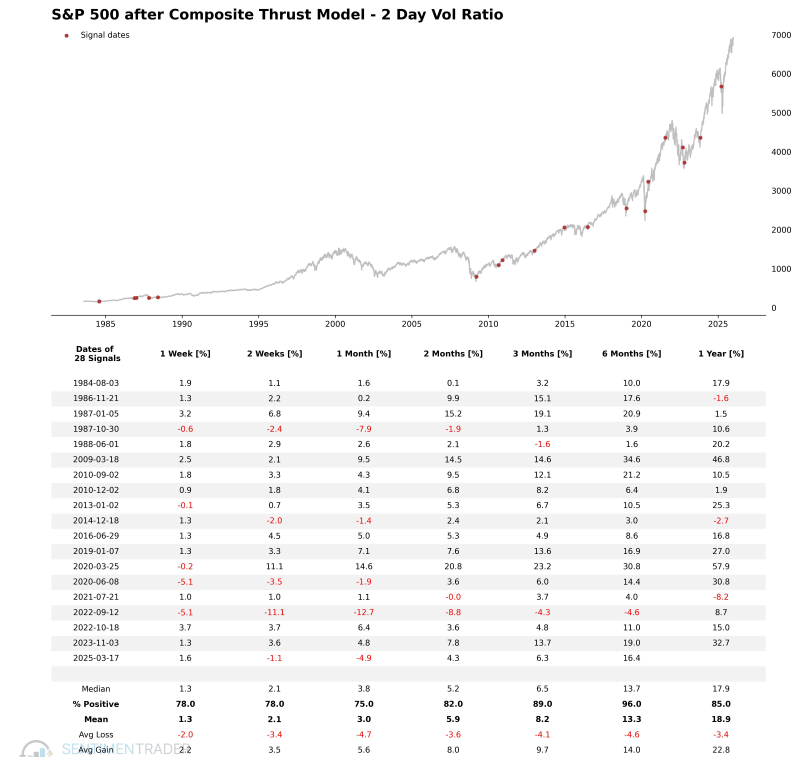
2 Day Vol Ratio Thrust
Components
2 Day Vol Ratio Model
This model aims to capture consecutive days of extreme bullish momentum. It focuses on "Persistent Volume Explosion" logic: by identifying instances where Up Volume Ratio crosses high thresholds on two consecutive days, it confirms the continuous intervention of institutional funds.
Signal Criteria
- Condition 1 = On the previous trading day, the NYSE Up Volume Ratio reached or exceeded 90%.
- Condition 2 = On the current trading day, the NYSE Up Volume Ratio remained at 80% or higher.
- If Conditions 1-2 are met, a 2 Day Vol Ratio Thrust signal is issued.
Current Day Performance
Signal Performance
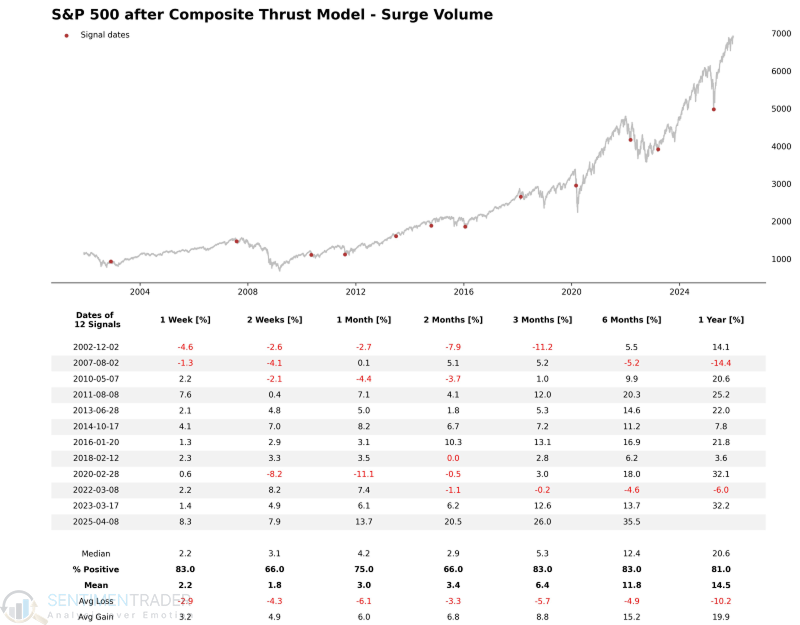
Volume Thrust
Components
- NYSE Daily Volume
Surge Volume Model
This model aims to identify moments of structural volume expansion in the broader market, capturing capital influxes caused by large-scale institutional rebalancing or major fundamental shifts. It focuses on "Relative Volume Expansion" logic: by comparing short-term (10-day) average volume to long-term (252-day) average volume, it identifies abnormal eruptions in trading activity relative to the annual baseline.
Signal Criteria
- Condition = The ratio of the NYSE 10-day average volume to the 252-day average volume (VolRatio) exceeds 1.33.
- If the Condition is met, a Surge Volume Model signal is issued.
Current Day Chart
Signal Performance
As seen, there is positive performance across all timeframes.
What the research tells us...
In Part II of our analysis on the S-TCTM Composite Thrust Model, we examined components that specifically track the intensity of buying pressure through volume and overbought conditions. These signals-such as the 2/3 Vol Ratio Thrust and the Overbought Spike-are critical because they differentiate between a tentative bounce and a high-conviction rally fueled by institutional capital.
When markets display this level of synchronized buying power (surging volume, persistent new highs, and broad overbought conditions), it is rarely a bearish sign. Instead, history suggests that these "thrusts" act as rocket fuel, propelling the market into a sustainable uptrend. The combined weight of evidence from all 10 components in the Composite Thrust Model provides a robust framework for identifying favorable long-term entry points.