
An In-Depth Look at the Sentimentrader's New TCTM Thrust Model - Part I

An In-Depth Look at the Sentimentrader's New TCTM Thrust Model - Part I
Key points
- The S-TCTM Composite Thrust Model aggregates 10 different momentum and breadth indicators to identify powerful market surges, or "thrusts."
- A signal is triggered when at least 30% of the components are active, indicating a shift to a favorable market environment.
- Historically, these thrust signals have been highly reliable precursors to sustained market advances, with strong win rates over 12-month horizons.
The Composite Thrust Model Components
Identifying the primary market trend is one of the most critical tasks for any trader or investor. The Tactical Composite Trend Model (TCTM) is the culmination of decades of professional trading and financial market research, designed to aid in this process. The TCTM utilizes a weight-of-the-evidence approach, combining seven key time-tested components to identify major market turning points. This report will focus on one of those key components: Sentimentrader's New TCTM (S-TCTM) Composite Thrust Model.
The following analysis utilizes a Composite Thrust Model that includes ten measures for identifying extreme momentum through internal and external participation.
Component Descriptions
- Rate of Change Thrust
- Breadth Thrust S&P 500
- Breadth Thrust NYSE
- Percentage of issues above the 10-day bearish to bullish reversal
- Percentage of issues above the 50-day moving average surge
- Percentage of issues at a 21-Day high surge
- Percentage of issues overbought surge
- 2/3 Vol Ratio Thrust
- 2 Day Vol Ratio Thrust
- Volume Thrust
Composite Thrust Model Signal Criteria
- Condition = Composite Signal Count >= 30%.
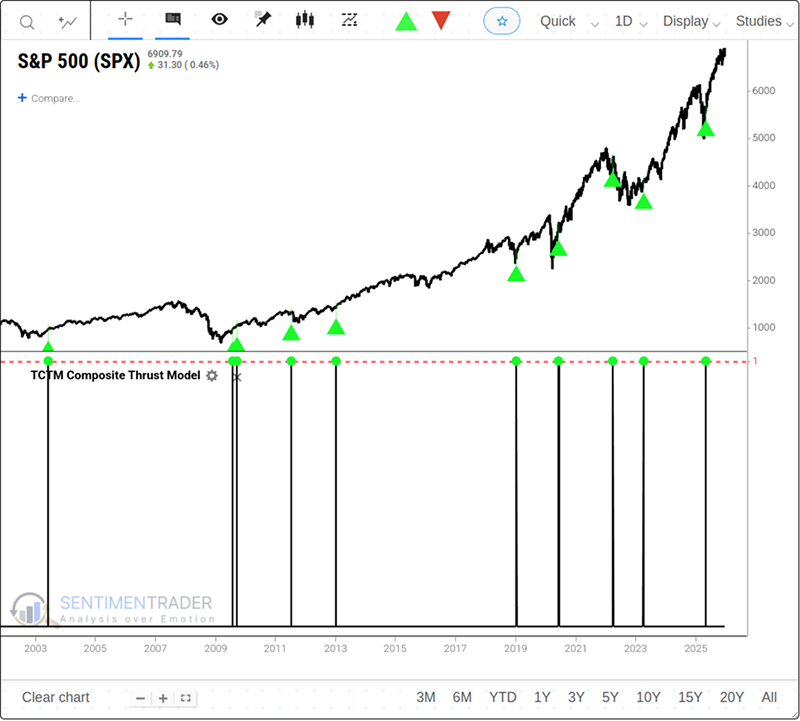
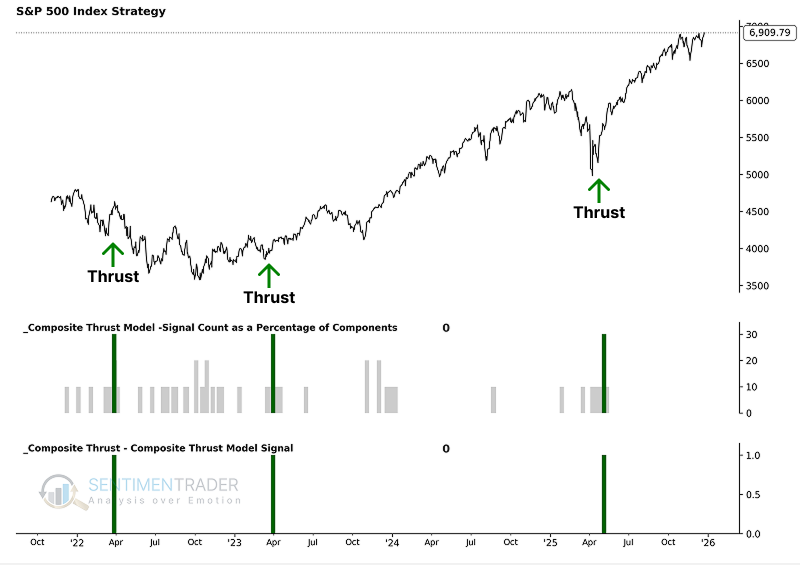
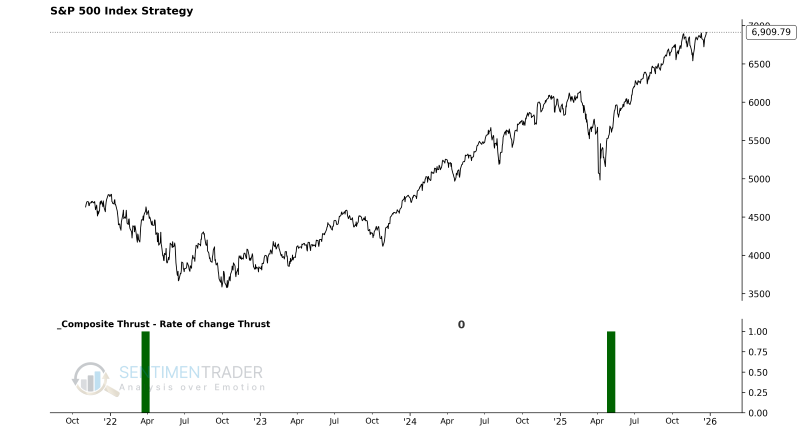
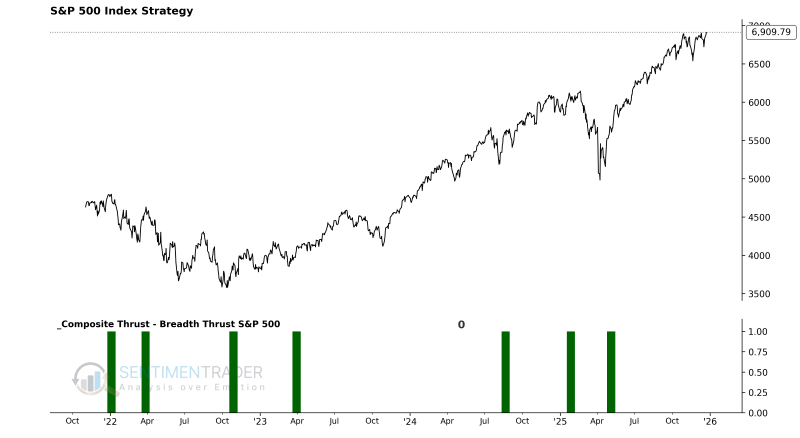
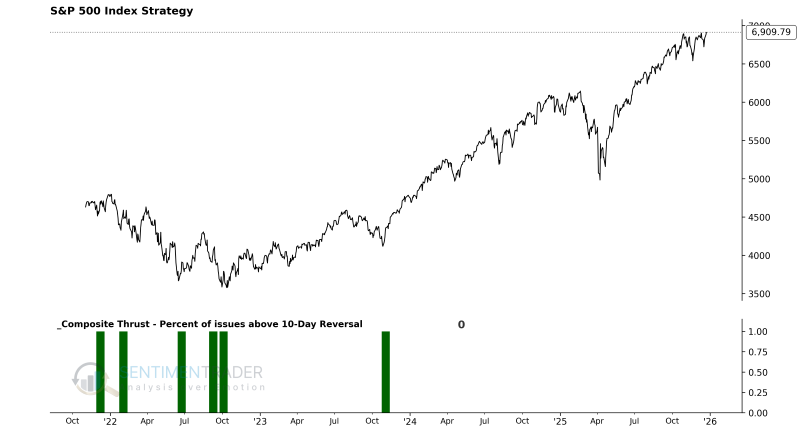
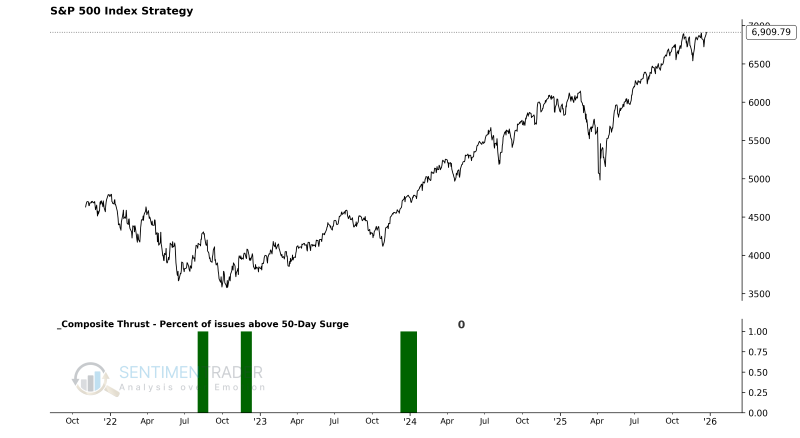
As the chart below illustrates, these individual components are combined into a single composite indicator-the Composite Thrust Model-which uses a 0 or 1 value to issue alerts. Currently, the model shows a reading of 0, indicating no thrust signal is active.
Utilizing the S-TCTM Composite Thrust Model
The model's output allows us to define the market environment as "Favorable" or "Unfavorable" without subjective interpretation. Specifically:
- When the Composite Thrust Model flips from 0 to 1, the primary trend is considered Favorable for stocks.
With this framework, we can construct a systematic trend-following strategy to see how this approach has performed historically.
Using the Backtest Edge engine, we can set up the entry and exit criteria to follow the model's signals. The setup is straightforward:
The Entry Criteria are set for when the S-TCTM Composite Thrust Model equals 1, initiating a long position when the trend becomes favorable.
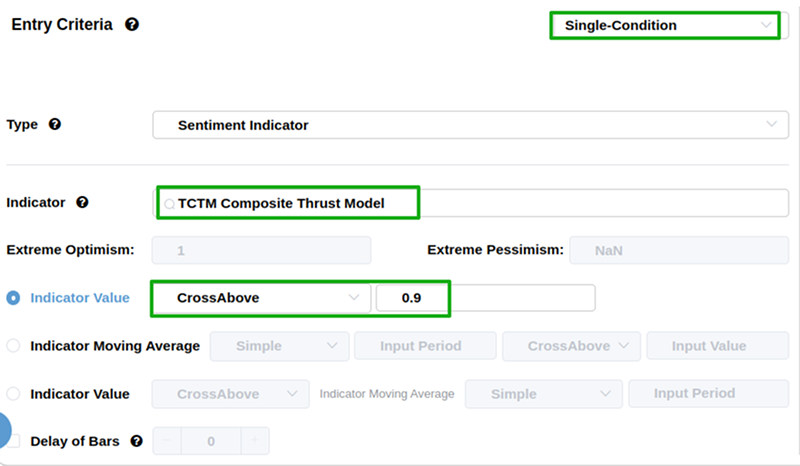
We can skip setting an explicit exit for this test, as we are primarily interested in the forward returns after the signal triggers.
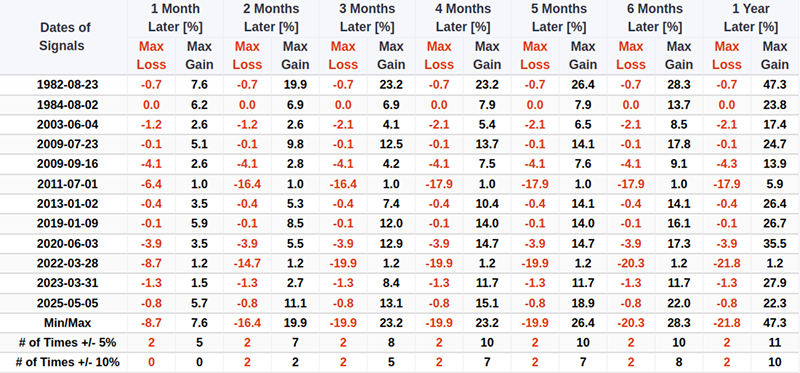
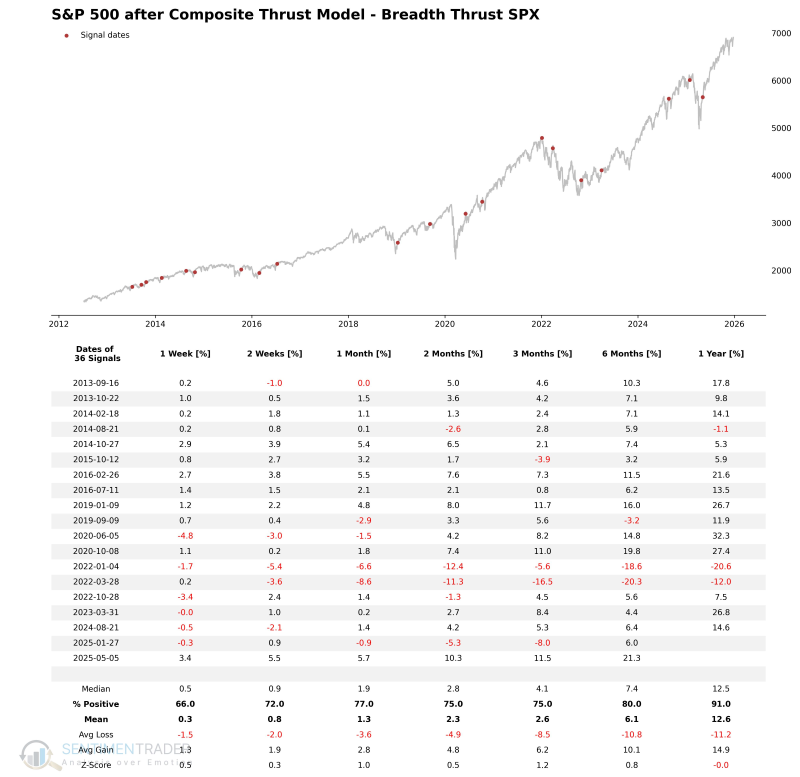
As shown in the table below, market performance is typically robust following the triggering of this signal. For related backtest, click here.
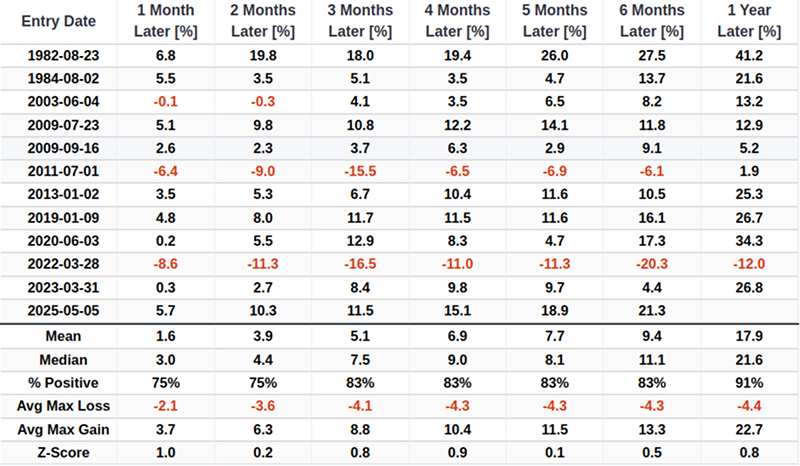
Historically, whenever this signal has triggered, the market has performed exceptionally well one year later, with 10 out of 12 instances showing a maximum gain exceeding 10%.
Component Deep Dive
Rate of Change Thrust
Although breadth-based measures remain our preferred indicator for identifying thrusts, it's essential to incorporate a variety of approaches since no single tool is foolproof. One of the most straightforward alternatives is analyzing price momentum or rate of change. Similar to breadth thrusts, when price velocity increases over a brief period, it tends to persist over longer horizons, albeit at a slower pace.
This model aims to identify moments when the S&P 500 experiences an extreme explosive rally within a short timeframe. It focuses on "momentum thrust" logic: when the index rallies rapidly over 10 trading sessions (about two weeks) and crosses an extremely high threshold, it typically marks the start of a new trend driven by strong buying pressure, reflecting intense institutional thrust.
Signal Criteria
- Condition = S&P 500 10-Day Rate of Change (ROC) > 9%.
- If the condition is met, a Rate of Change Thrust signal is issued.
Current Day Chart
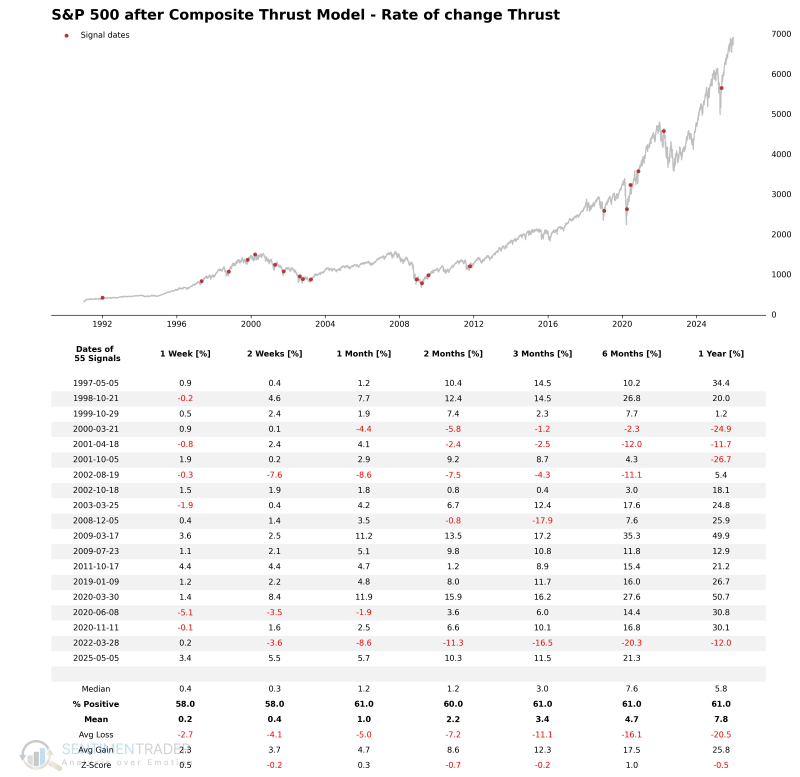
Signal Performance
Significant bursts in price momentum over ten days resulted in upside follow-through for the world's most benchmarked index, although it was not overwhelmingly positive. The uninspiring results were primarily due to precedents during the 1929-42 secular bear market. In the following decades, similar momentum has been a much more reliable indication of further upside and often marked a turning point after major market lows.
NOTE: Due to size limitations, the chart only displays the last 20 signals.
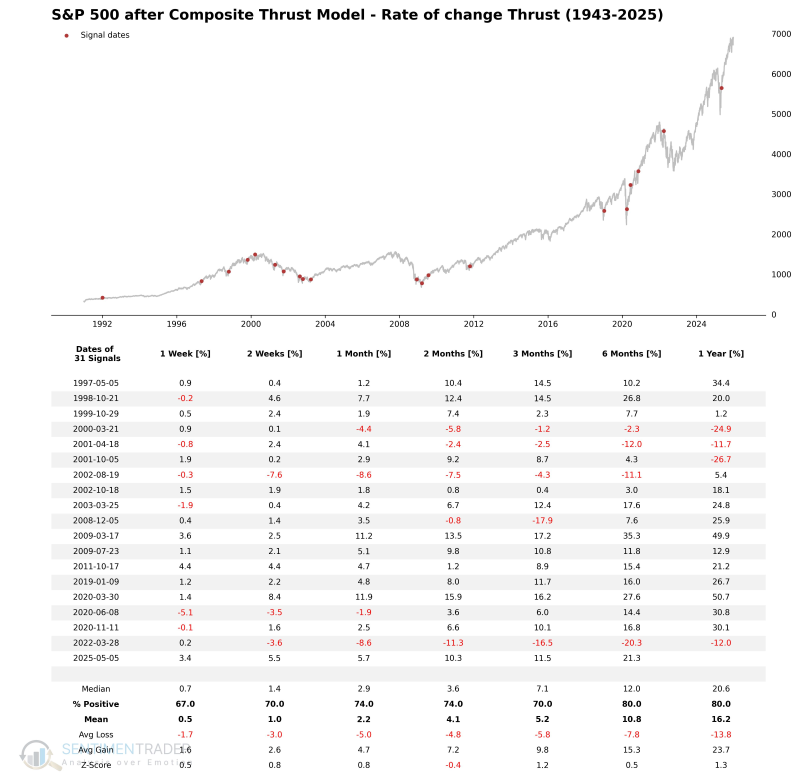
After excluding the highly volatile secular bear market period of 1929-1942, the signal results are impressive. The model delivered strong returns and consistent performance across multiple timeframes.
Breadth Thrust S&P 500
The breadth thrust system identifies when the 10-day sum of S&P 500 advancing issues exceeds the 10-day sum of S&P 500 declining issues by 2.02 to 1. We use a reset condition to screen out repeats, which requires the ratio to fall below 0.8 before a new signal can trigger again.
Components
Breadth Thrust S&P 500 Model
This model aims to identify moments when sector participation enters extreme expansion during a general market uptrend. It focuses on "breadth explosion" logic: when the ratio of advancing stocks to declining stocks within the S&P 500 crosses an extremely high threshold, it indicates that the market is in a robust phase of broad-based buying.
Signal Criteria
- Condition 1 = S&P 500 Sector Breadth Indicator (SPY 10-Day Sum Advance/Decline Ratio) rises to or exceeds 2.02.
- Condition 2 = The indicator must have previously completed a reset process (falling below 0.80) to ensure the current signal captures the start of a new thrust.
- If Conditions 1-2 are met, a Breadth Thrust S&P 500 signal is issued.
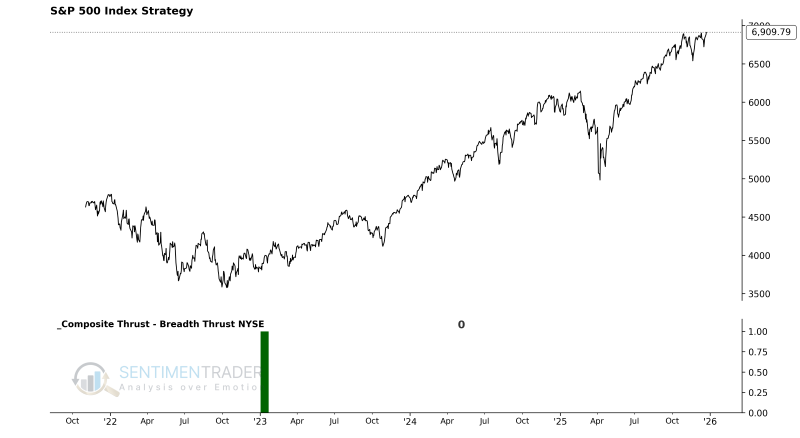
Current Day Chart
Signal Performance
Future returns, win rates, and risk/reward profiles are robust across all timeframes.
Breadth Thrust NYSE
The Breadth Thrust NYSE methodology is similar to the Breadth Thrust S&P 500, but it utilizes the NYSE 10-Day Sum Advance/Decline Ratio.
Components
Breadth Thrust NYSE Model
This model aims to identify moments when participation across the entire market (New York Stock Exchange) enters extreme expansion. It focuses on "all-market breadth explosion" logic: when the ratio of all advancing issues to declining issues on the NYSE crosses an extremely high threshold, it indicates that market sentiment has reached an extremely broad consensus, typically heralding the start of a powerful trend.
Signal Criteria
- Condition 1 = NYSE Market Breadth Indicator (NYSE 10-Day Sum Advance/Decline Ratio) rises to or exceeds 2.02.
- Condition 2 = The indicator must have previously completed a reset process (falling below 0.80) to ensure the current signal captures the start of a new market-wide thrust.
- If Conditions 1-2 are met, a Breadth Thrust NYSE signal is issued.
Current Performance
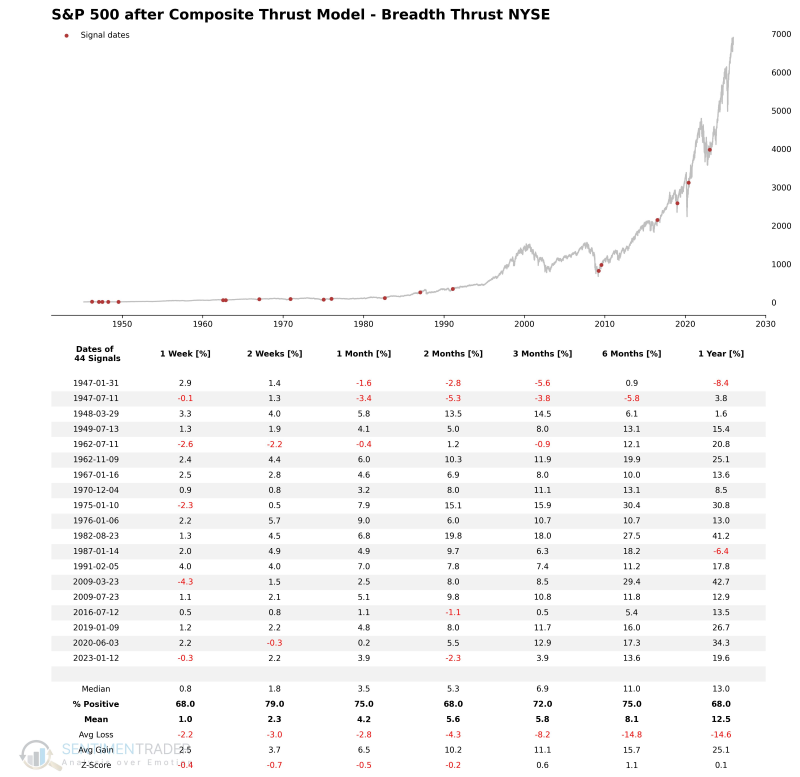
Signal Performance
The signal possesses a decent win rate across the 1 to 12-month timeframes.
Percentage of issues above the 10-day bearish to bullish reversal
This system identifies instances where the percentage of S&P 500 component stocks trading above their 10-day moving average jumps from below 12% to above 87% within nine trading sessions or fewer.
Components
10-Day Reversal Thrust Model
This model focuses on "rapid repair" logic: when a market breadth indicator surges from an extreme low (extreme pessimism) to an extreme high (extreme optimism) within a very short period (nine days or less), it often implies a structural reversal in market sentiment and confirms a bottom.
Signal Criteria
- Condition 1 = The percentage of S&P 500 stocks above their 10-day moving average previously fell below 12%.
- Condition 2 = After printing a low below 12%, the indicator rapidly rallies and breaks above 87% within the next nine trading sessions or fewer.
- If Conditions 1-2 are met, a 10-Day Reversal Thrust signal is issued.
Current Day Chart
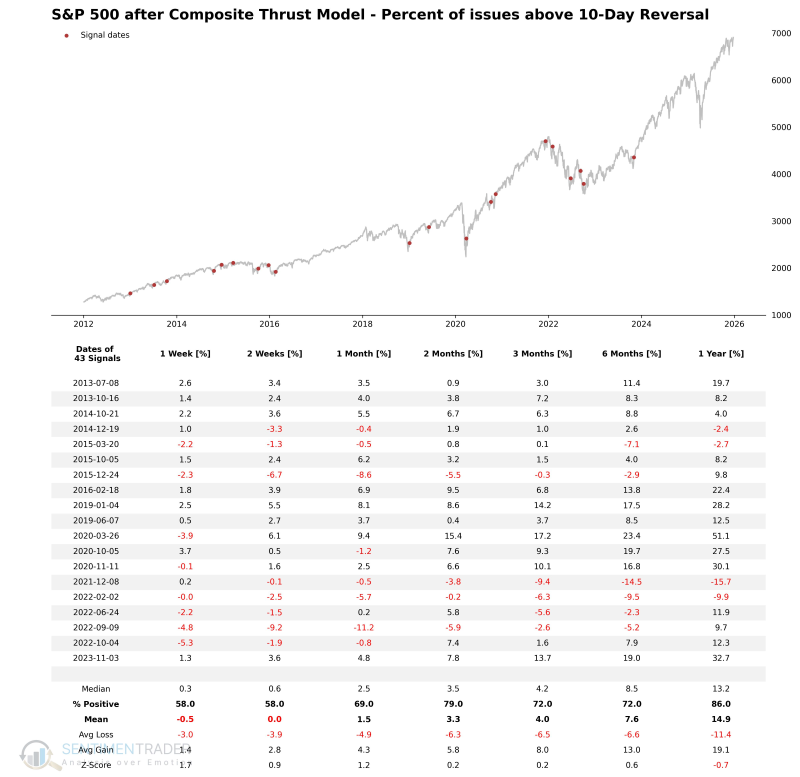
Signal Performance
Whenever the percentage of S&P 500 components above their 10-day moving average shifts from below 12% to above 87% within nine days or less, the momentum of the world's most benchmarked index is highly likely to continue upward.
Percentage of issues above the 50-day moving average surge
Components
50-Day Surge Model
This model aims to capture moments when the market enters a universally bullish phase, or a "broad surge" state. It focuses on "trend consistency" logic: when the vast majority of S&P 500 components (more than 90%) are able to hold above their 50-day moving averages, it indicates that the market has moved beyond stock-picking rotation and entered a comprehensive bull market atmosphere driven by medium-to-long-term capital. Such extremely high percentages typically occur during the confirmation phase of a strong uptrend.
Signal Criteria
- Condition = The percentage of S&P 500 stocks above their 50-day moving average breaks through and exceeds 90%.
- If the condition is met, a 50-Day Surge Model signal is issued.
Current Day Performance
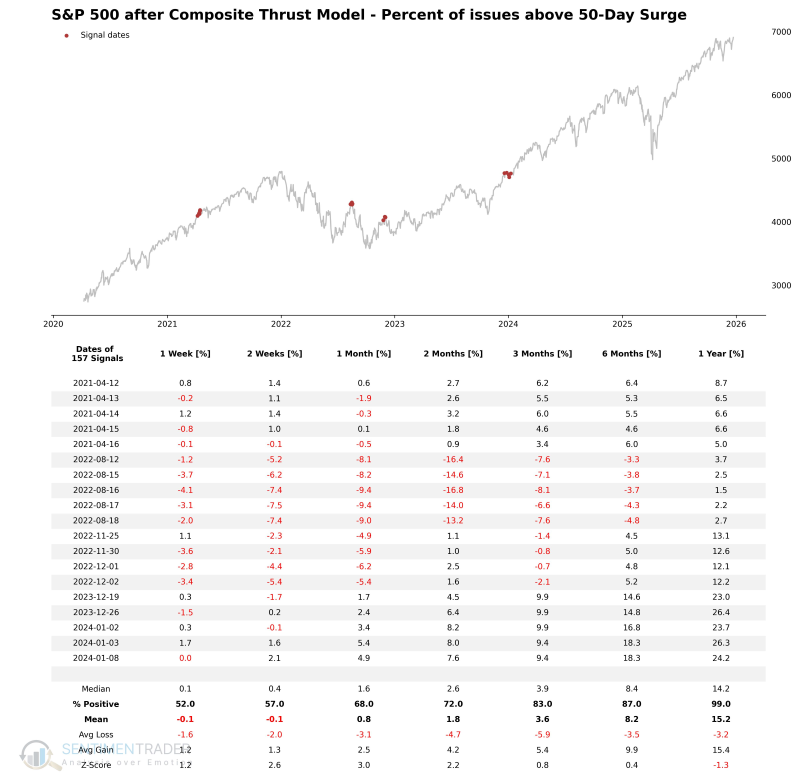
Signal Performance
As seen in the chart, the win rate increases as the time horizon extends.
What the research tells us...
The S-TCTM Composite Thrust Model is a powerful 'weight-of-the-evidence' tool designed to identify the initiation of significant market uptrends. By aggregating signals from price momentum (ROC) and various breadth thrust metrics (S&P 500 and NYSE A/D ratios, moving average surges), it distinguishes between routine rallies and powerful, sustainable advances.
When the composite model triggers (score >= 30%), it indicates that buying pressure is not only intense but also broad-based. Historical data confirms that such coordinated strength is rarely a "fake out" but rather a reliable signal that the path of least resistance has shifted higher, offering a favorable setup for long-term investors.