
An In-Depth Look at the Sentimentrader's New TCTM Confirmation Model - Part II

Key points
- This report is Part II of our deep dive into the S-TCTM Composite Confirmation Model, analyzing the remaining components (5-10).
- We examine metrics that validate market breadth through cyclical sector participation, macro-liquidity signals (ISM & OECD), and long-term trend scores.
- Historically, when these diverse confirmation signals cluster together, they have reliably identified sustainable bull markets with high win rates over 6-12 months.
The Composite Confirmation Model Components
Identifying the primary market trend is one of the most critical tasks for any trader or investor. The Tactical Composite Trend Model (TCTM) is the culmination of decades of professional trading and financial market research, designed to aid in this process. The TCTM utilizes a weight-of-the-evidence approach, combining seven key time-tested components to identify major market turning points. This report will focus on one of those key components: the Sentimentrader's New TCTM (S-TCTM) Composite Confirmation Model.
The following analysis utilizes a Composite Confirmation Model that includes ten measures for identifying extreme momentum through internal and external participation.
Component Descriptions
- Industrial Equal-Weight Relative Ratio
- Small Cap/S&P 500 Relative Ratio Rank
- Moving Average Bearish to Bullish Reversal Streak
- Percentage of Sub-Industry Groups with + 1-YR-ROC
- Cyclical Group Average Percent Below High Buy
- Composite Trend Model Bearish to Bullish Reversal
- Deviation From Trend Thrust
- ISM Liquidity Signals
- OECD LEI Signal
- Composite Trend Model
Composite Confirmation Model Signal Criteria
- Condition = Composite Signal Count >= 30%.
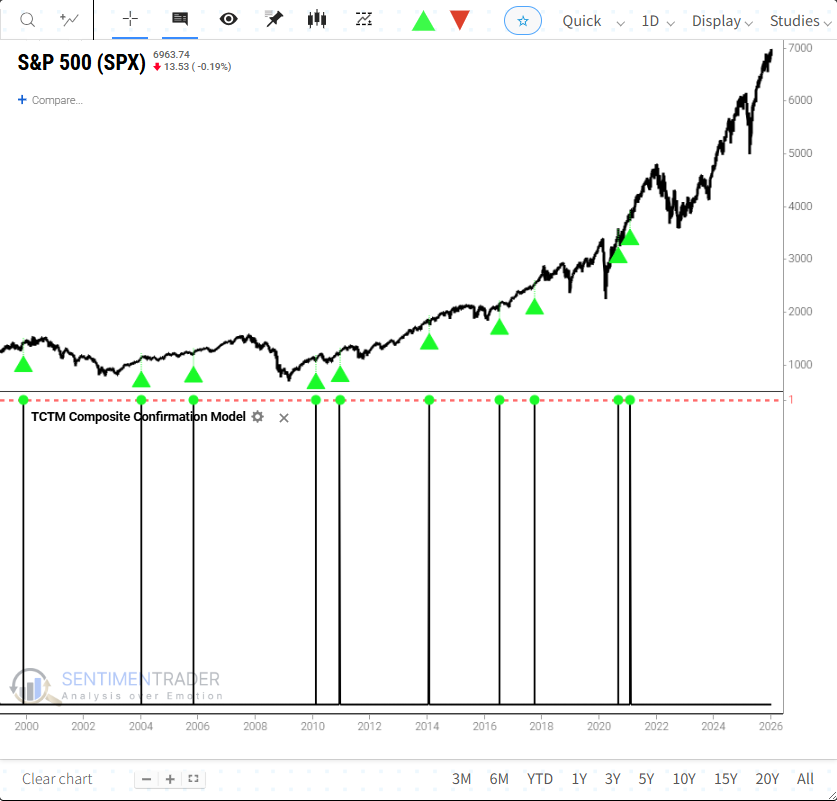
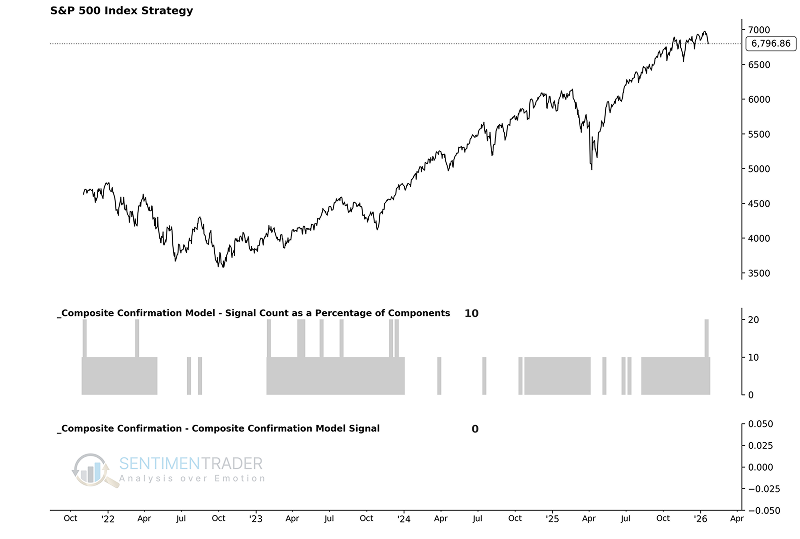
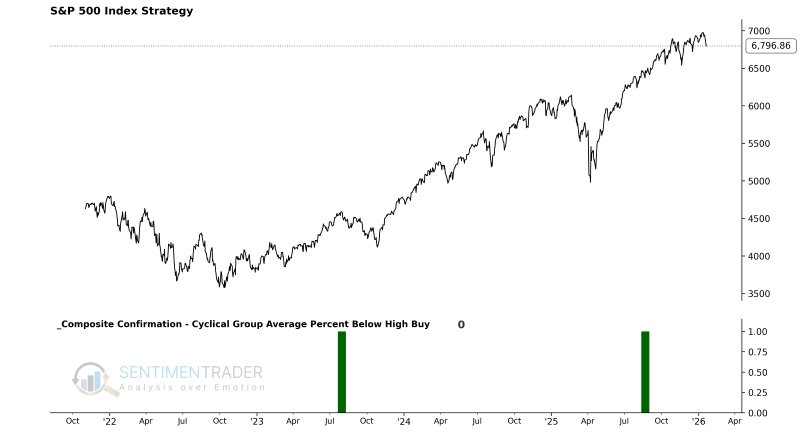
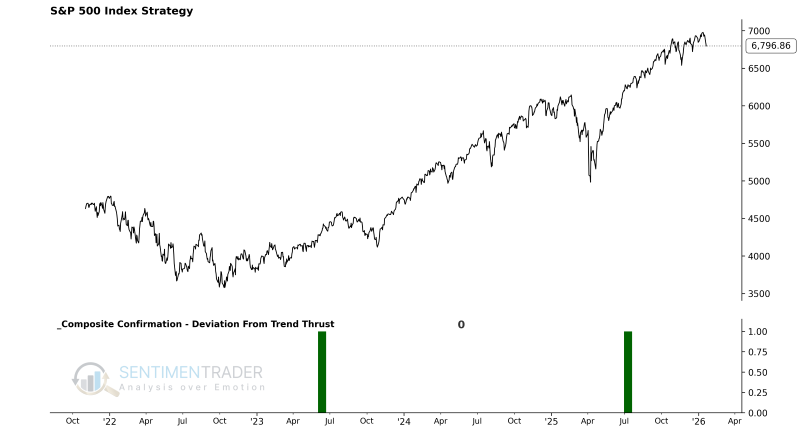
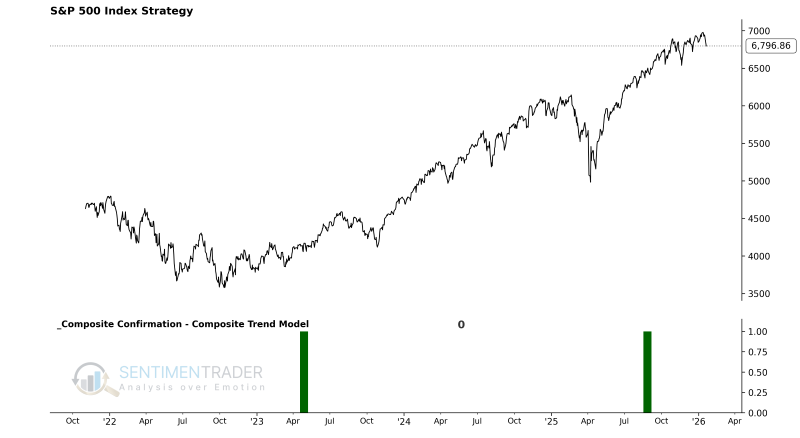
As the chart below illustrates, these individual components are combined into a single composite indicator-the Composite Confirmation Model-which uses a 0 or 1 value to issue alerts. Currently, the model shows a reading of 0, indicating no confirmation signal is active.
Utilizing the S-TCTM Composite Confirmation Model
The model's output allows us to define the market environment as "Favorable" or "Unfavorable" without subjective interpretation. Specifically:
- When the Composite Confirmation Model flips from 0 to 1, the primary trend is considered Favorable for stocks.
With this framework, we can construct a systematic trend-following strategy to see how this approach has performed historically.
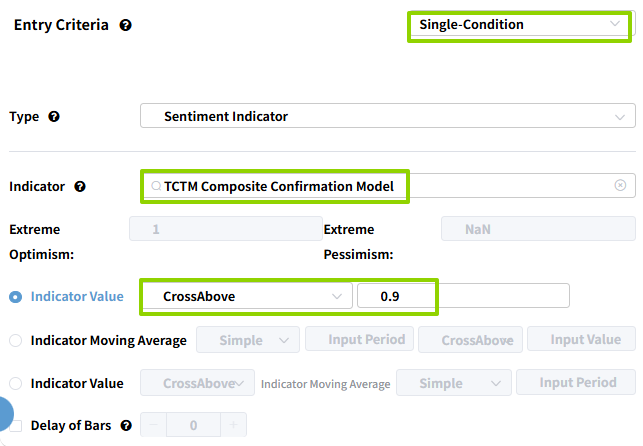
Using the Backtest Edge engine, we can set up the entry and exit criteria to follow the model's signals. The setup is straightforward:
The Entry Criteria are set for when the S-TCTM Composite Confirmation Model equals 1, initiating a long position when the trend becomes favorable.
We can skip setting an explicit exit for this test, as we are primarily interested in the forward returns after the signal triggers.
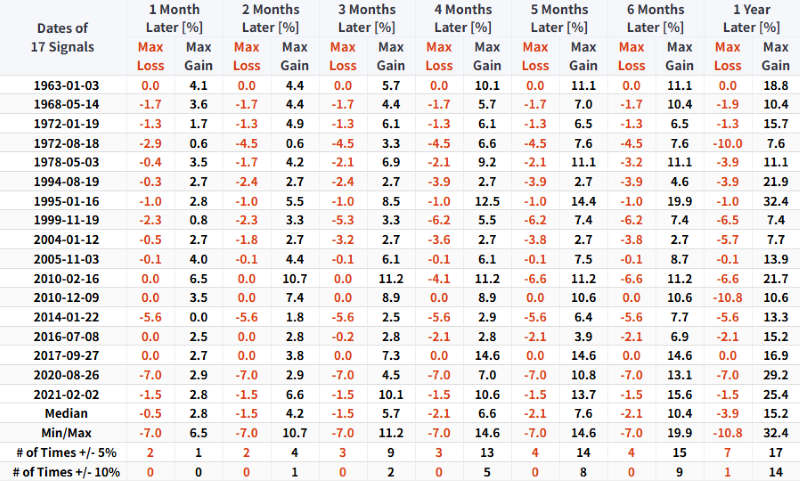
As shown in the table below, market performance is typically robust following the triggering of this signal. For related backtest, click here.
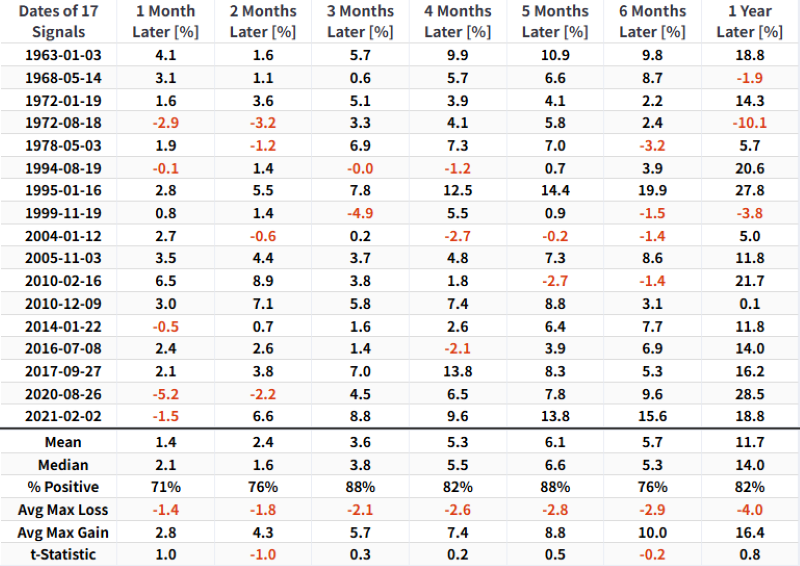
Historically, whenever this signal has triggered, the market has performed exceptionally well, with only one instance of a maximum drawdown exceeding 10%.
Component Deep Dive (Part II)
Cyclical Group Average Percent Below High Buy
Components
- S&P 1500 Auto & Parts Index
- Cyclical Industry ETF Portfolio
Cyclical Group Average Percent Below High Buy Model
This model is not designed to provide timely market signals but rather to verify the transition from a bearish trend to a bullish one. It focuses on "elasticity reversion" logic: Cyclical sectors (such as Autos, Transportation, Housing, and Equal-Weight Consumer Discretionary) are extremely sensitive to the economic cycle. When the average drawdown of these groups from their one-year highs exceeds 20%, it indicates the market is at a cyclical bottom or experiencing severe irrational selling. Subsequently, when the average drawdown narrows to within 2.5%, it marks a comprehensive return of cyclical capital, signaling the market has entered an extremely strong phase of synchronized new highs.
Signal Criteria
- Condition 1 = The average drawdown from 252-day highs (GapMean) for the selected cyclical industry groups falls below -20%.
- Condition 2 = After meeting Condition 1, the average drawdown narrows and recovers to above -2.5%.
- If Conditions 1-2 are met, a Cyclical Group Average Percent Below High Buy signal is issued.
Current Day Chart
Signal Performance
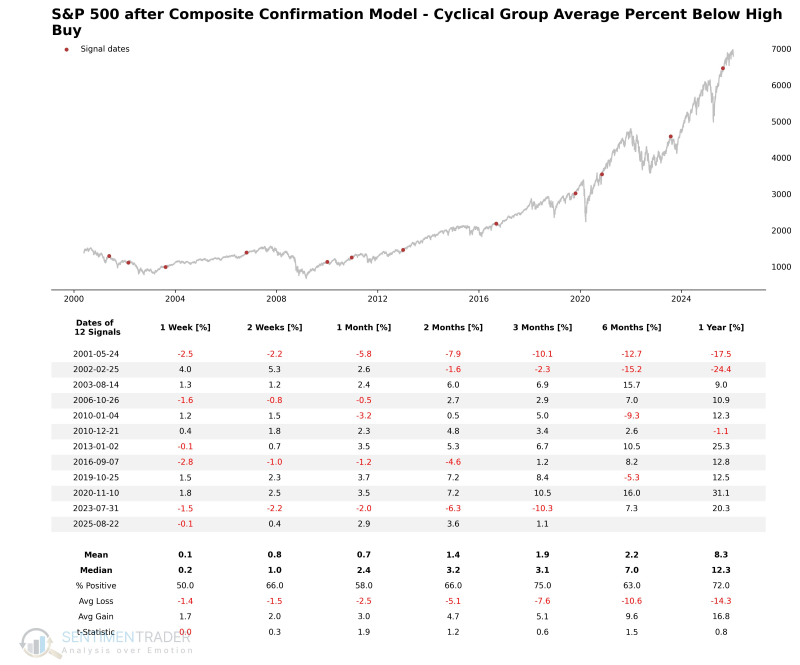
When the average distance from 52-week highs for the cyclical stock portfolio shifts from below -20% to above -2.5%, the S&P 500 Index demonstrates significant returns and stability.
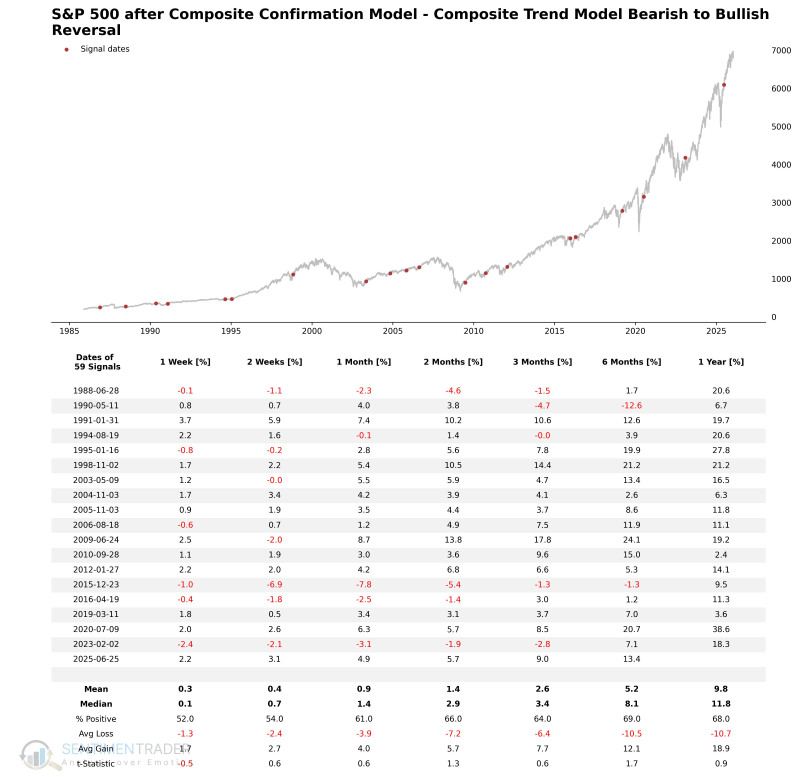
Composite Trend Model Bearish to Bullish Reversal
Components
Composite Trend Model Bearish to Bullish Reversal
This model aims to identify the qualitative shift in the market from structural decline to comprehensive trend strength. It focuses on "trend score repair" logic: utilizing a composite scoring system to measure the trend health of the S&P 500.
When the score drops to 2 or below, it indicates the market is in extreme weakness or a confirmed downtrend. Subsequently, if the score rebounds rapidly to reach or exceed 8, it signals that the market has not only completed a bottom reversal but has also established an extremely solid bullish structure.
Signal Criteria
- Condition 1 = The S&P 500 (SPX) Trend Score previously dropped to 2 or lower.
- Condition 2 = After meeting Condition 1, the Trend Score rebounds significantly to reach or exceed 8.
- If Conditions 1-2 are met, a Composite Trend Model Bearish to Bullish Reversal signal is issued.
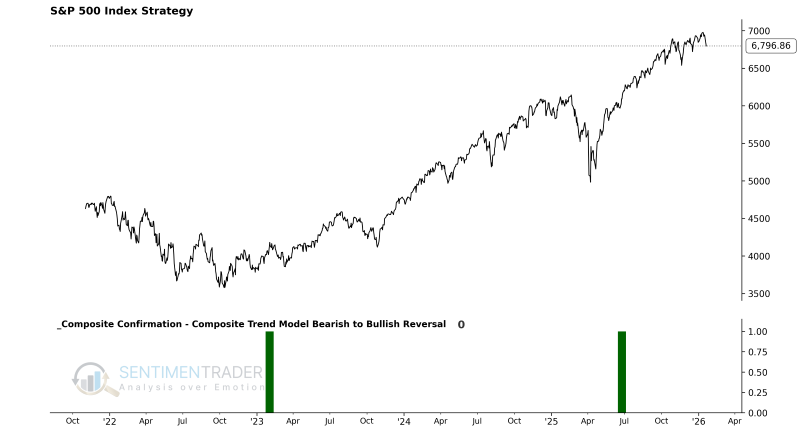
Current Day Chart
Signal Performance
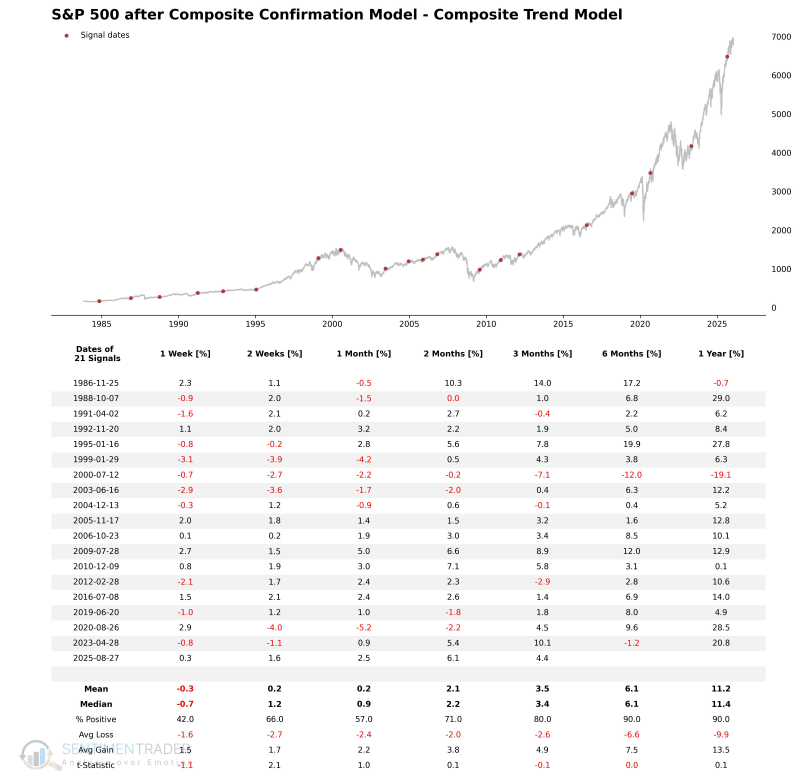
Whenever the S&P 500 Composite Trend Model rises from 2 or lower to 8 or higher, the index-as the world's most representative benchmark-tends to advance over the following year, particularly in recent decades.
NOTE: Due to size limitations, the chart only displays the last 20 signals.
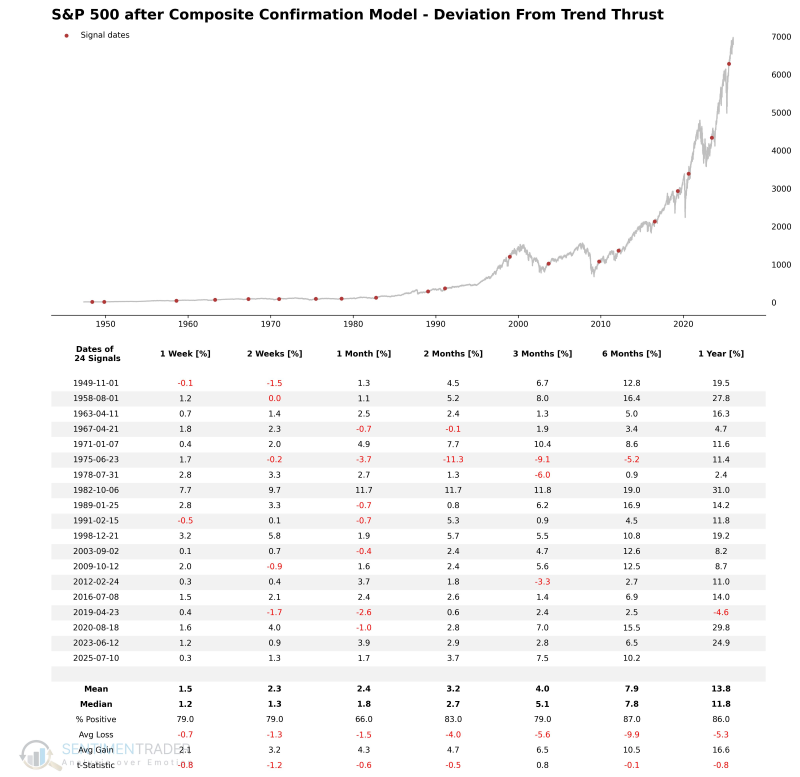
Deviation From Trend Thrust
Components
- S&P 500 Index Close
Deviation From Trend Thrust Model
This model aims to identify extreme moments when the market confirms a trend reversal through new highs after experiencing a significant divergence from medium-term moving averages. It focuses on "oversold repair and momentum return" logic: it first requires the market to undergo severe negative deviation, where the short-term moving average falls significantly below the long-term average, confirming a deep bear environment. Subsequently, the model requires not only a "Golden Cross" in the moving average system but also a strong price action confirmation-specifically, hitting a new annual high. This logic effectively captures breakout points following major medium-to-long-term bottoms.
Signal Criteria
- Condition 1 = The ratio of the S&P 500's 30-day moving average to its 150-day moving average falls below 0.95.
- Condition 2 = After meeting Condition 1, the moving average ratio recovers to break above 1.03, AND on the same day, the S&P 500 close hits a new 252-day (approx. one year) high.
- If Conditions 1-2 are met, a Deviation From Trend Thrust signal is issued.
Current Day Chart
Signal Performance
An upward trend in price momentum (marked by the Deviation From Trend indicator) typically signals a favorable period for the S&P 500 over the coming year.
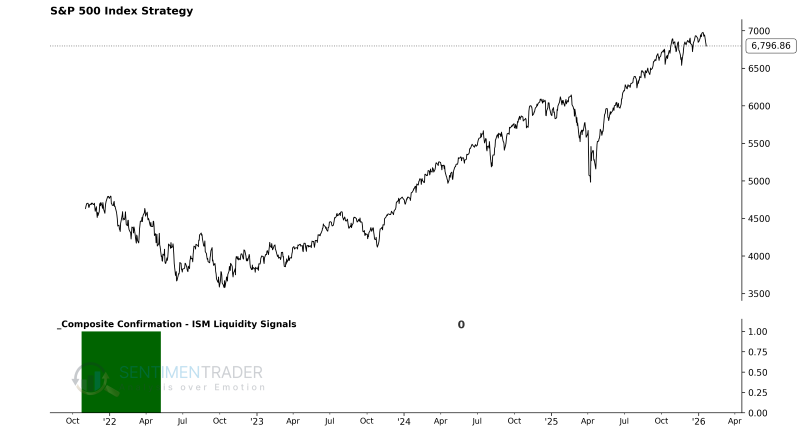
ISM Liquidity Signals & OECD LEI Signal
The Sentimentrader's New TCTM (S-TCTM) Composite Confirmation Model uses both ISM Liquidity Signals and the OECD LEI Signal to identify uptrends in the S&P 500. Since these generate relatively frequent signals, we will not display every specific signal date.
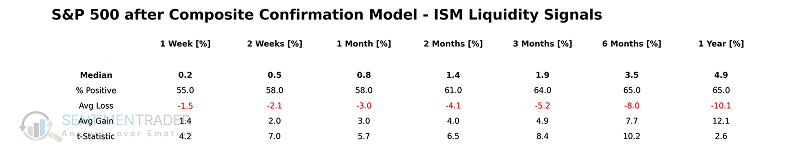
ISM Manufacturing PMI Thrust
This model aims to identify market uptrends through the macroeconomic expansion cycle. It focuses on "macro prosperity confirmation" logic: The ISM Manufacturing Index is a core indicator of U.S. economic health. When the PMI reading crosses the key threshold of 56, it signals that the macroeconomy has entered a phase of accelerated expansion.
Components
Current Day Chart
Signal Performance
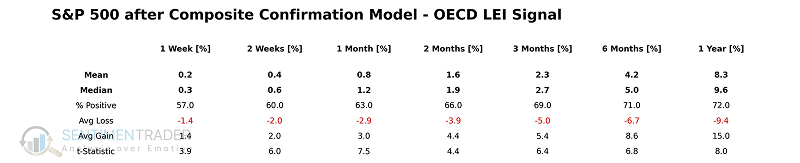
OECD Leading Indicator Growth
This model aims to identify long-term market upward momentum through global macroeconomic turning points. It focuses on "macro trend confirmation" logic: The OECD Composite Leading Indicator (CLI) is designed to anticipate turning points in economic activity 6 to 9 months in advance. To filter out random fluctuations (noise) in monthly data, the model requires the CLI indicator to show growth for two consecutive months.
Components
- OECD Composite Leading Indicator (OECDCLI)
Current Day Chart
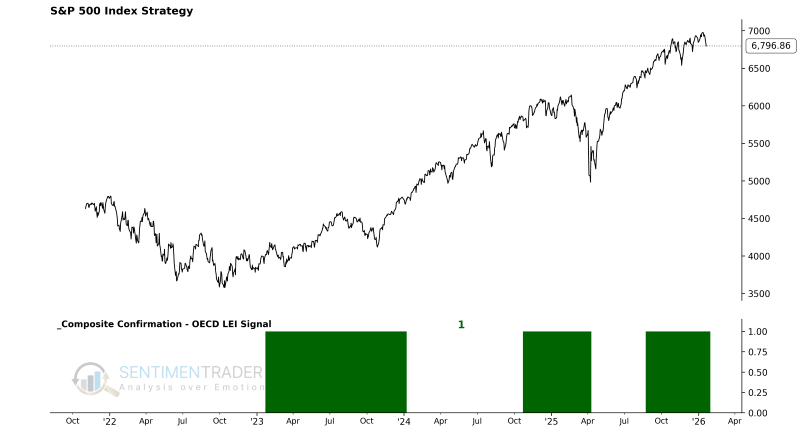
Signal Performance
Composite Trend Model
Components
- S&P 500 Index Close
Composite Trend Model
This model uses a multi-dimensional quantitative scoring system to identify the structural transition of the market from systemic collapse to extremely strong trend. The scoring logic covers the slope of prices relative to 50/100/200-day moving averages and their alignment to measure the current price strength within specific cycles. The model focuses on "trend quality change" logic: by capturing the crossover of the score from a very low negative value to a very high positive value (9 or above), it locks onto the start of medium-to-long-term bull markets with extremely high win rates.
Signal Criteria
- Condition 1 = Composite Trend Score falls to -4 or below.
- Condition 2 = After meeting Condition 1, the scoring system rebounds significantly to reach or exceed 9.
- If Conditions 1-2 are met, a Composite Trend Model signal is issued.
Current Day Chart
Signal Performance
When the Composite Trend Model fluctuates from a level of -4 or worse to +9 or better, the S&P 500 Index rises 90% of the time over the following six months and one year.
What the research tells us...
In Part II of our analysis on the S-TCTM Composite Confirmation Model, we explored components that validate the market's structural health through cyclical sector recovery, macroeconomic expansion signals (ISM & OECD), and rigorous trend scoring. These models act as the final "quality control" check for a bull market.
The historical performance of these signals-particularly the Composite Trend Model's ability to identify shifts from deep weakness to extreme strength-underscores their value. When these indicators align, they confirm that the market is not just experiencing a fleeting bounce, but has likely entered a durable uptrend supported by broad economic and technical foundations.