
An In-Depth Look at the Sentimentrader's New TCTM Confirmation Model - Part I

Key points
- This report introduces the S-TCTM Composite Confirmation Model, a model aggregates 10 diverse metrics-ranging from sector equal-weight ratios to small-cap relative strength and cyclical group participation-to confirm the durability of market uptrends.
- A signal is triggered when at least 30% of the components are active, indicating a broad-based improvement in market structure.
- Historically, these confirmation signals have been exceptionally reliable, with the composite model showing minimal drawdowns and strong positive returns after triggering.
The Composite Confirmation Model Components
Identifying the primary market trend is one of the most critical tasks for any trader or investor. The Tactical Composite Trend Model (TCTM) is the culmination of decades of professional trading and financial market research, designed to aid in this process. The TCTM utilizes a weight-of-the-evidence approach, combining seven key time-tested components to identify major market turning points. This report will focus on one of those key components: the Sentimentrader's New TCTM (S-TCTM) Composite Confirmation Model.
The following analysis utilizes a Composite Confirmation Model that includes ten measures for identifying extreme momentum through internal and external participation.
Component Descriptions
- Industrial Equal-Weight Relative Ratio
- Small Cap/S&P 500 Relative Ratio Rank
- Moving Average Bearish to Bullish Reversal Streak
- Percentage of Sub-Industry Groups with + 1-YR-ROC
- Cyclical Group Average Percent Below High Buy
- Composite Trend Model Bearish to Bullish Reversal
- Deviation From Trend Thrust
- ISM Liquidity Signals
- OECD LEI Signal
- Composite Trend Model
Composite Confirmation Model Signal Criteria
- Condition = Composite Signal Count >= 30%.
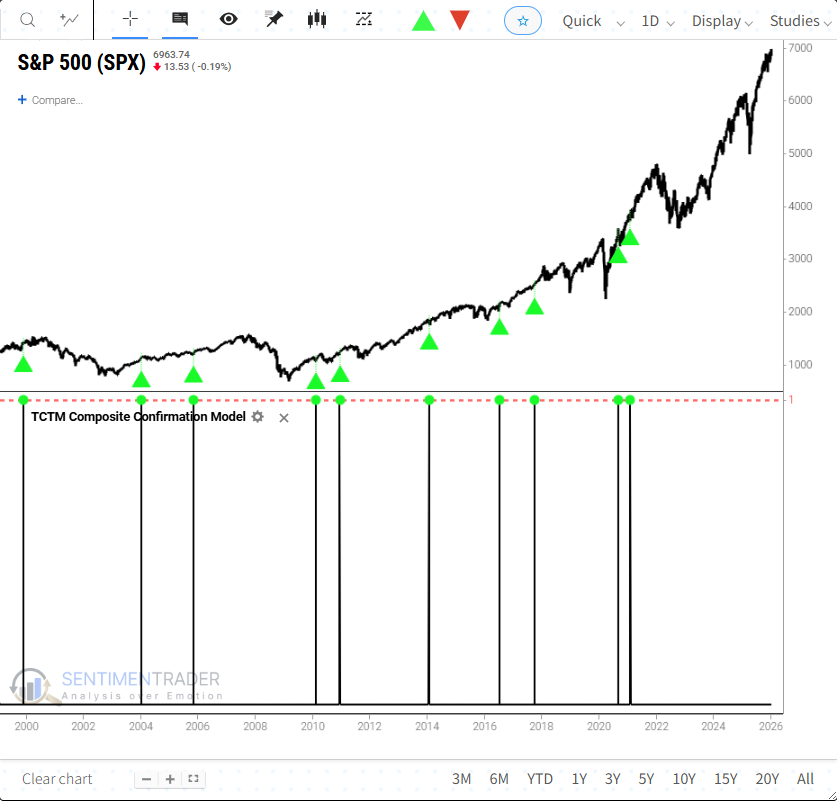
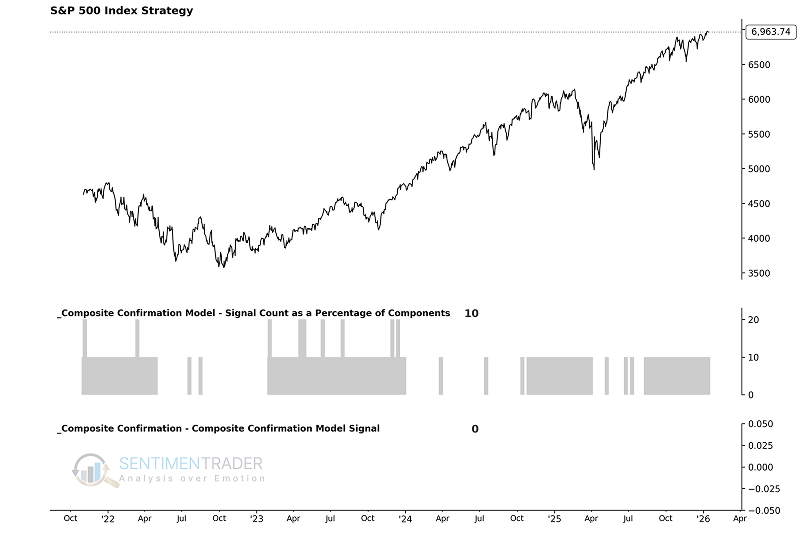
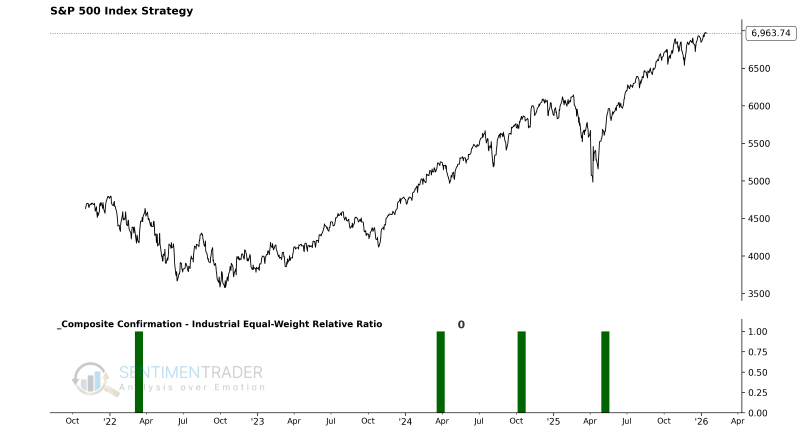
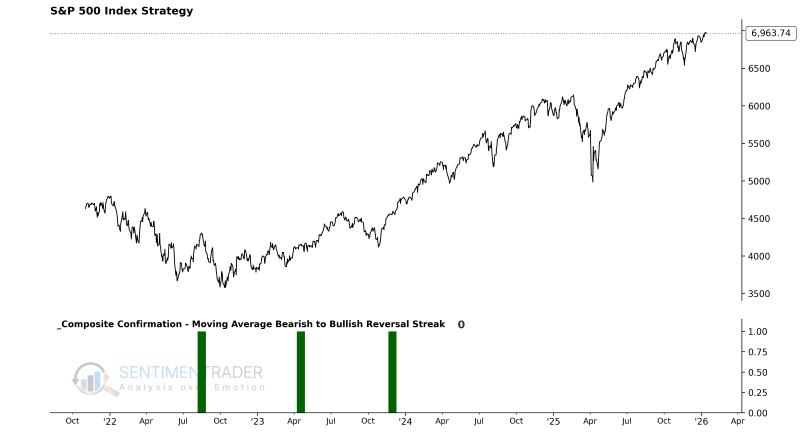
As the chart below illustrates, these individual components are combined into a single composite indicator-the Composite Confirmation Model-which uses a 0 or 1 value to issue alerts. Currently, the model shows a reading of 0, indicating no confirmation signal is active.
Utilizing the S-TCTM Composite Confirmation Model
The model's output allows us to define the market environment as "Favorable" or "Unfavorable" without subjective interpretation. Specifically:
- When the Composite Confirmation Model flips from 0 to 1, the primary trend is considered Favorable for stocks.
With this framework, we can construct a systematic trend-following strategy to see how this approach has performed historically.
Using the Backtest Edge engine, we can set up the entry and exit criteria to follow the model's signals. The setup is straightforward:
The Entry Criteria are set for when the S-TCTM Composite Confirmation Model equals 1, initiating a long position when the trend becomes favorable.
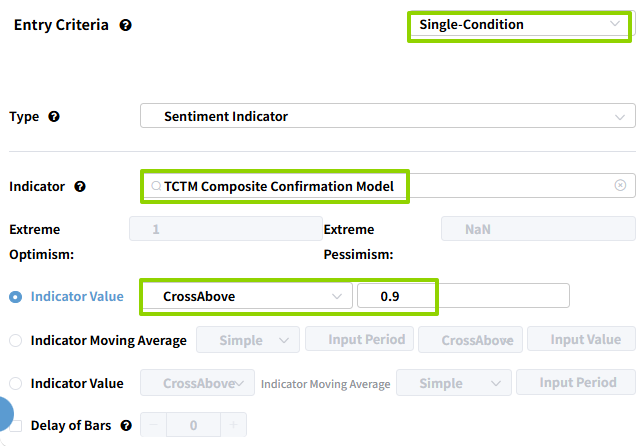
We can skip setting an explicit exit for this test, as we are primarily interested in the forward returns after the signal triggers.
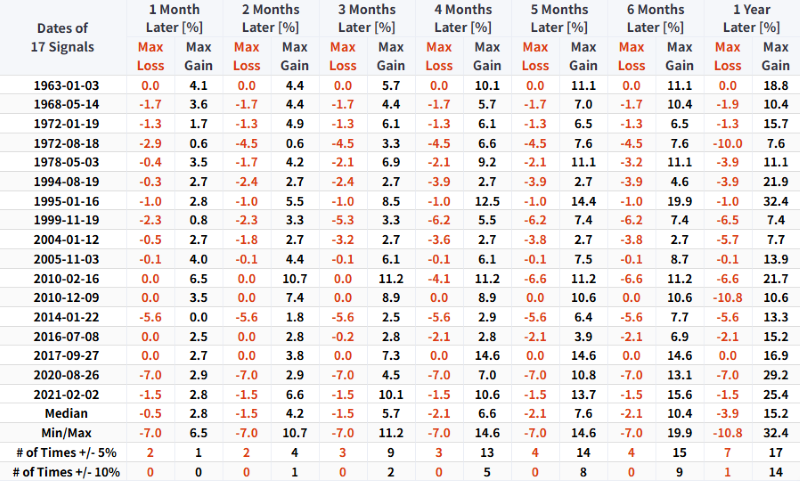
As shown in the table below, market performance is typically robust following the triggering of this signal. For related backtest, click here.
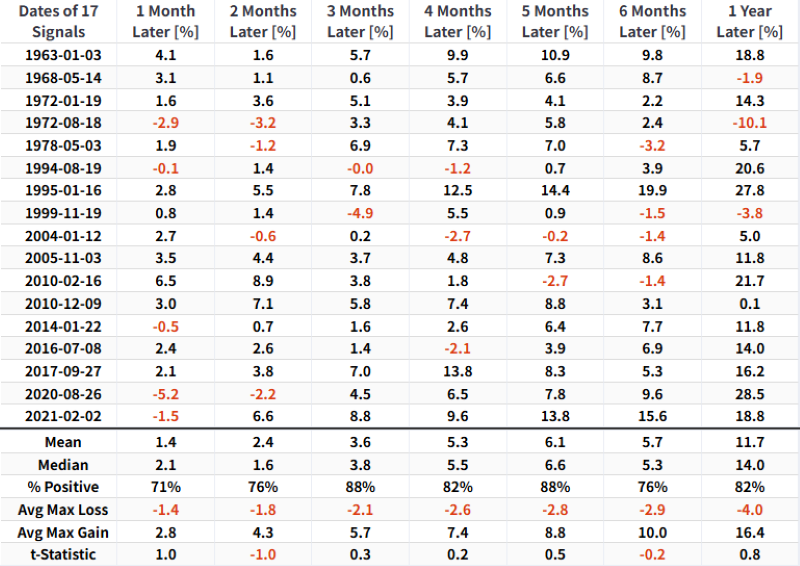
Historically, whenever this signal has triggered, the market has performed exceptionally well, with only one instance of a maximum drawdown exceeding 10%.
Component Deep Dive
Industrial Equal-Weight Relative Ratio
Components
- Invesco S&P 500 Equal Weight Industrials (RSPN)
- S&P 500 Index Close (SPX Close)
Industrial Equal-Weight Relative Ratio Model
This model aims to identify extreme shifts in market style by analyzing the relative strength of equal-weight versus market-cap weight. It focuses on "mean reversion and momentum repair" logic: when the ratio of the equal-weight index to the S&P 500 hits a 105-day low (Rank 0), it reflects a market structure heavily reliant on a few mega-cap stocks, indicating fragility. Subsequently, if this ratio rapidly rebounds to the top of its range (Rank 98+), it marks a significant structural expansion in market participation.
Signal Criteria
- Condition 1 = The Industrial Equal-Weight Relative Ratio (RSPN/SPX) hits a 105-day low (Range Rank = 0).
- Condition 2 = After meeting Condition 1, the ratio's rank rebounds to reach or exceed 98.
- If Conditions 1-2 are met, an Industrial Equal-Weight Relative Ratio signal is issued.
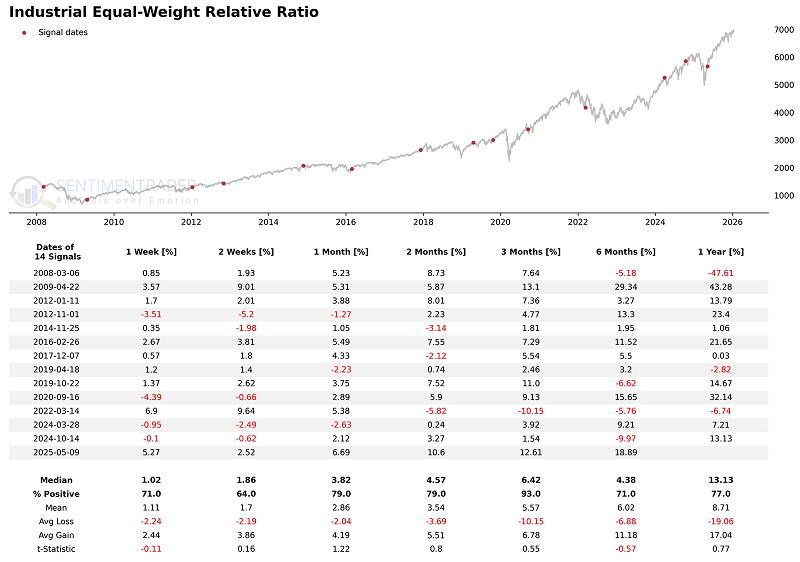
Current Day Chart
Signal Performance
As seen in the chart, performance is strong across various timeframes, particularly over the three-month horizon.
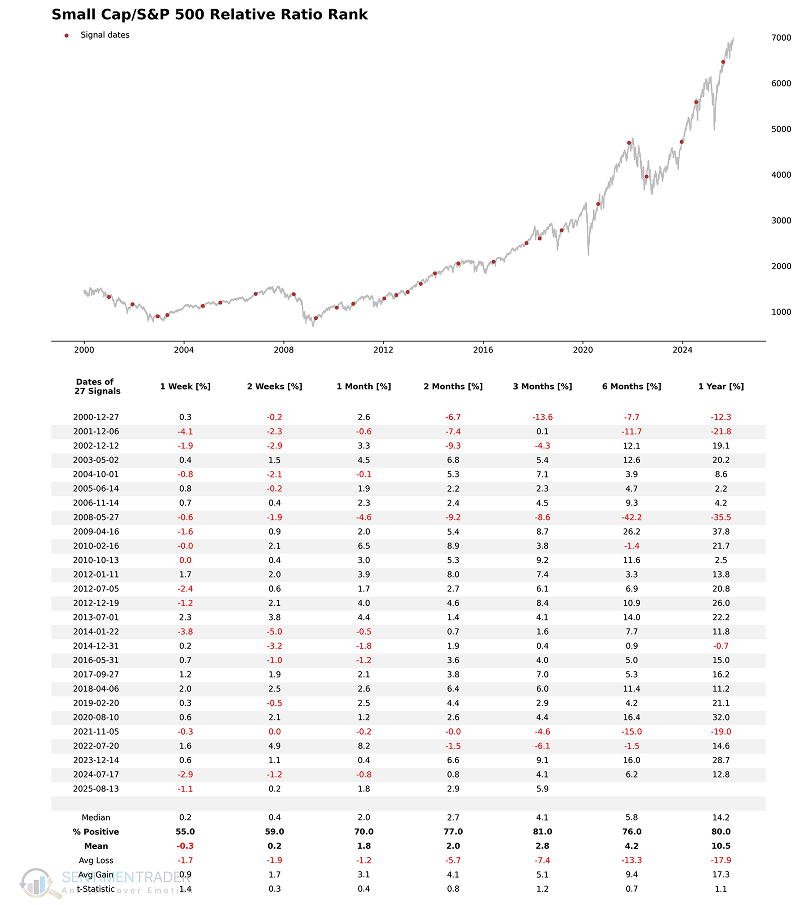
Small Cap/S&P 500 Relative Ratio Rank
Components
Small Cap/S&P 500 Relative Ratio Rank Model
This model aims to identify style rotation and momentum reversal between small caps and large caps. It focuses on "elasticity repair" logic: Small caps are typically more sensitive to market liquidity and risk appetite. When the relative ratio hits an extreme low, it signals that small caps are oversold to an extreme. A subsequent rapid surge in rank to above 90 indicates a significant recovery in risk appetite.
Signal Criteria
- Condition 1 = The Small Cap / S&P 500 Relative Ratio (RR84) falls below 1.
- Condition 2 = After meeting Condition 1, the relative ratio rank rebounds and breaks above 90.
- If Conditions 1-2 are met, a Small Cap Relative Ratio Rank signal is issued.
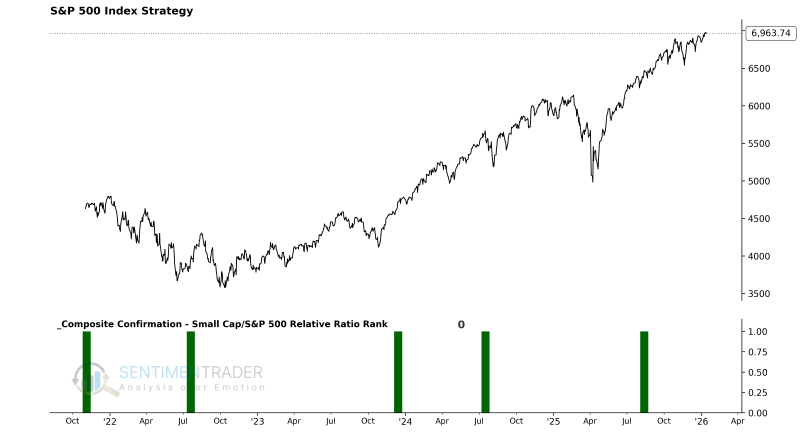
Current Day Chart
Signal Performance
The signal possesses a decent win rate across medium-to-long-term timeframes.
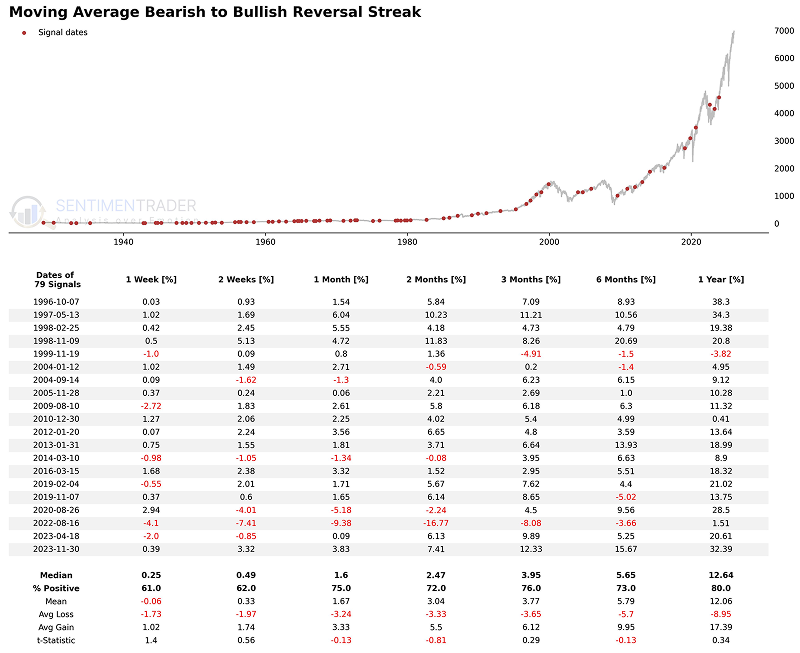
Moving Average Bearish to Bullish Reversal Streak
Components
- S&P 500 Index Close
Moving Average Bearish to Bullish Reversal Streak Model
This model aims to identify the kinetic shift from a persistent downtrend to structural strength. It focuses on "trend endurance" logic: rather than looking for a momentary breakout, it requires price to first remain suppressed below a moving average for a sufficient duration (confirming a weak trend), and then demonstrate the ability to hold above that average for an even longer duration (confirming a strong reversal).
Signal Criteria
- Condition 1 = The S&P 500 Close is consecutively below its 10-day moving average for 12 or more trading sessions.
- Condition 2 = After meeting Condition 1, the S&P 500 Close shifts to being consecutively above its 10-day moving average for 21 or more trading sessions.
- If Conditions 1-2 are met, a Moving Average Reversal Streak signal is issued.
Current Day Chart
Signal Performance
As seen in the chart, win rates and returns increase as the time horizon extends.
NOTE: Due to size limitations, the chart only displays the last 20 signals.
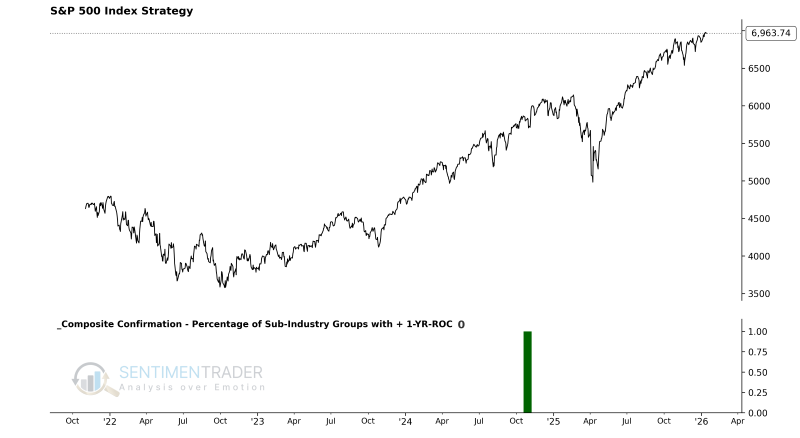
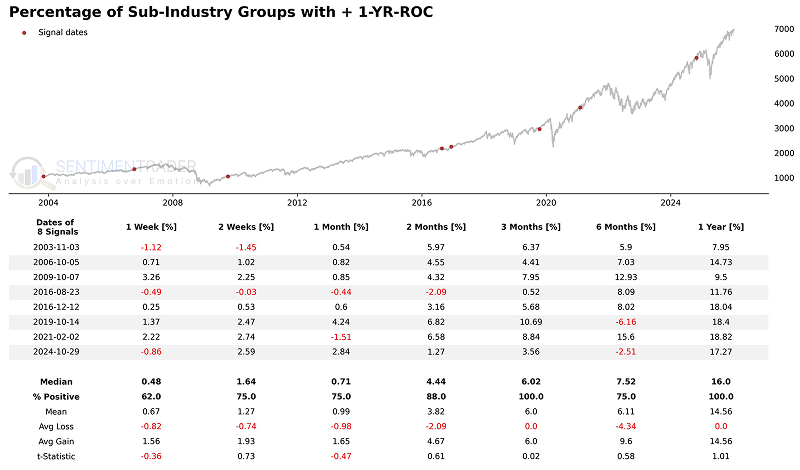
Percentage of Sub-Industry Groups with + 1-YR-ROC
Components
- 21 Core Sub-Industry Indices (covering Consumer Discretionary, Hotels, Homebuilding, etc.)
- 252-Day Rate of Change (1-Year ROC)
Percentage of Sub-Industry Groups with + 1-YR-ROC Model
This model tracks the annual return performance of 21 representative core sub-industries to capture systemic turns in market internal structure. It focuses on "industry breadth recovery" logic: when fewer than 30% of these core groups maintain positive annual returns, the market is in a state of extreme pessimism and oversold conditions. When this ratio rapidly repairs and exceeds 75%, it signifies a qualitative shift from narrow support to broad-based participation, confirming the establishment of a new medium-to-long-term uptrend.
Signal Criteria
- Condition 1 = The percentage of the 21 specified sub-industries with positive annual returns (252-day ROC) falls below 30%.
- Condition 2 = After meeting Condition 1, the percentage recovers and breaks above 75%.
- If Conditions 1-2 are met, a Sub-Industry Positive Return Ratio signal is issued.
Current Day Chart
Signal Performance
Although the sample size is small, whenever the percentage of cyclical sub-industry groups with positive one-year returns jumps from under 30% to over 75%, the world's most representative index has risen 100% of the time over the subsequent year.
What the research tells us...
The S-TCTM Composite Confirmation Model serves as a robust filter for validating market trends. By requiring multiple independent signals-such as the rotation from large-cap dominance to broad participation (Equal-Weight Ratio), the revival of risk appetite (Small Cap Ratio), and the persistence of price strength (Moving Average Streak)-it filters out noise and identifies high-conviction turning points.
When the composite score exceeds 30%, it confirms that the market's recovery is structural rather than fleeting. The historical data supports this, showing that such synchronized improvements in market internals are reliable precursors to sustained equity gains, making this model an essential tool for trend-following strategies.