
An In-Depth Look at the Sentimentrader's New TCTM Composite Washout Model - Part I

Key points
- This report introduces the new TCTM (S-TCTM) Composite Washout Model, a key component of our broader Tactical Composite Trend Model.
- The model combines nine distinct "washout" algorithms designed to identify moments of panic selling, capitulation, and bullish divergences.
- A systematic strategy based on the model's signals has historically produced strong returns, particularly over 6-12 month horizons.
The Composite Washout Model Components
Identifying the primary market trend is one of the most critical tasks for any trader or investor. The Tactical Composite Trend Model (TCTM) is the culmination of decades of professional trading and financial market research, designed to aid in this process. The TCTM utilizes a weight-of-the-evidence approach, combining seven key time-tested components to identify major market turning points. This report will focus on one of those key components: the Sentimentrader's New TCTM (S-TCTM) Composite Washout Model.
Bullish divergence signals play a crucial role in the Composite Washout Model. The model is designed to issue alerts when an index makes a new low, but participation in the decline-the number of stocks making new lows along with it-diminishes. This "non-confirmation" is a classic sign of seller exhaustion.
Component Descriptions
- 252-day Low Divergence
- 63-Day Low Divergence
- Breadth Washout
- Volume Washout
- Oversold Extreme
- Oversold Divergence
- 21-Day Low Divergence
- Bollinger Band Washout Reversal
- 10-Day Avg Return
Composite Washout Model Signal Criteria
- Condition = Composite Signal Count >= 33%.
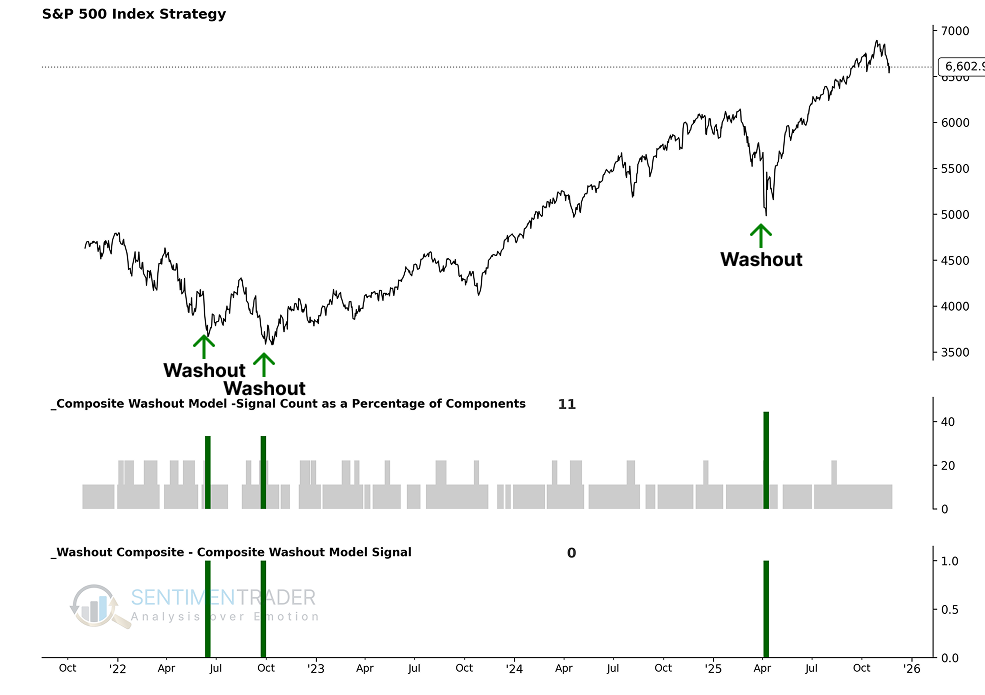
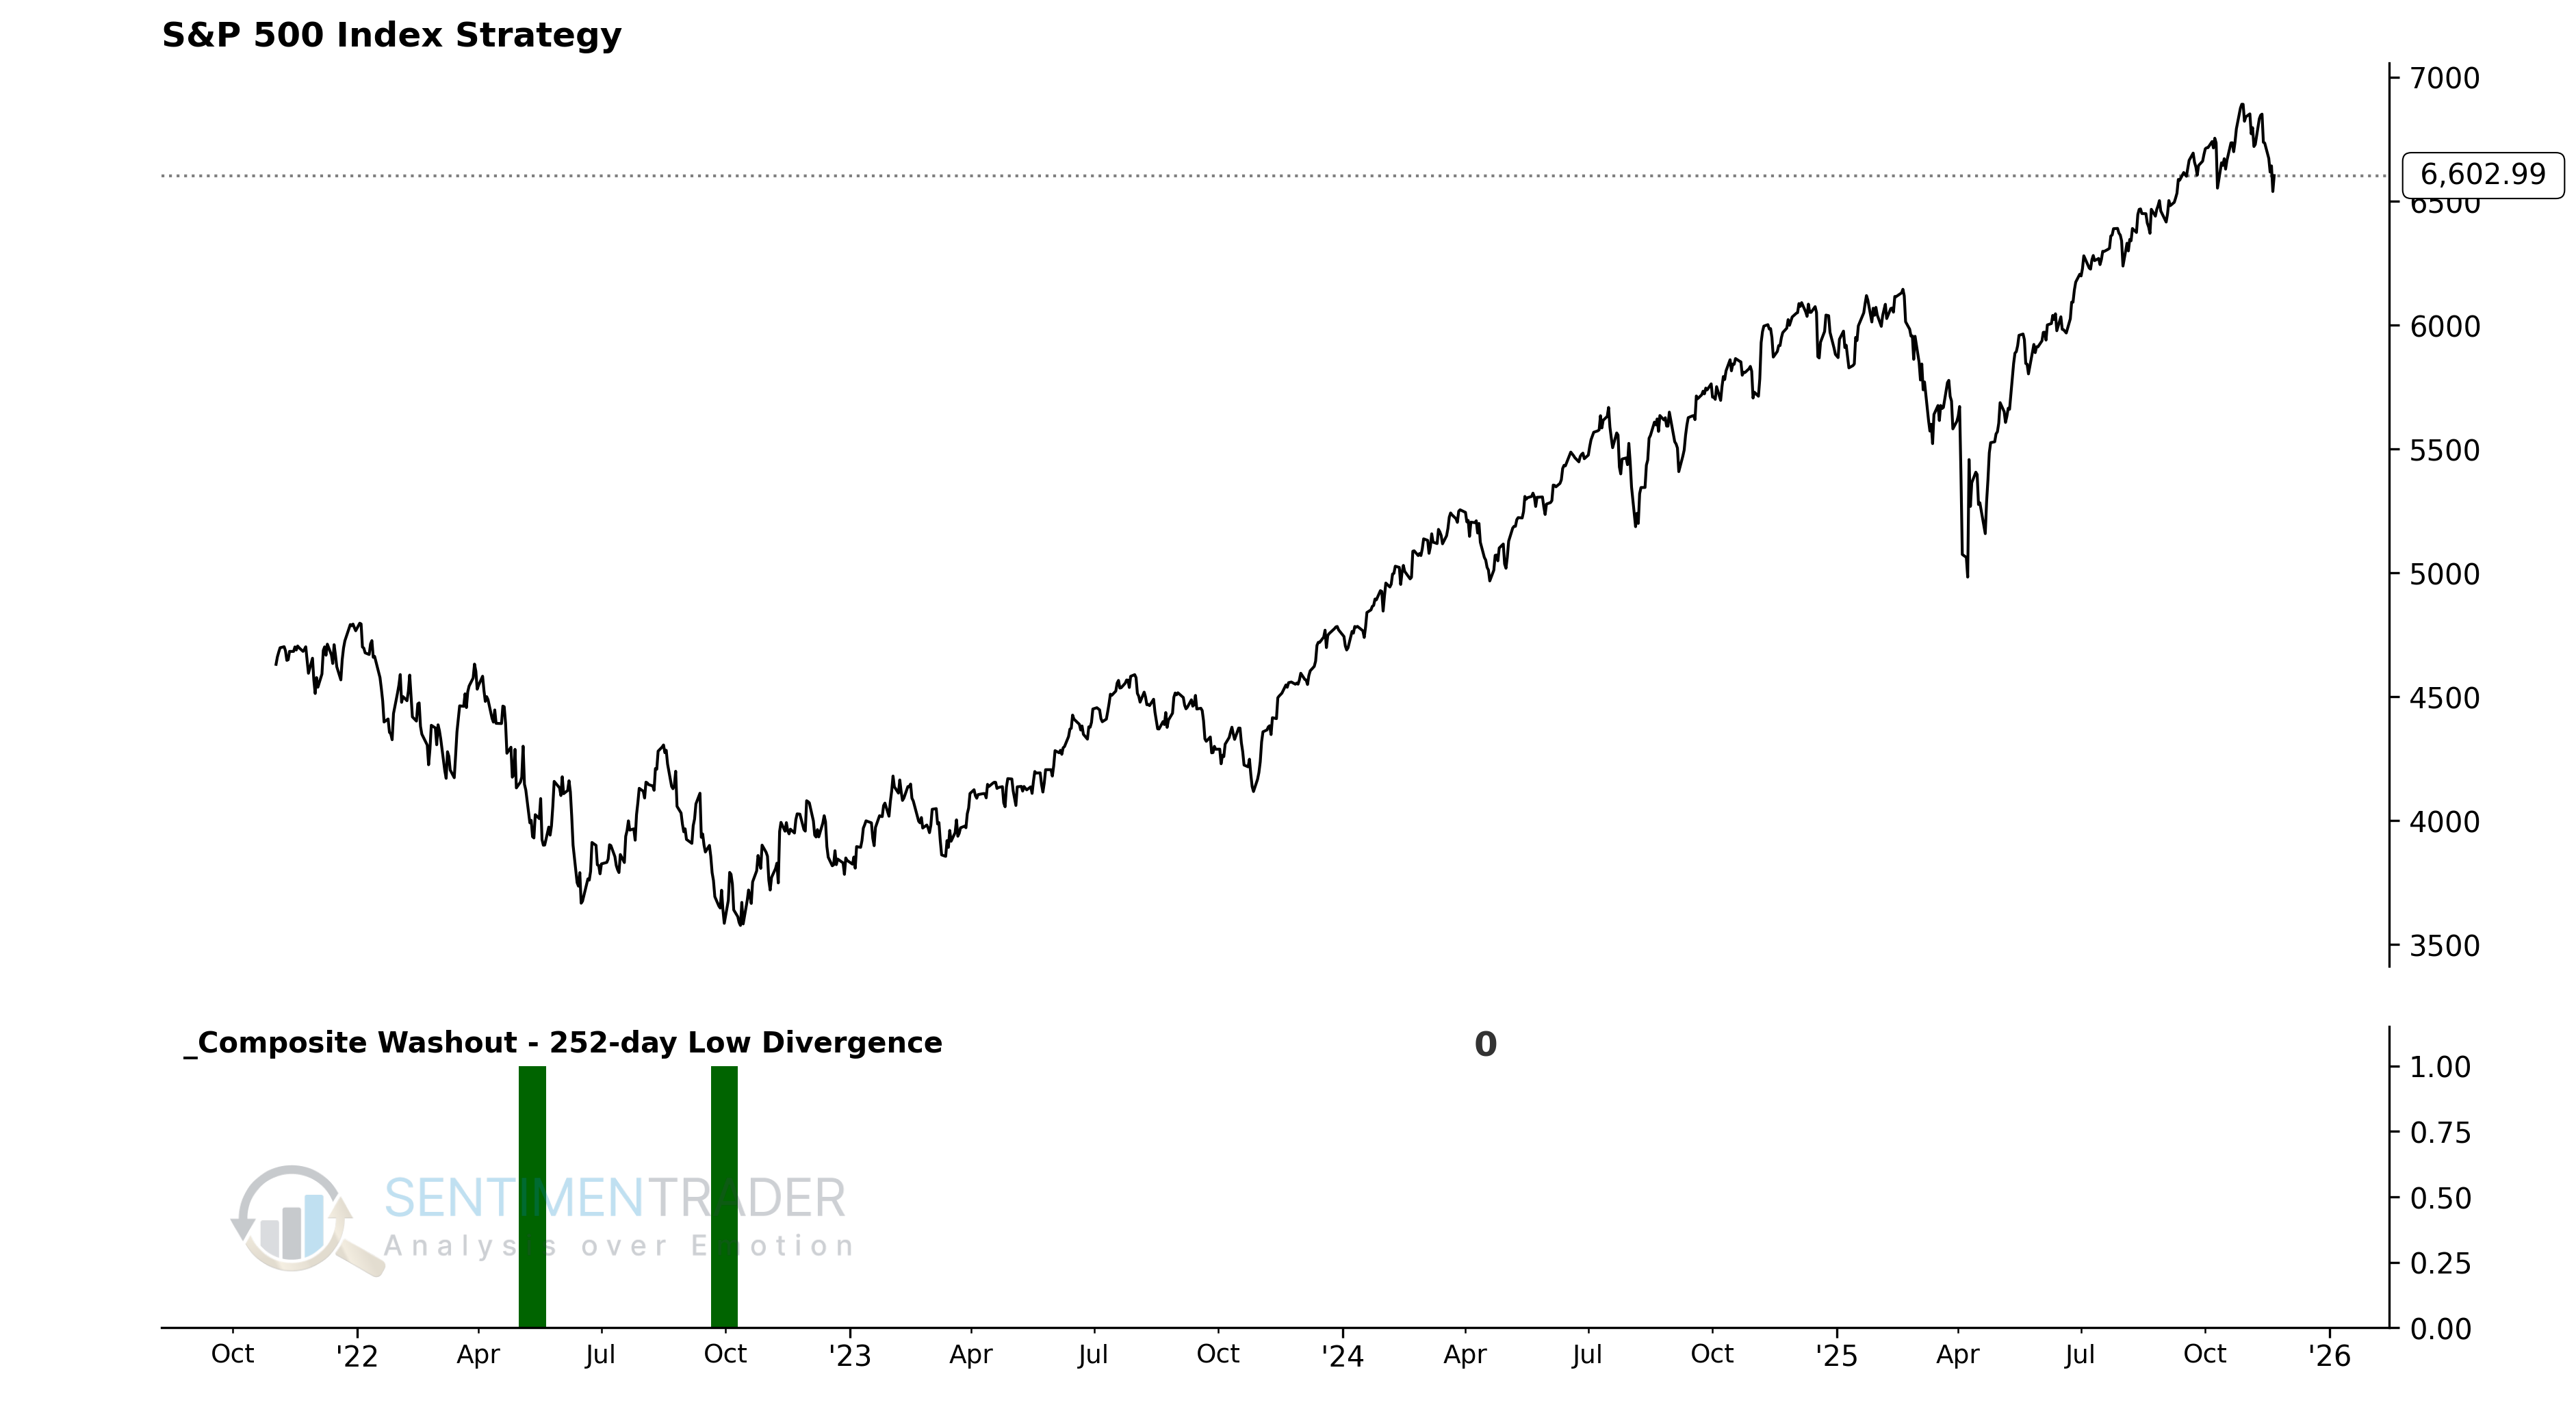
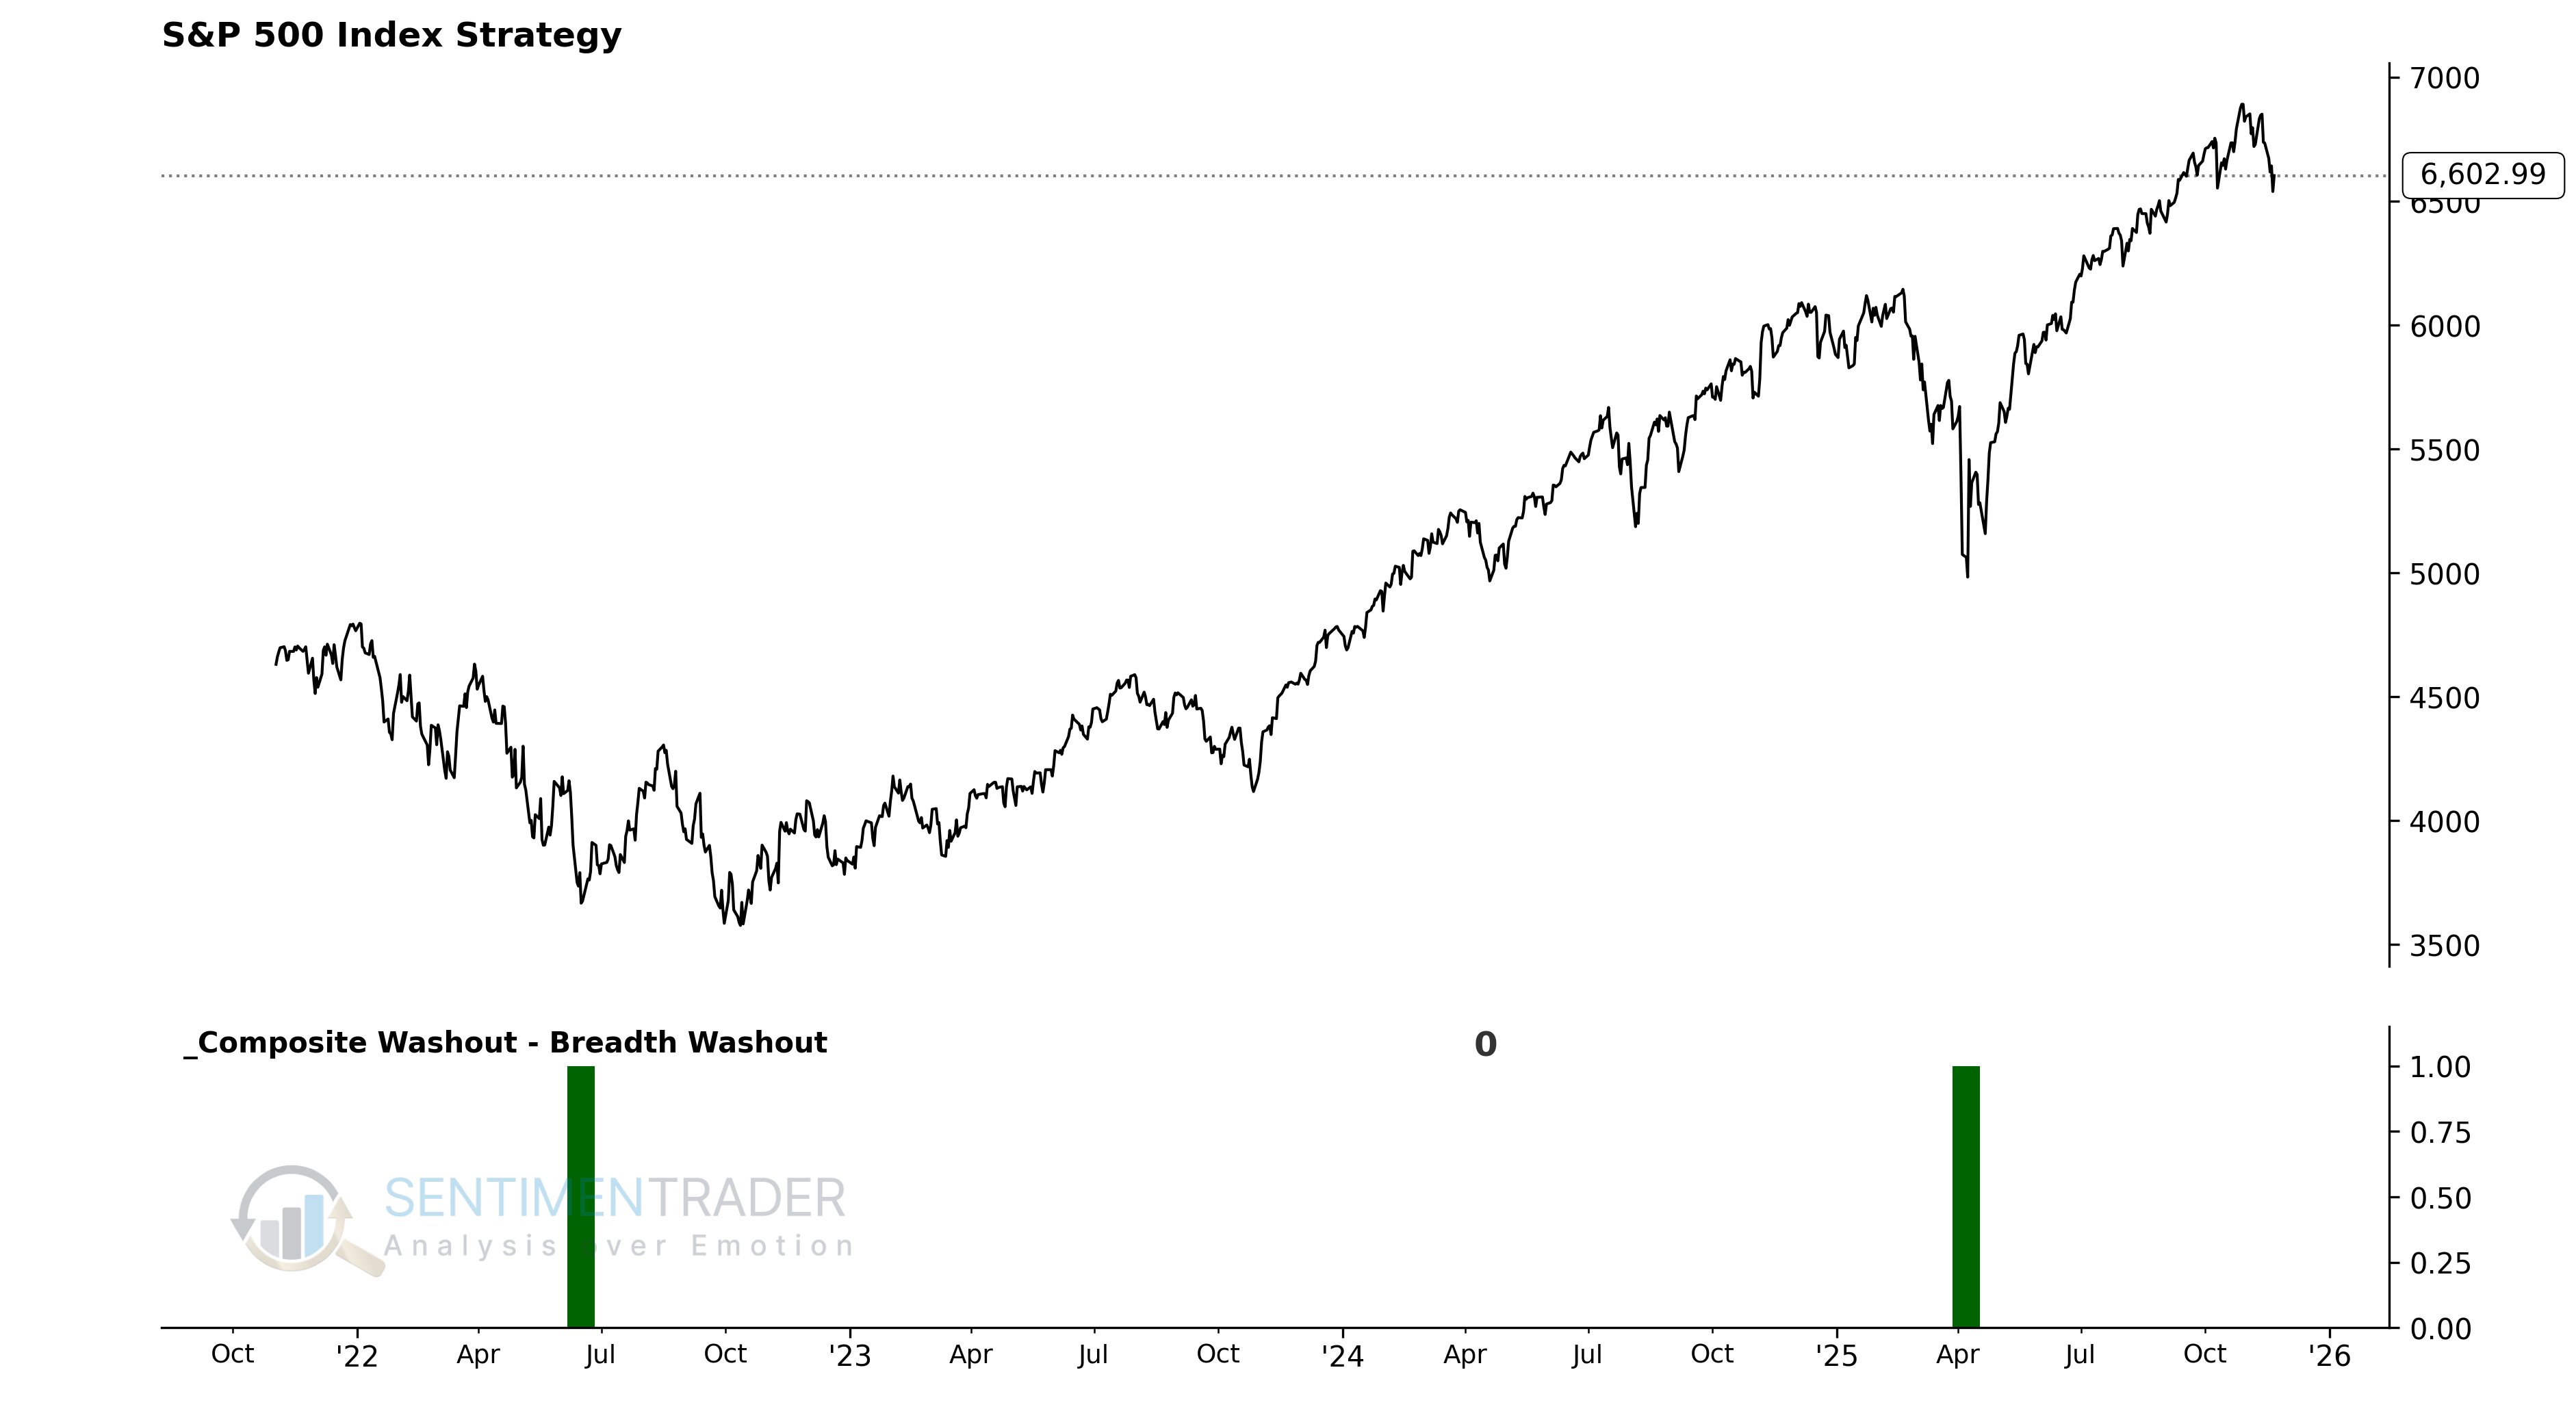
As the chart below illustrates, these individual components are combined into a single composite indicator-the Composite Washout Model-which uses a 0 or 1 value to issue alerts. Currently, the model shows a reading of 0, indicating no washout signal is active.
Utilizing the S-TCTM Composite Washout Model
The model's output allows us to define the market environment as "Favorable" or "Unfavorable" without subjective interpretation. Specifically:
- When the Composite Washout Model flips from 0 to 1, the primary trend is considered Favorable for stocks (signaling a potential bottom).
With this framework, we can construct a systematic trend-following strategy to see how this approach has performed historically.
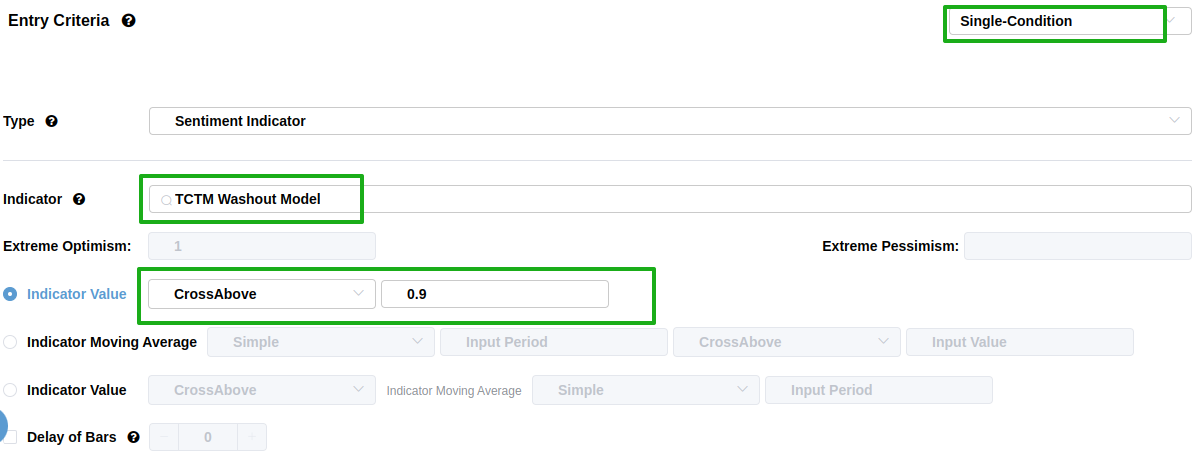
Using the Backtest Edge engine, we can set up the entry and exit criteria to follow the model's signals. The setup is straightforward:
The Entry Criteria are set for when the S-TCTM Composite Washout Model equals 1, initiating a long position when the trend becomes favorable.
For related backtest, click here.
We can skip setting an explicit exit for this test, as we are primarily interested in the forward returns after the signal triggers.
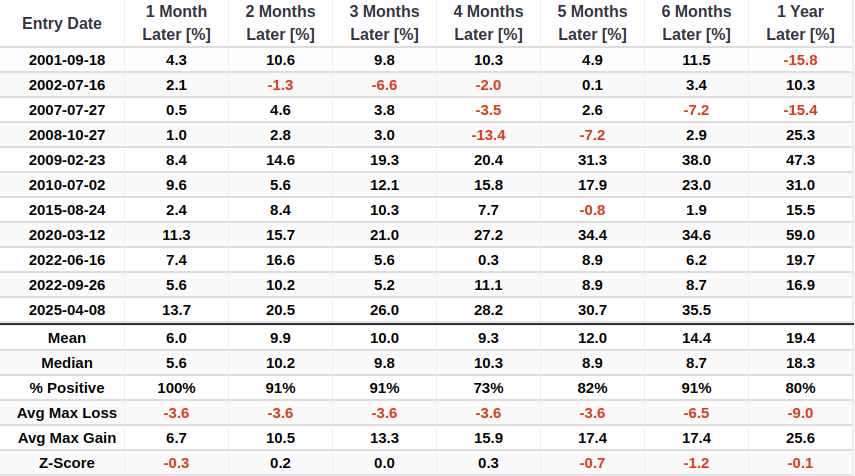
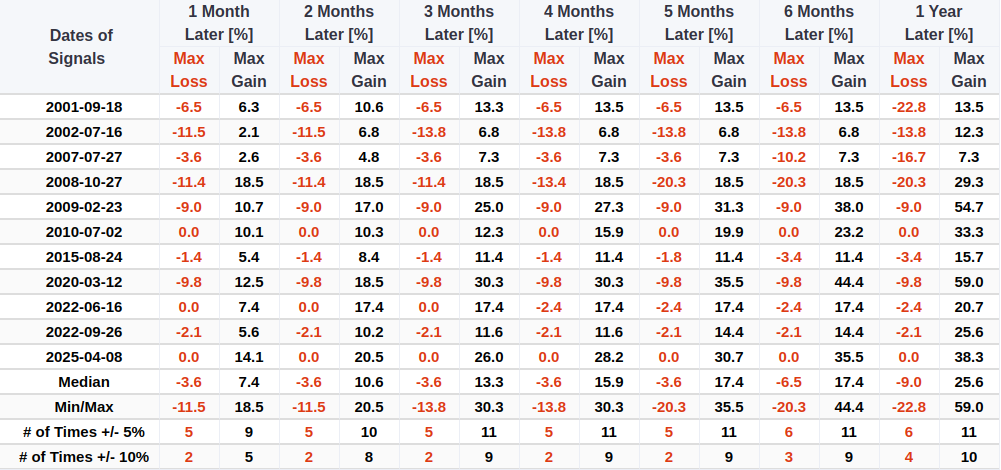
Historical backtesting demonstrates its ability to accurately identify major market bottoms (such as in 2008, 2020, and 2022). Furthermore, as holding periods extend-particularly from 6 months to 1 year-potential returns significantly exceed downside risk (high profit-to-loss ratio).
Component Deep Dive
252-day Low Divergence
The 252-day Low Divergence indicator utilizes the internal market structure when price hits a 52-week low to identify potential market bottoms or reversals following panic selling.
Components
Percentage of SPY stocks making 52-week lows.
252-Day New Low Divergence/Washout Model
This model aims to identify moments when the index hits a 252-day low while market sentiment is in one of two extremes: either selling pressure persists but internal structure improves (bullish divergence), or the market enters extreme panic (washout). It uses state-machine logic to issue a signal if either of the following path conditions is met.
Signal Criteria #1
- Condition 1 = Breadth indicator was previously in a high-stress zone (> 20).
- Condition 2 = Breadth indicator falls back to a low zone (< 20).
- Condition 3 = S&P 500 closes at a 252-day low.
- If Conditions 1-3 are met, a Washout Model signal is issued.
Signal Criteria #2
- Condition 1 = Breadth indicator is at an extreme high (> 60).
- Condition 2 = S&P 500 closes at a 252-day low.
- If Conditions 1-2 are met, a Washout Model signal is issued.
Current Day Chart
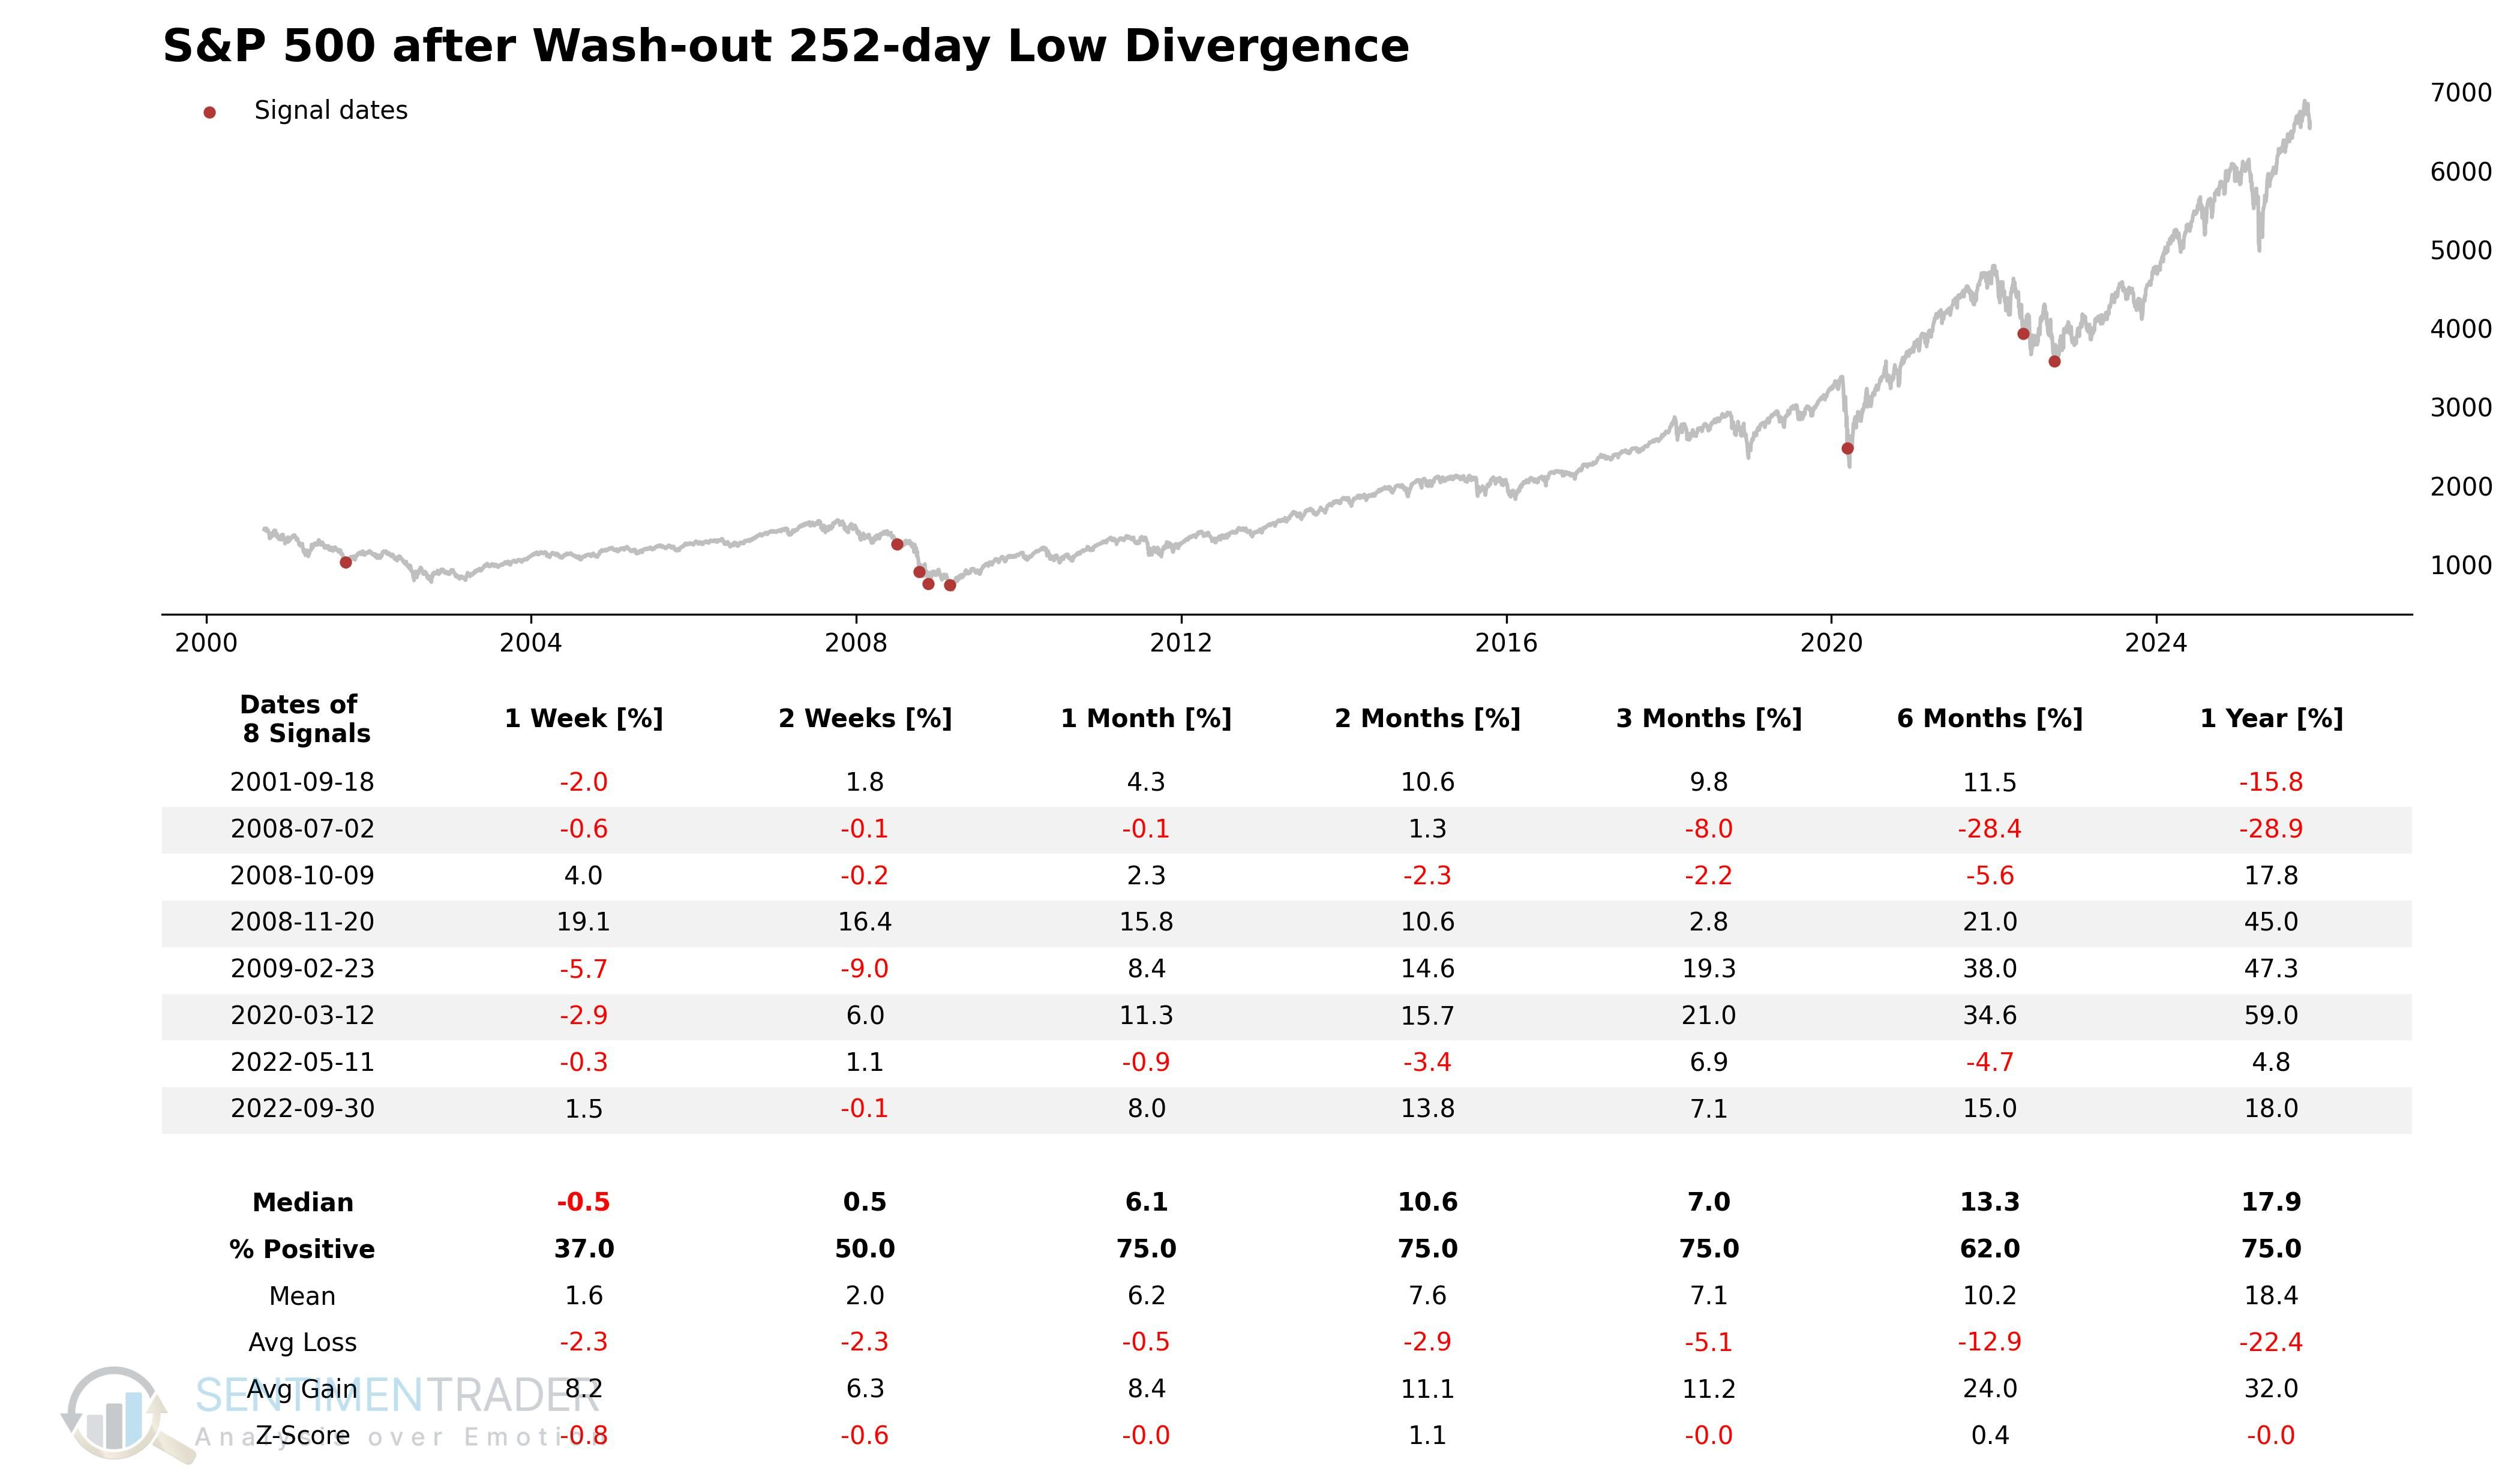
Signal Performance
The signal has demonstrated a solid win rate over the 1-12 month time frame.
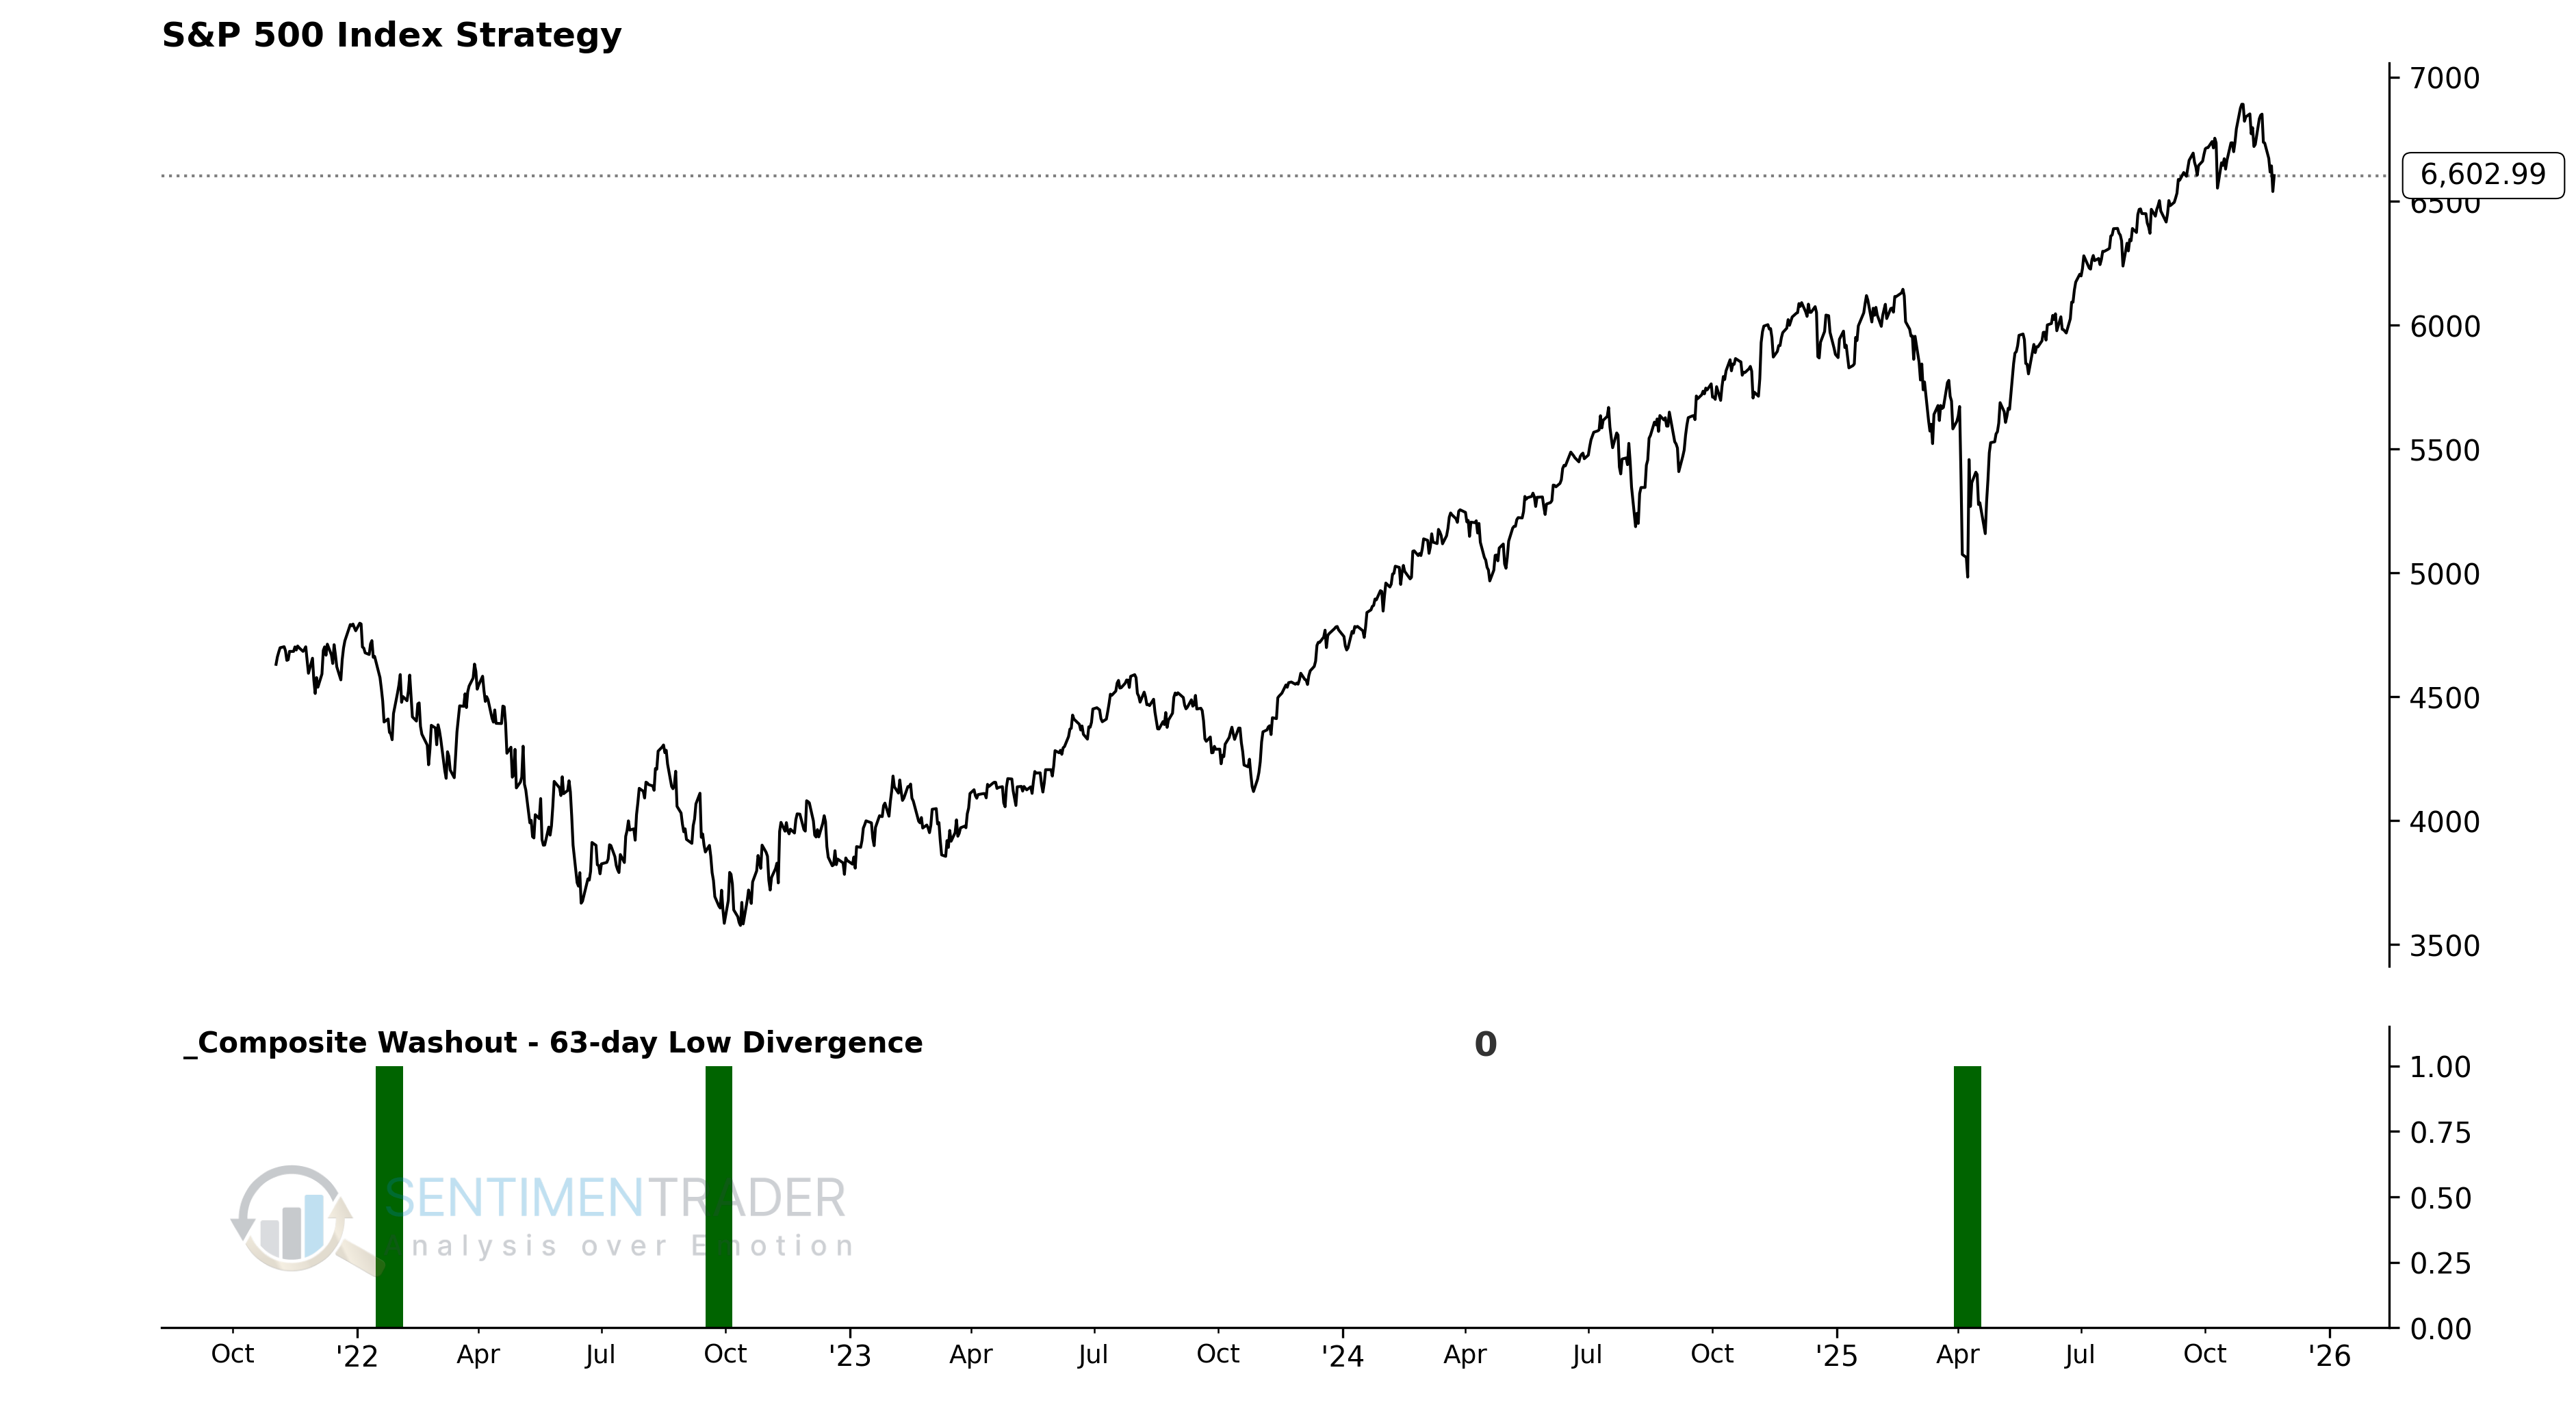
63-Day Low Divergence
The 63-Day Low Divergence indicator uses market internals when price hits a quarterly (63-day) low to identify bottoms of intermediate-term corrections or swing trading reversal opportunities.
Components
Percentage of SPY stocks making 52-week lows.
63-Day New Low Divergence Model
This model identifies moments when the index hits a 63-day low, but selling pressure, after peaking, has begun to significantly subside. Unlike the long-term model, this focuses purely on "bullish divergence" logic: price makes a new low due to inertia, but internal deterioration has stopped.
Signal Criteria
- Condition 1 = Breadth indicator was previously in a high-stress zone (> 40).
- Condition 2 = Breadth indicator falls back to the observation zone (< 40).
- Condition 3 = S&P 500 closes at a 63-day low.
- If Conditions 1-3 are met, a divergence signal is issued.
Current Day Chart
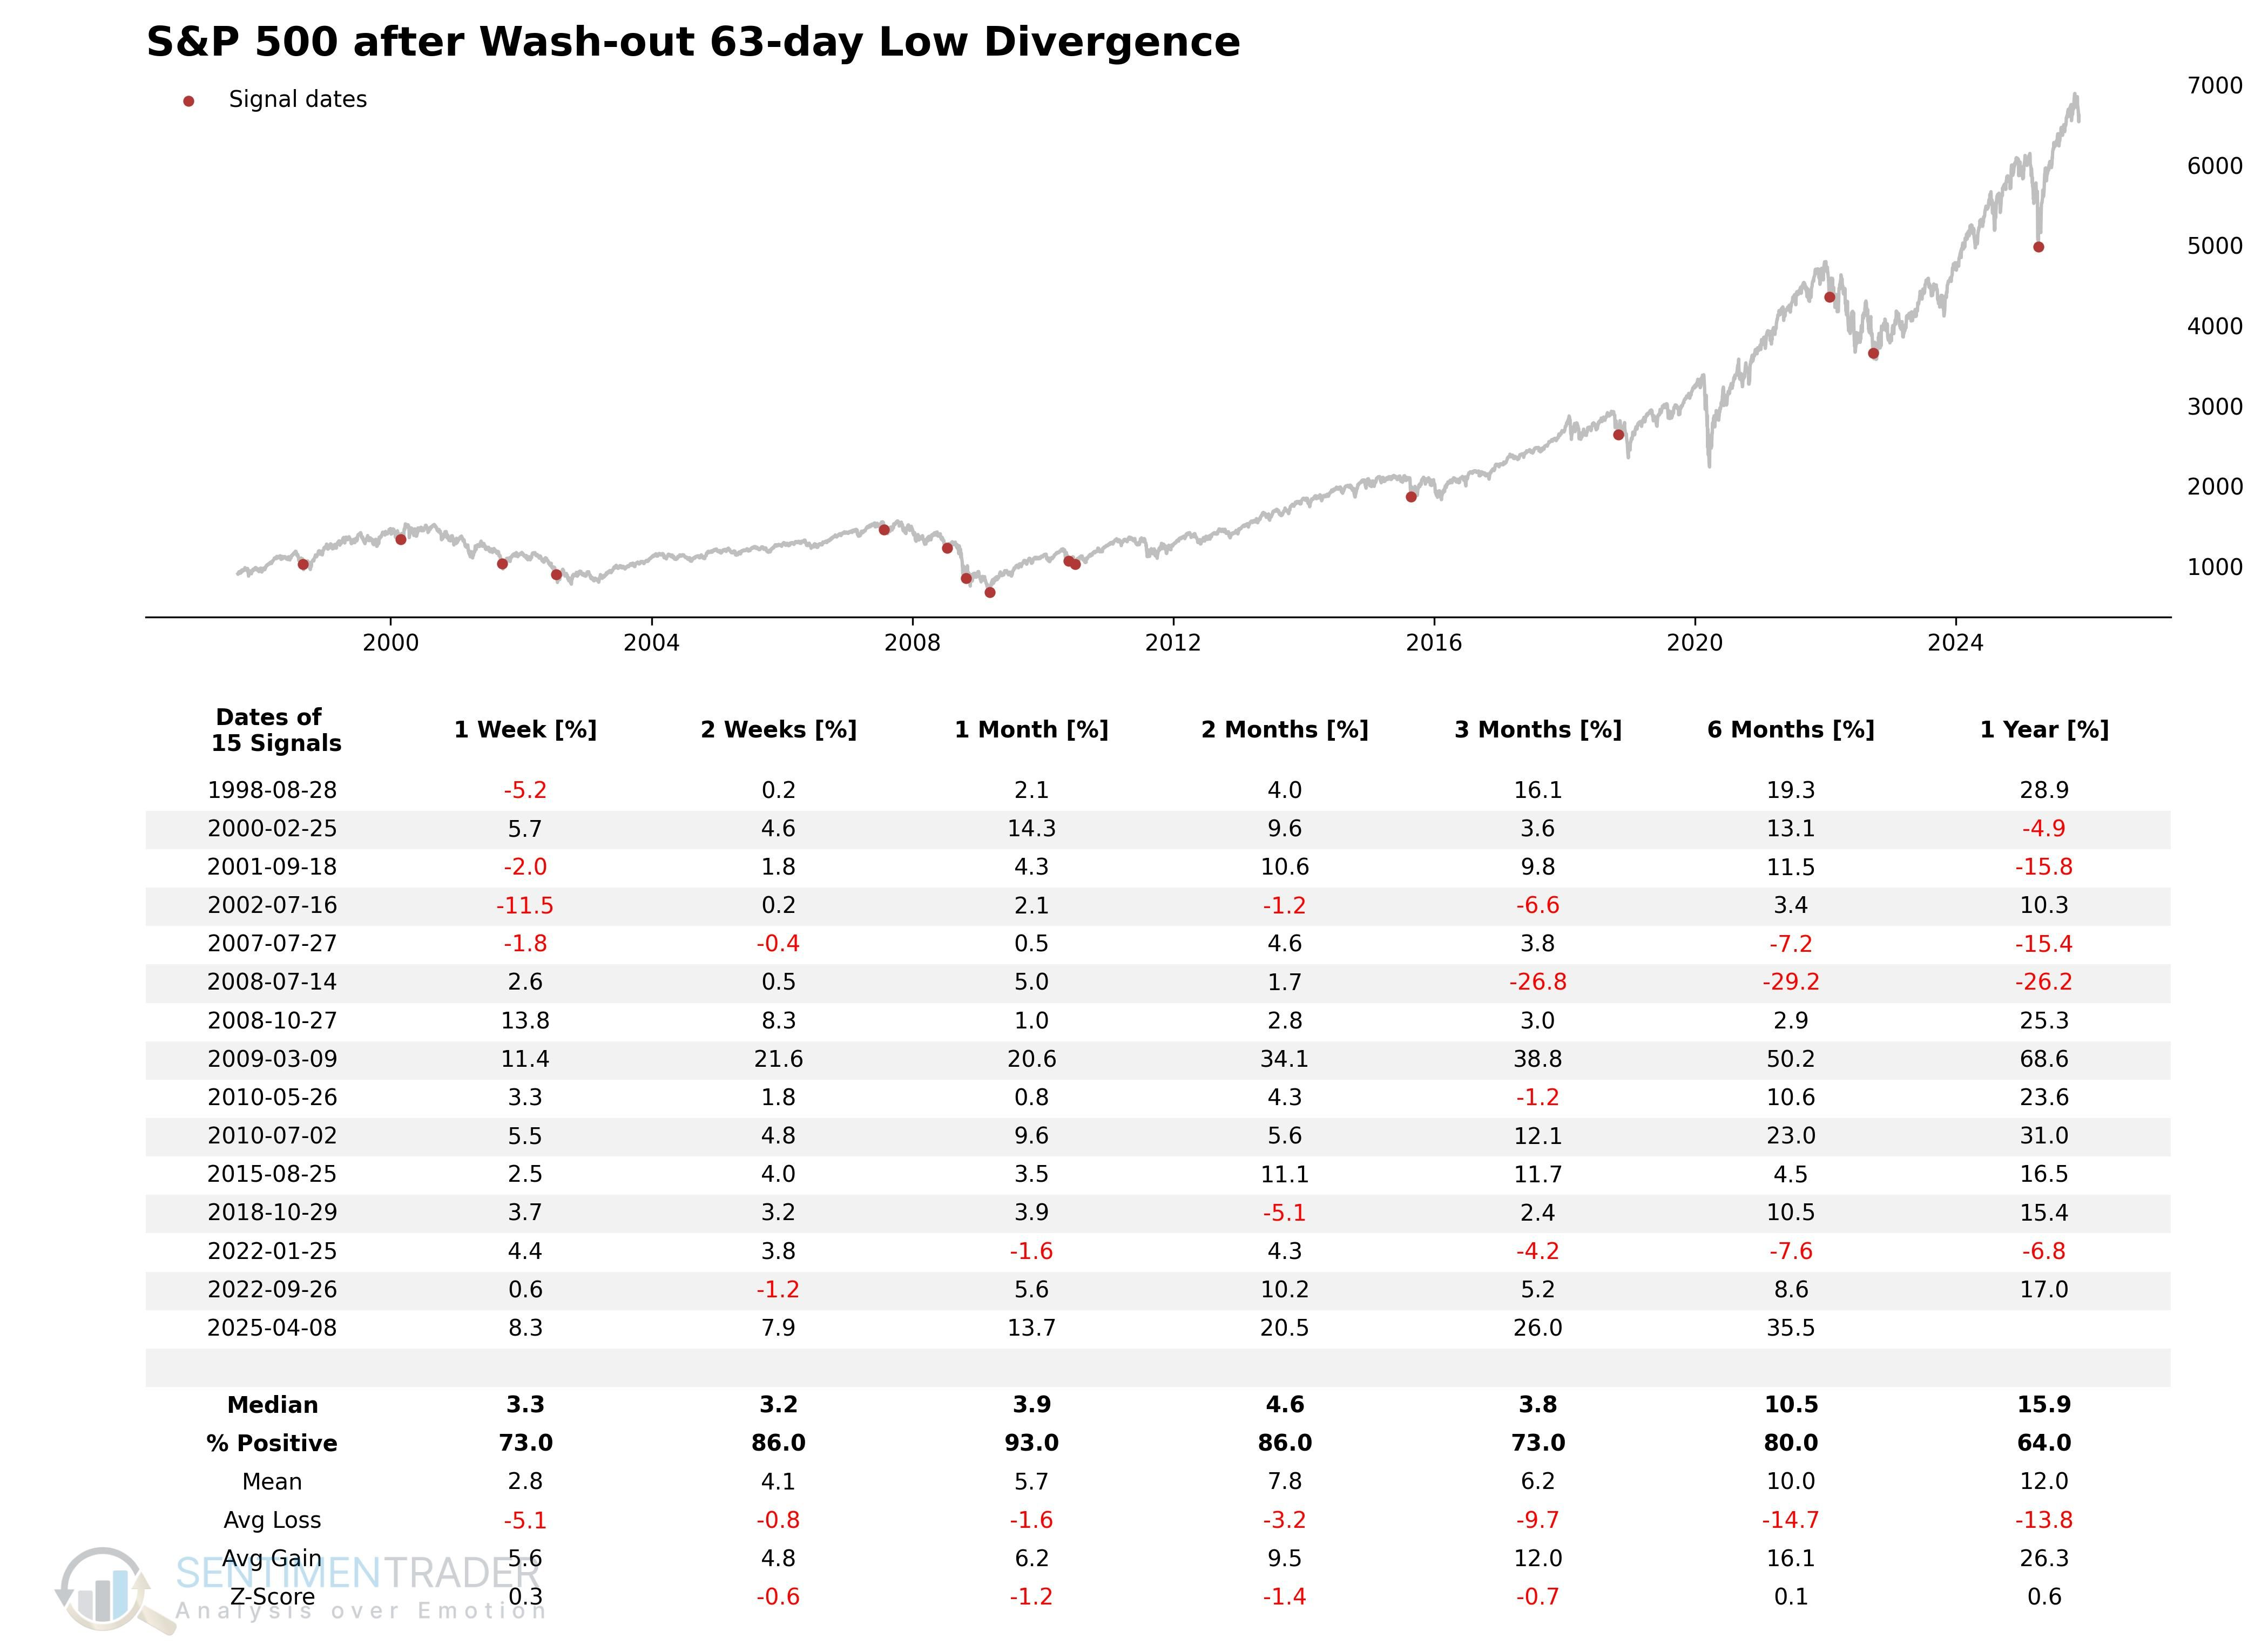
Signal Performance
As seen in the chart, performance is strong across all timeframes, particularly over the one-month period.
Breadth Washout
The Breadth Washout indicator uses six different dimensions of market breadth data (covering short, medium, and long terms) to calculate a comprehensive market health score. It aims to identify moments of synchronized panic selling (capitulation) across all timeframes.
Components
- Percentage of issues above the 10-day moving average
- Percentage of issues above the 50-day moving average
- Percentage of issues above the 200-day moving average
- Percentage Spread Between 21-Day Highs and Lows
- Percentage Spread Between 63-Day Highs and Lows
- Percentage Spread Between 252-Day Highs and Lows
Composite Breadth Washout Model
This model first calculates the "Net New High Spread" (New Highs minus New Lows) for three different periods. It then adds these spreads to the three moving average breadth indicators and averages them to derive a "Breadth Washout Value." This value reflects the overall water level of the market. When it drops below -25, it indicates that the market is under severe selling pressure not just in the short term, but across its medium and long-term structure-often marking a zone of irrational, extreme panic.
Signal Criteria
- Condition 1 = Yesterday's Breadth Washout Value >= -25.
- Condition 2 = Today's Breadth Washout Value < -25.
- If Conditions 1-2 are met (a cross below -25), a Breadth Washout signal is issued.
Current Day Chart
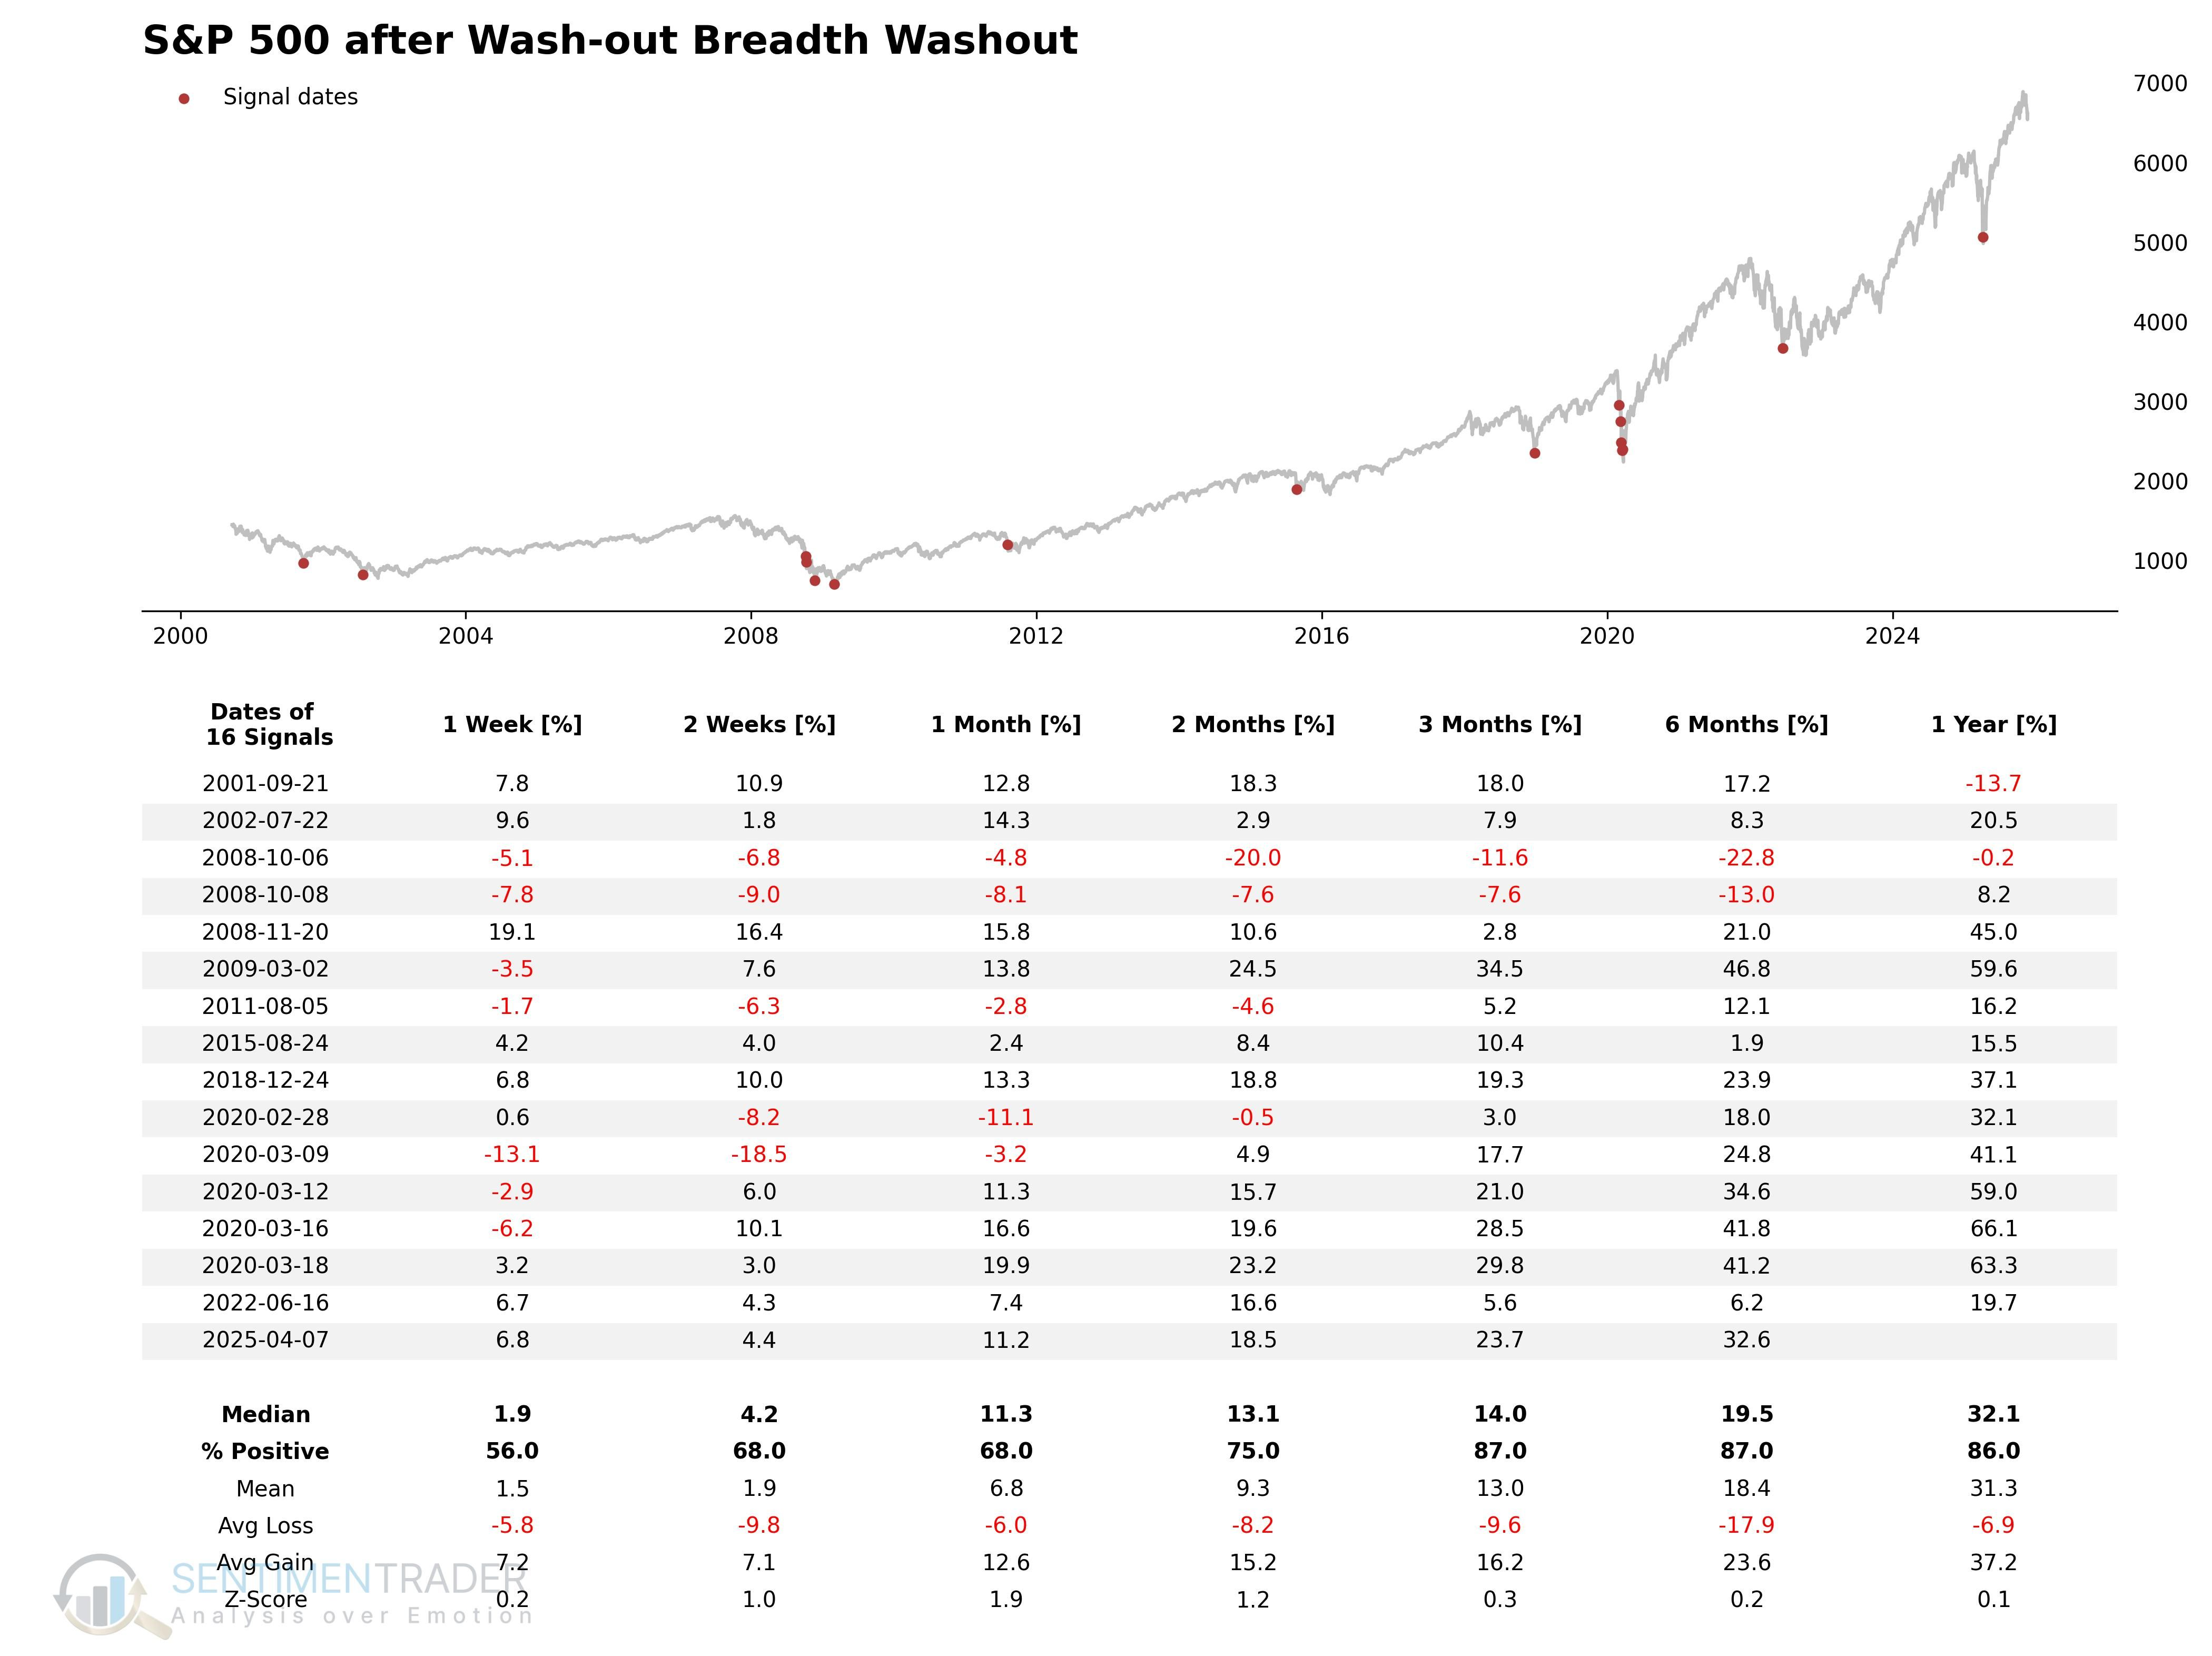
Signal Performance
As shown, the signal has historically preceded positive performance over the 2-12 month time frames.
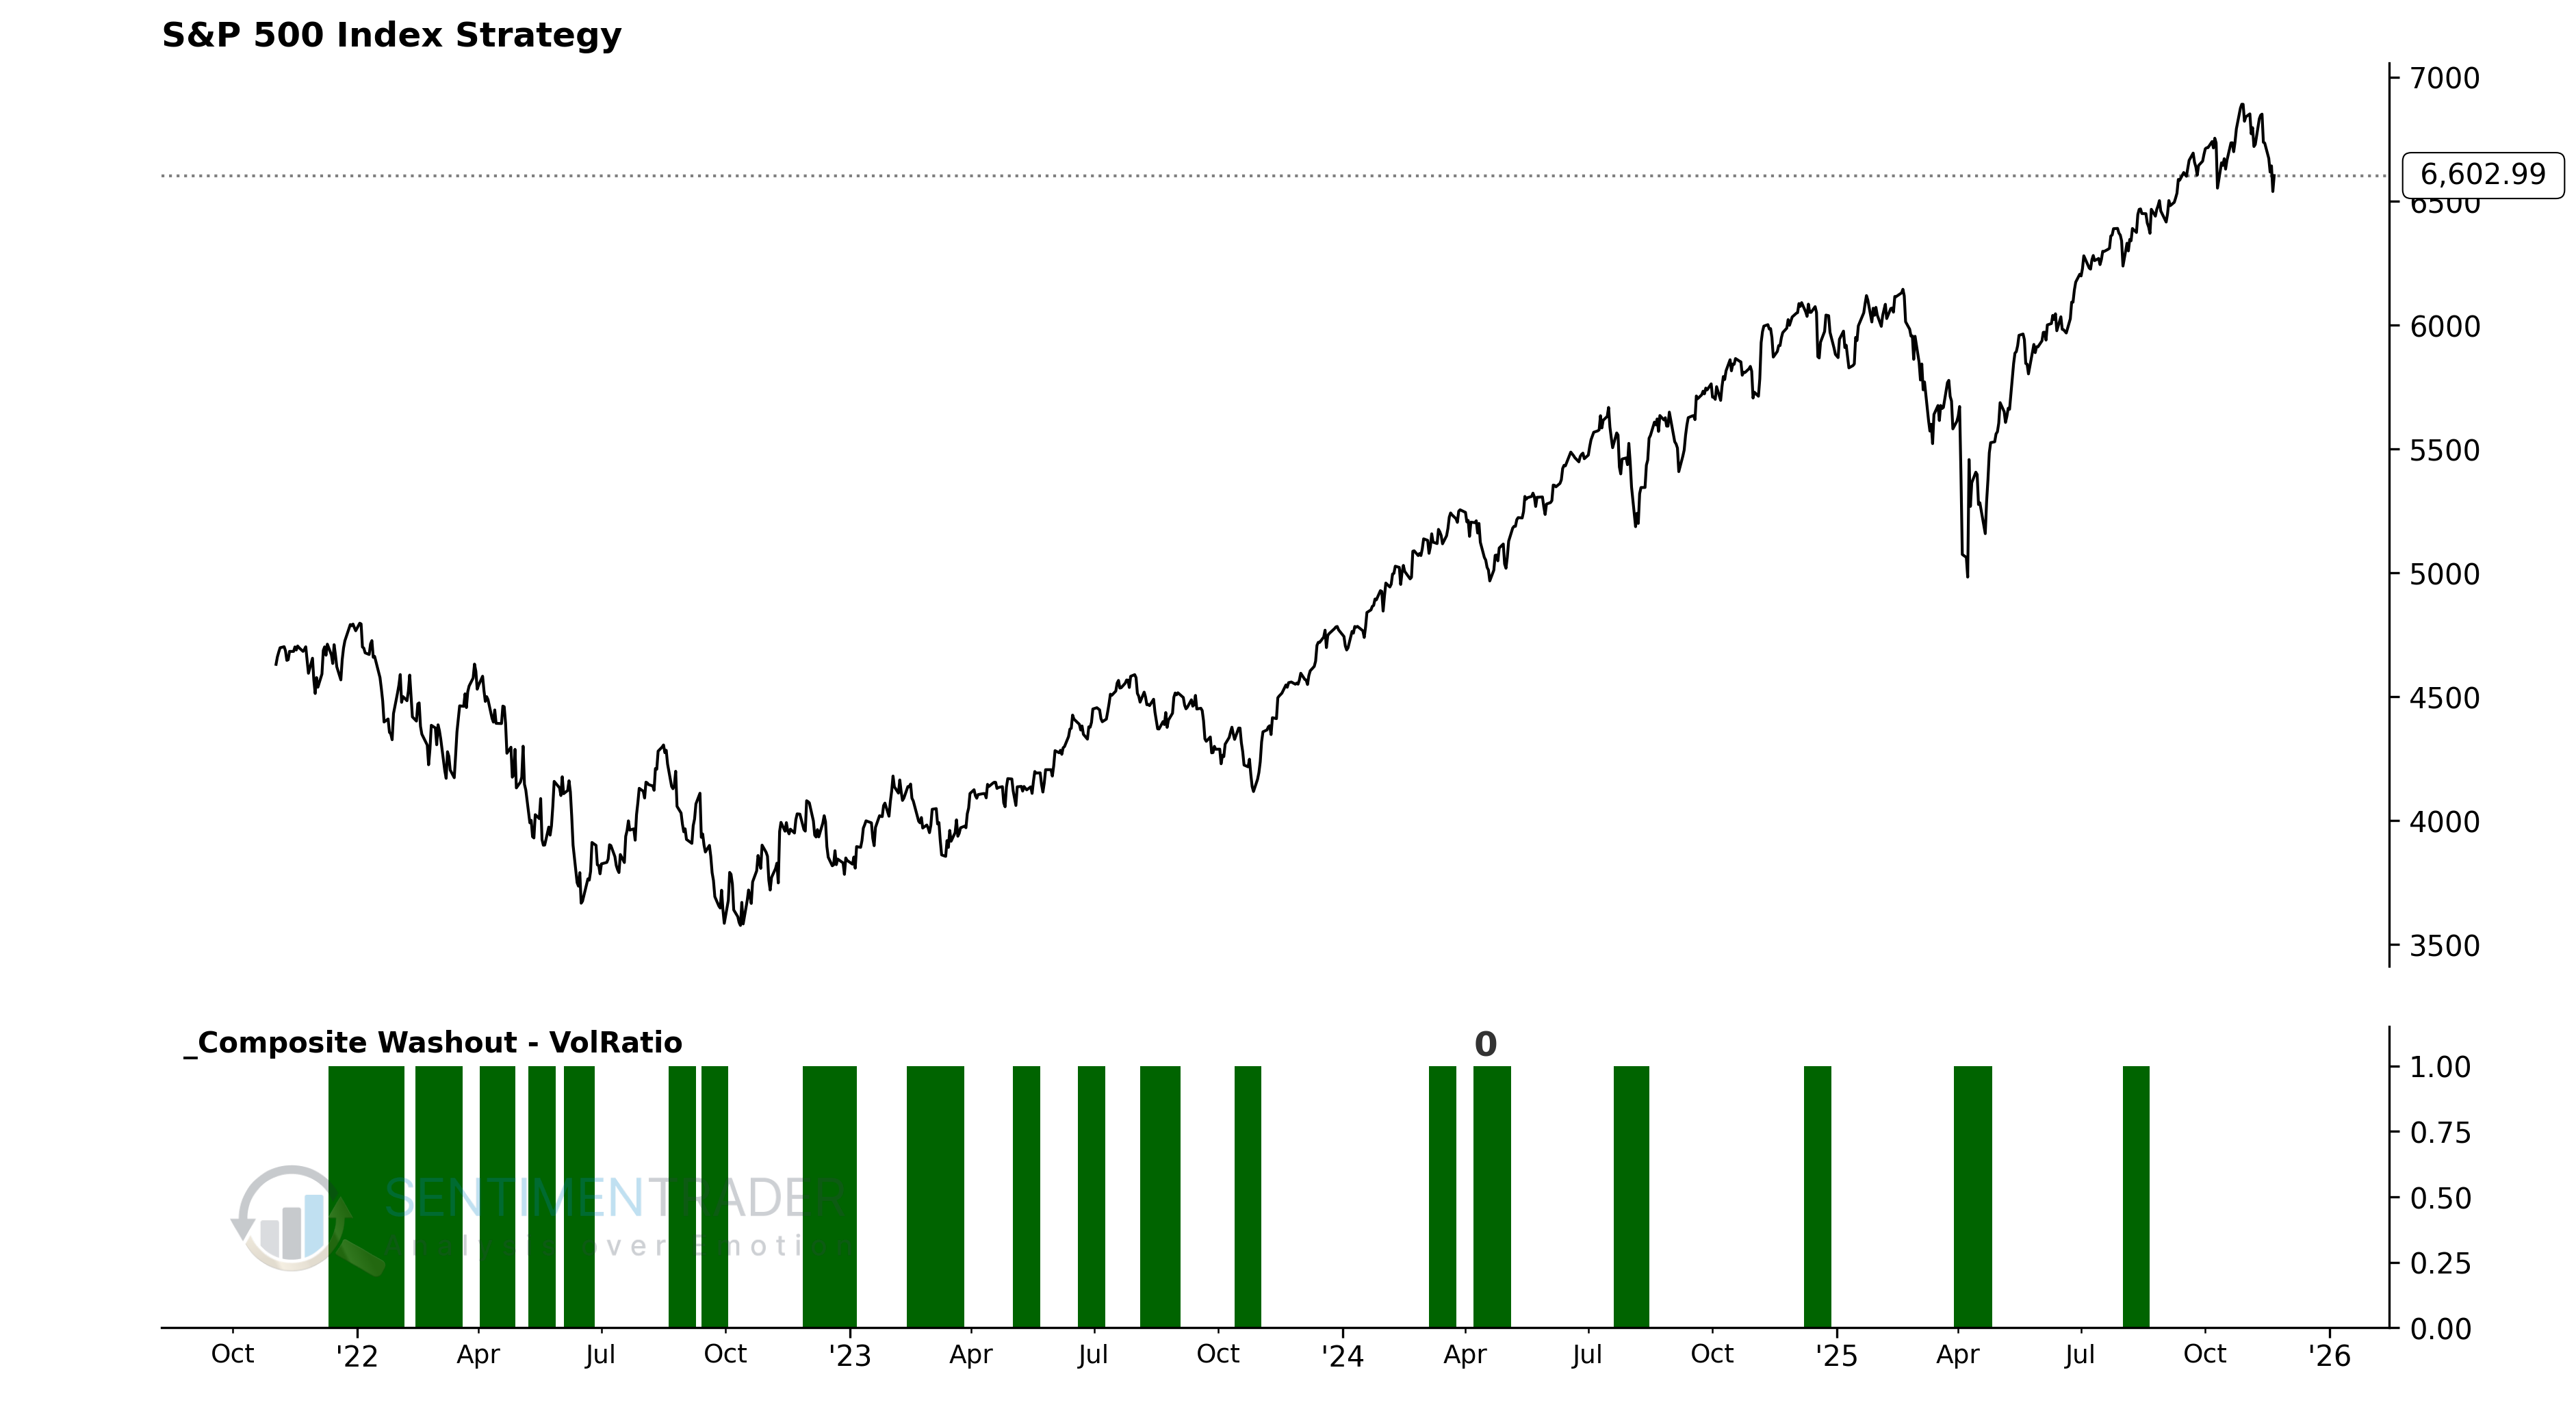
Volume Washout
The 10-Day Volume Ratio indicator compares the volume on up-days versus down-days over the past 10 trading sessions. It is used to gauge extreme imbalances in short-term sentiment, specifically identifying the climax of panic selling.
Components
- 10-day Sum of Up Volume
- 10-day Sum of Down Volume
Volume Ratio Washout Model
This model aims to quantify the intensity of selling pressure relative to buying pressure. By calculating the ratio of Up Volume to Down Volume, we can see who is in control. When this ratio drops below 0.45, it means that over the past two weeks, volume on down days has been more than double that of up days. Such extreme volume imbalances typically mark "capitulation"-a mass exodus of panic sellers-which is often a characteristic of a short-term bottom.
Signal Criteria
- Condition 1 = Yesterday's 10-Day Volume Ratio (VolRatio) >= 0.45.
- Condition 2 = Today's 10-Day Volume Ratio (VolRatio) < 0.45.
- If Conditions 1-2 are met (a cross below 0.45), a Volume Washout signal is issued.
Current Day Chart
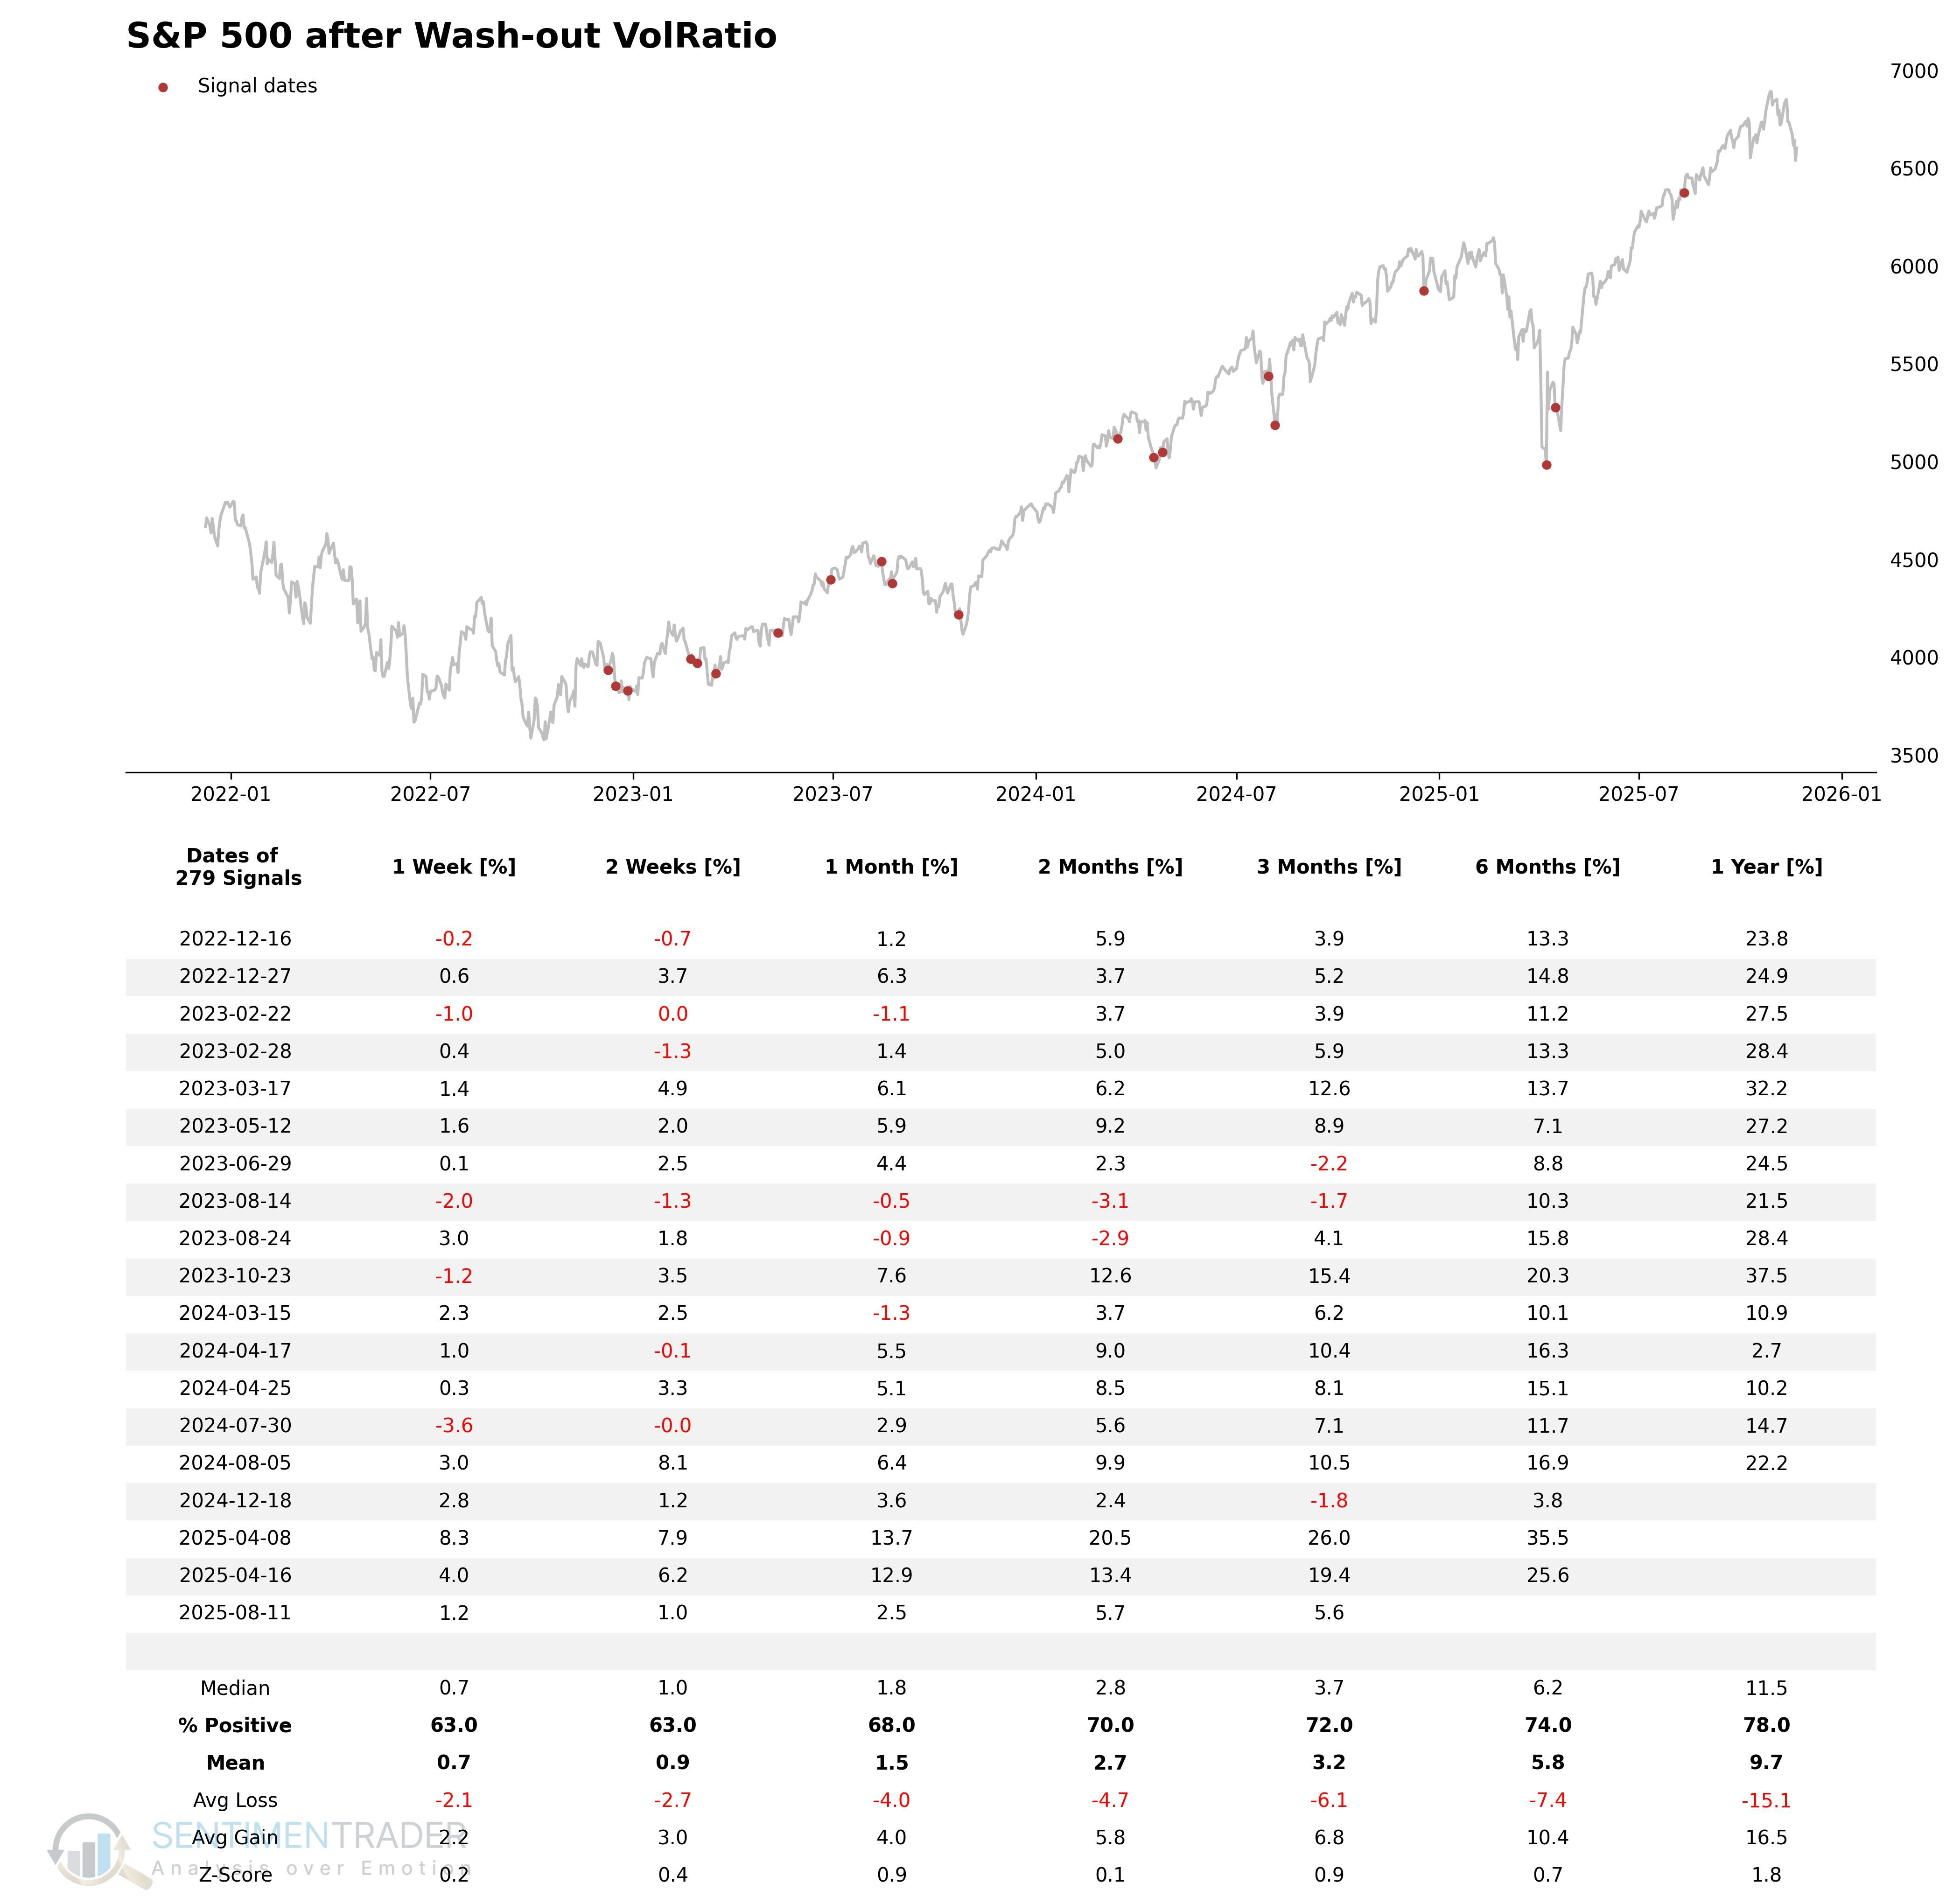
Signal Performance
As seen in the chart, the win rate tends to increase as the holding period extends.
What the research tells us...
The S-TCTM Composite Washout Model is a sophisticated, 'weight-of-the-evidence' tool designed to identify major market lows. By combining nine distinct algorithms-ranging from breadth divergences to volume capitulations-it filters out noise and zeroes in on moments of extreme seller exhaustion.
In this report, we've examined the first set of components, including the 252-Day and 63-Day Low Divergence models, as well as the Breadth and Volume Washout indicators. Each of these individual components has a strong historical track record of identifying bottoms. When combined into the composite model, they provide a robust signal. As the historical backtest shows, buying when the Composite Washout Model triggers (flips to 1) has historically offered an excellent risk/reward profile, with significant upside potential over the subsequent 6 to 12 months.