
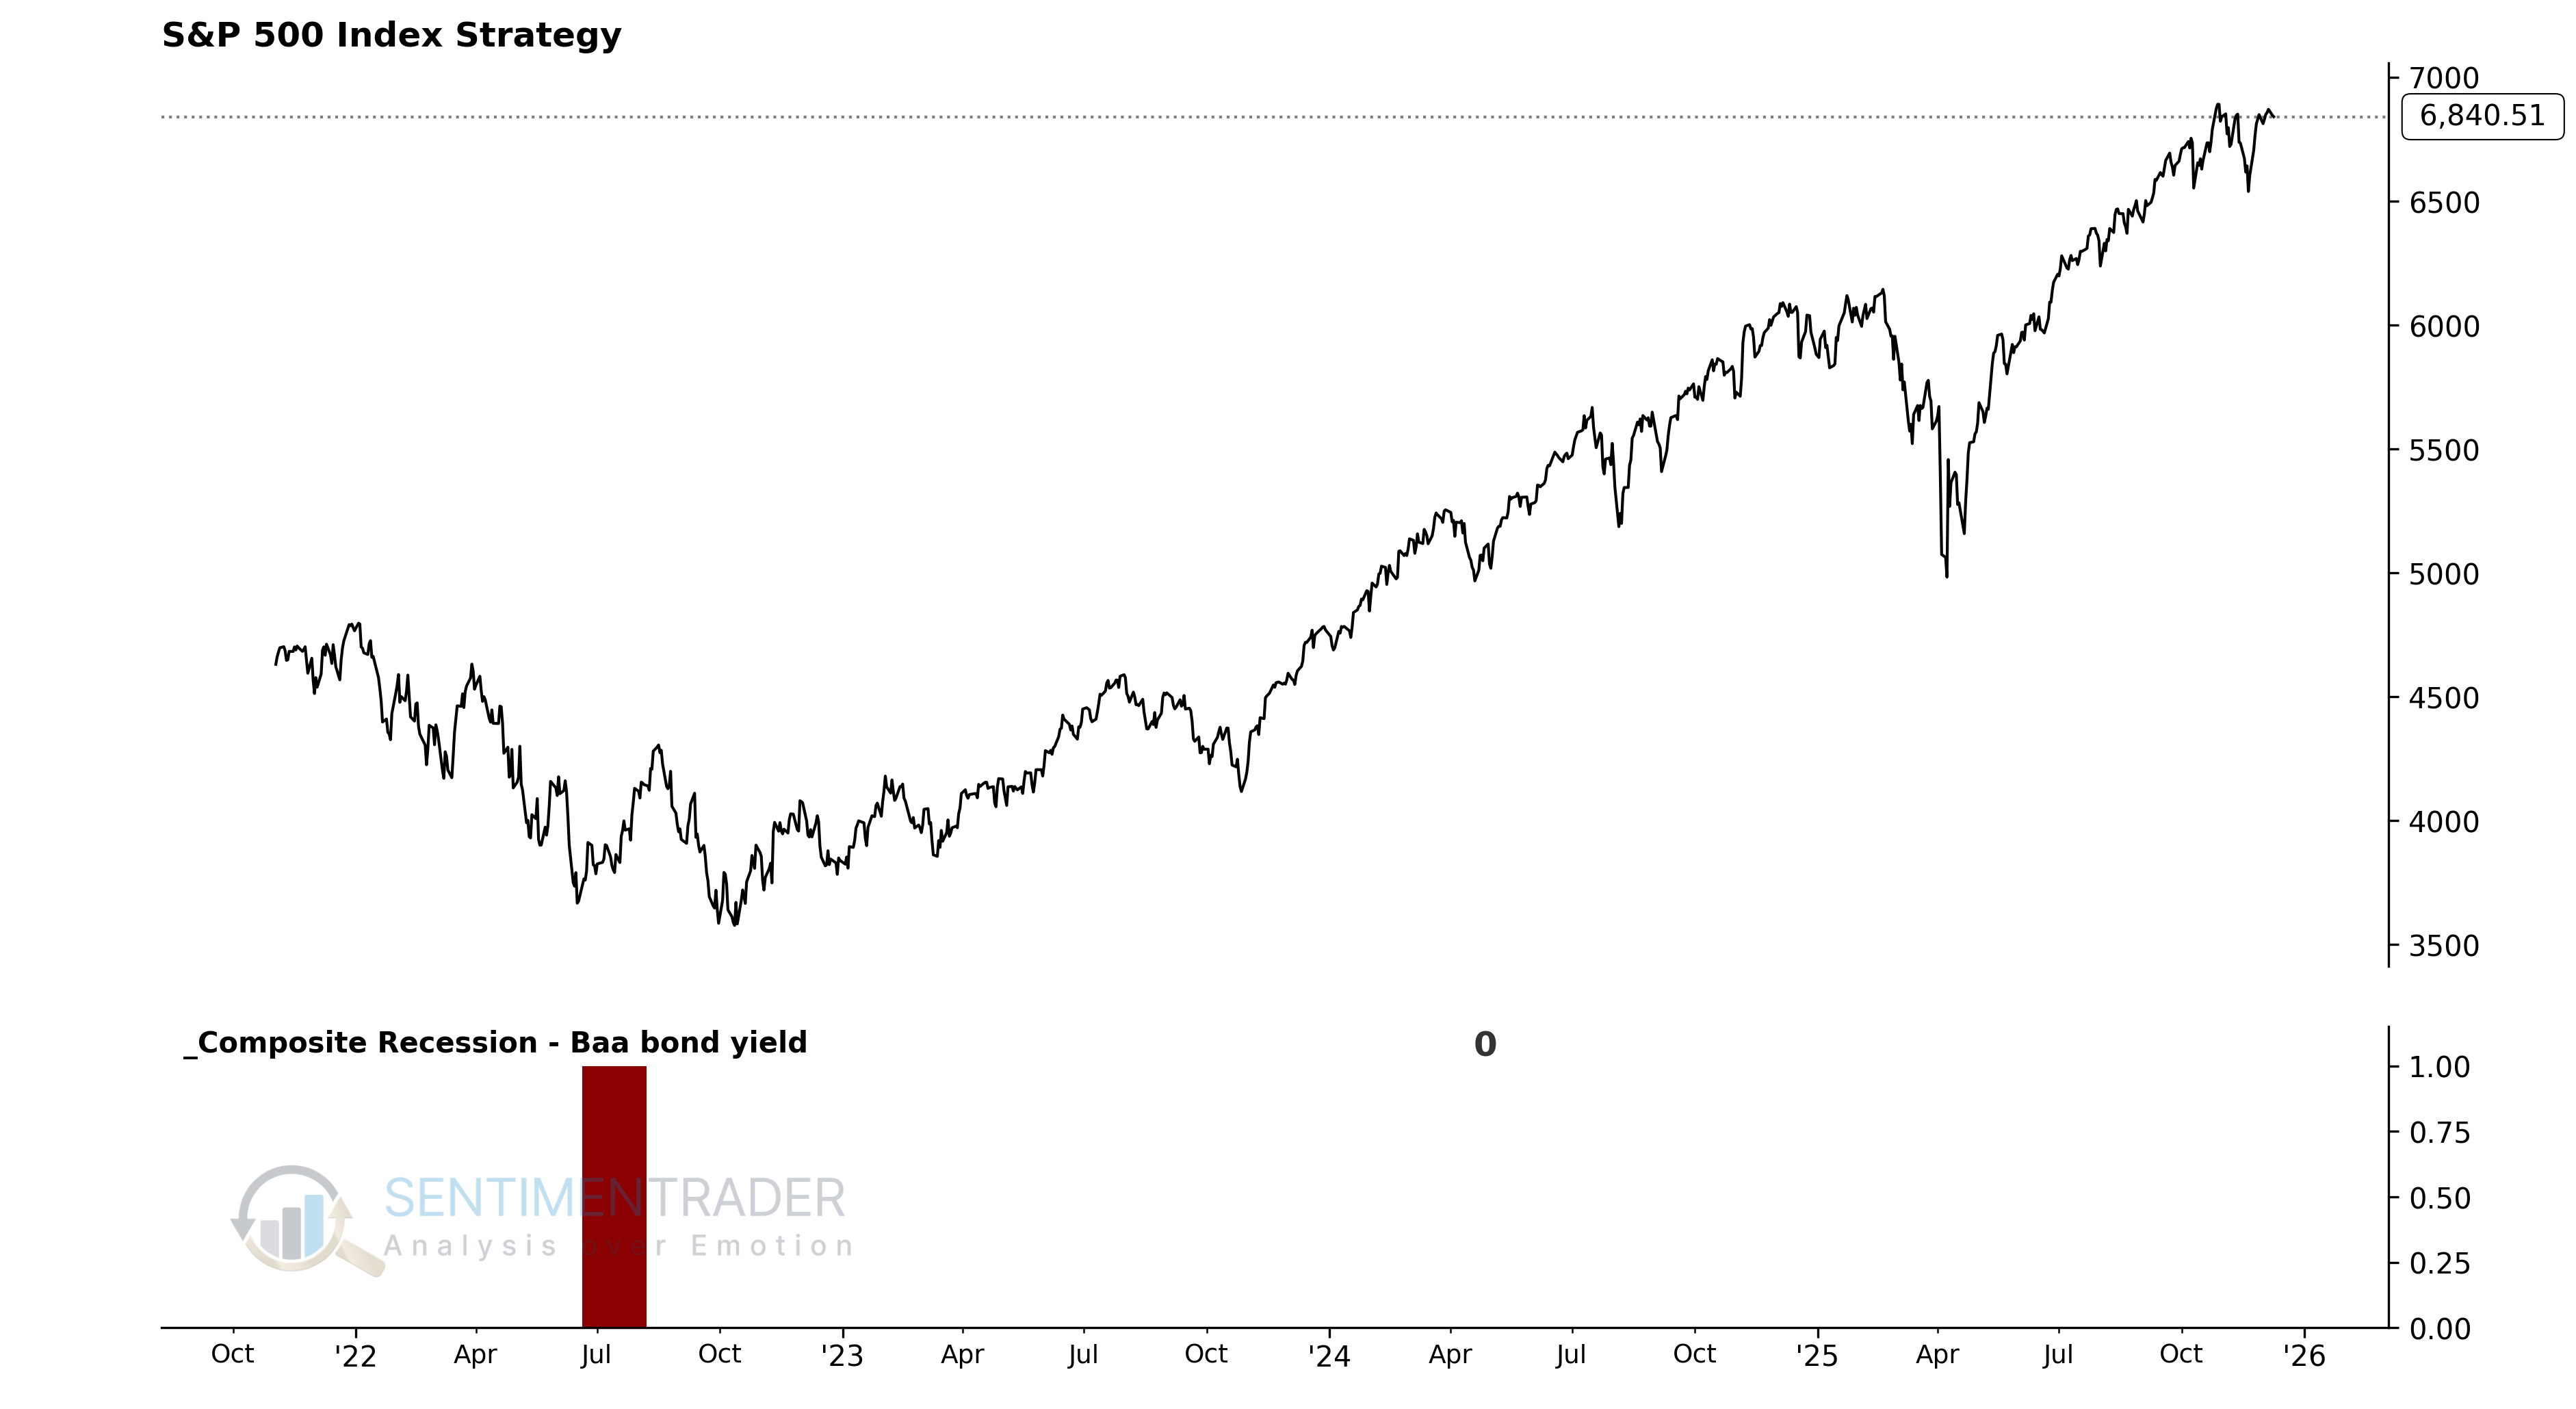
An In-Depth Look at the Sentimentrader's New TCTM Composite Recession Model

Key points
- The S-TCTM Composite Recession Model aggregates data from 8 key economic indicators-ranging from heavy truck sales to corporate bond yields and jobless claims-to identify recessionary risks.
- A composite signal is triggered when 75% or more of the components confirm a deteriorating economic environment.
- Historically, signals from the individual components have often preceded periods of weak equity returns, validating the model's defensive utility.
The Composite Recession Model Components
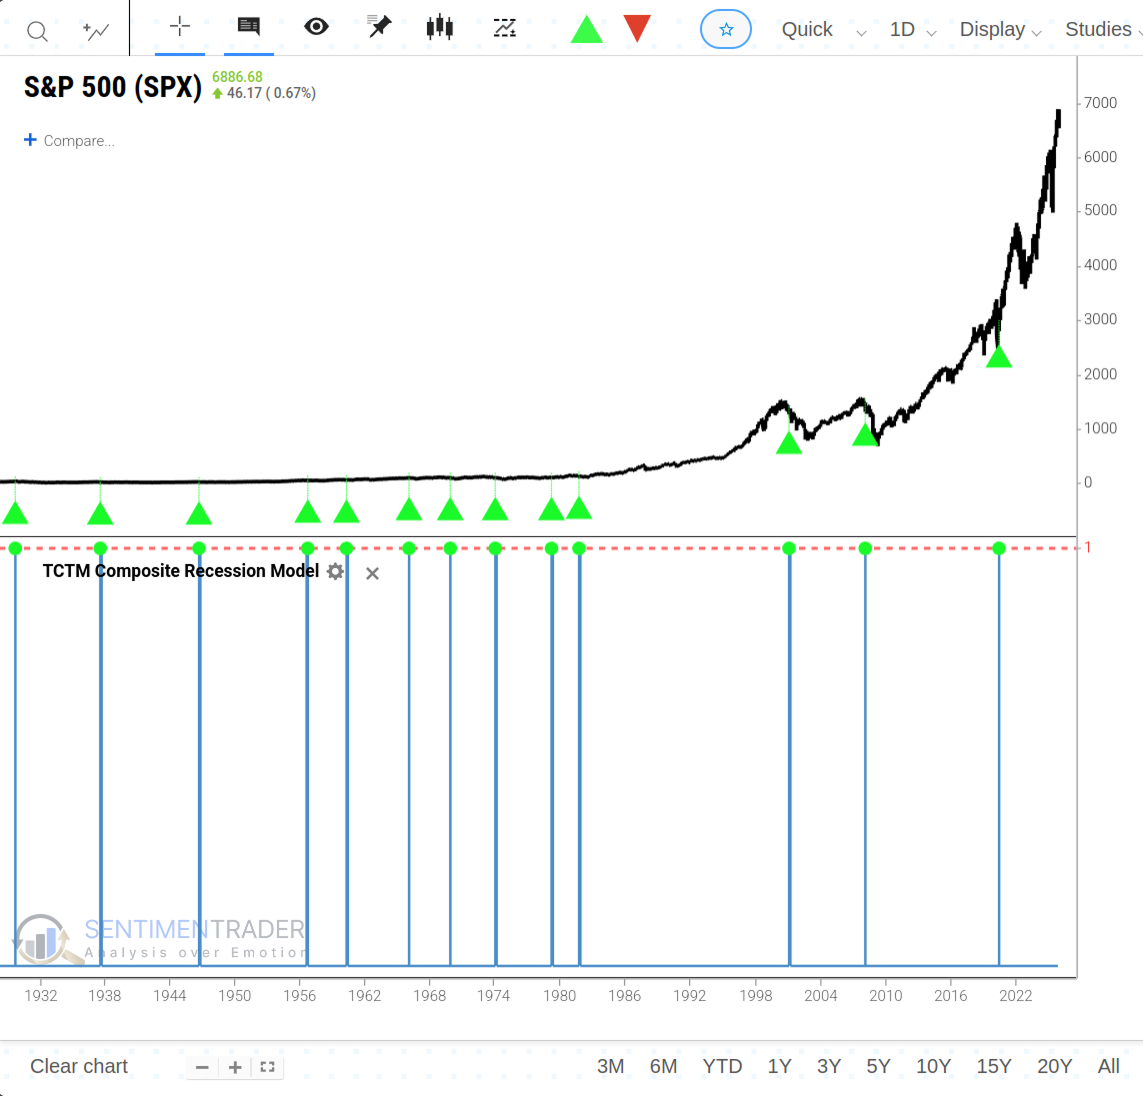
Identifying the primary market trend is one of the most critical tasks for any trader or investor. The Tactical Composite Trend Model (TCTM) is the culmination of decades of professional trading and financial market research, designed to aid in this process. The TCTM utilizes a weight-of-the-evidence approach, combining seven key time-tested components to identify major market turning points. This report will focus on one of those key components: the Sentimentrader's New TCTM (S-TCTM) Composite Recession Model.
The Composite Recession Model plays a vital role within the broader S-TCTM framework. It is designed to issue an alert when a diverse array of inputs-including heavy truck sales, corporate bond yields, economic sentiment, and housing data-concurrently point toward a potential economic contraction.
Component Descriptions
- Heavyweight truck sales
- Baa bond yield
- Economic sentiment
- Building permits
- Initial Jobless Claims
- Continuing Jobless Claims
- Financial Conditions
- Unemployment Rate
Composite Recession Model Signal Criteria
- Condition = Composite Signal Count >= 75%.
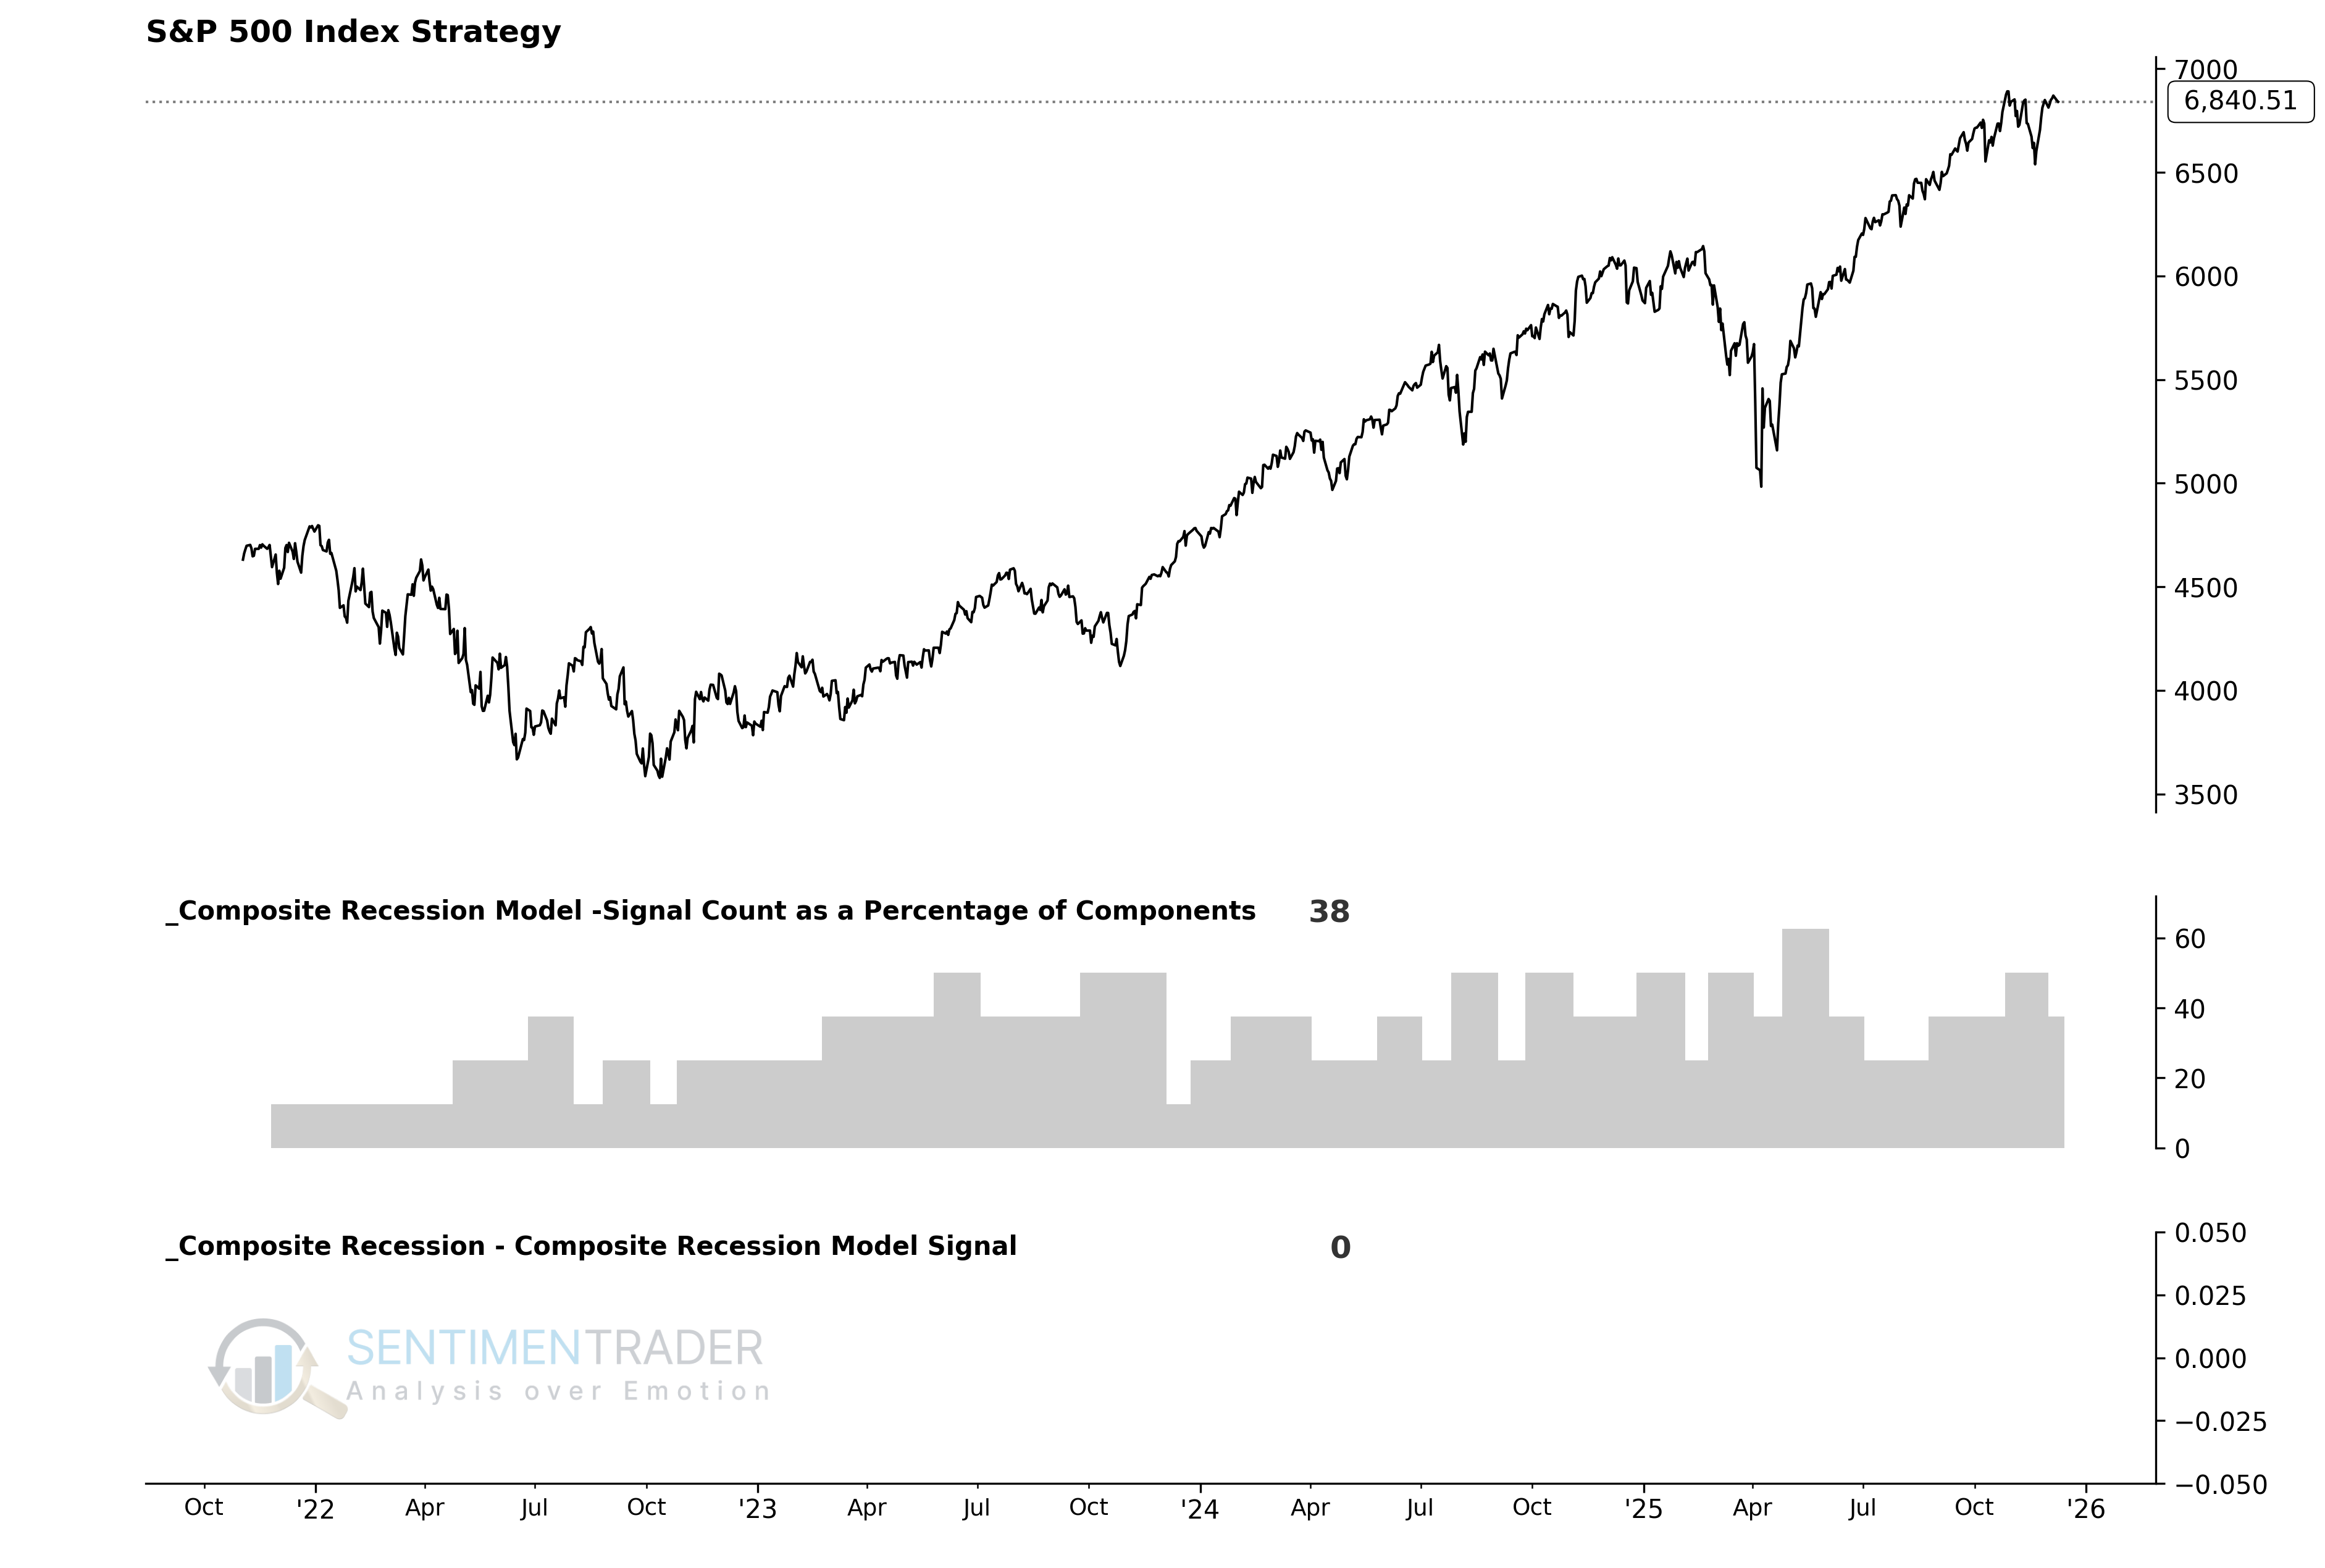
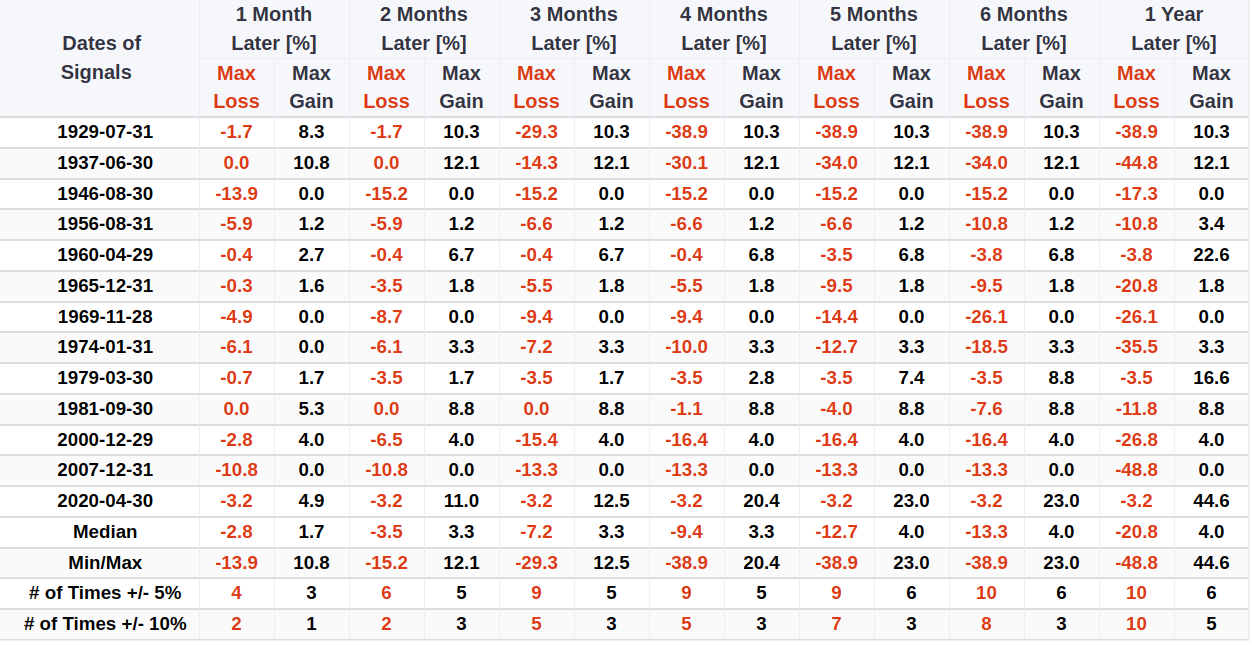
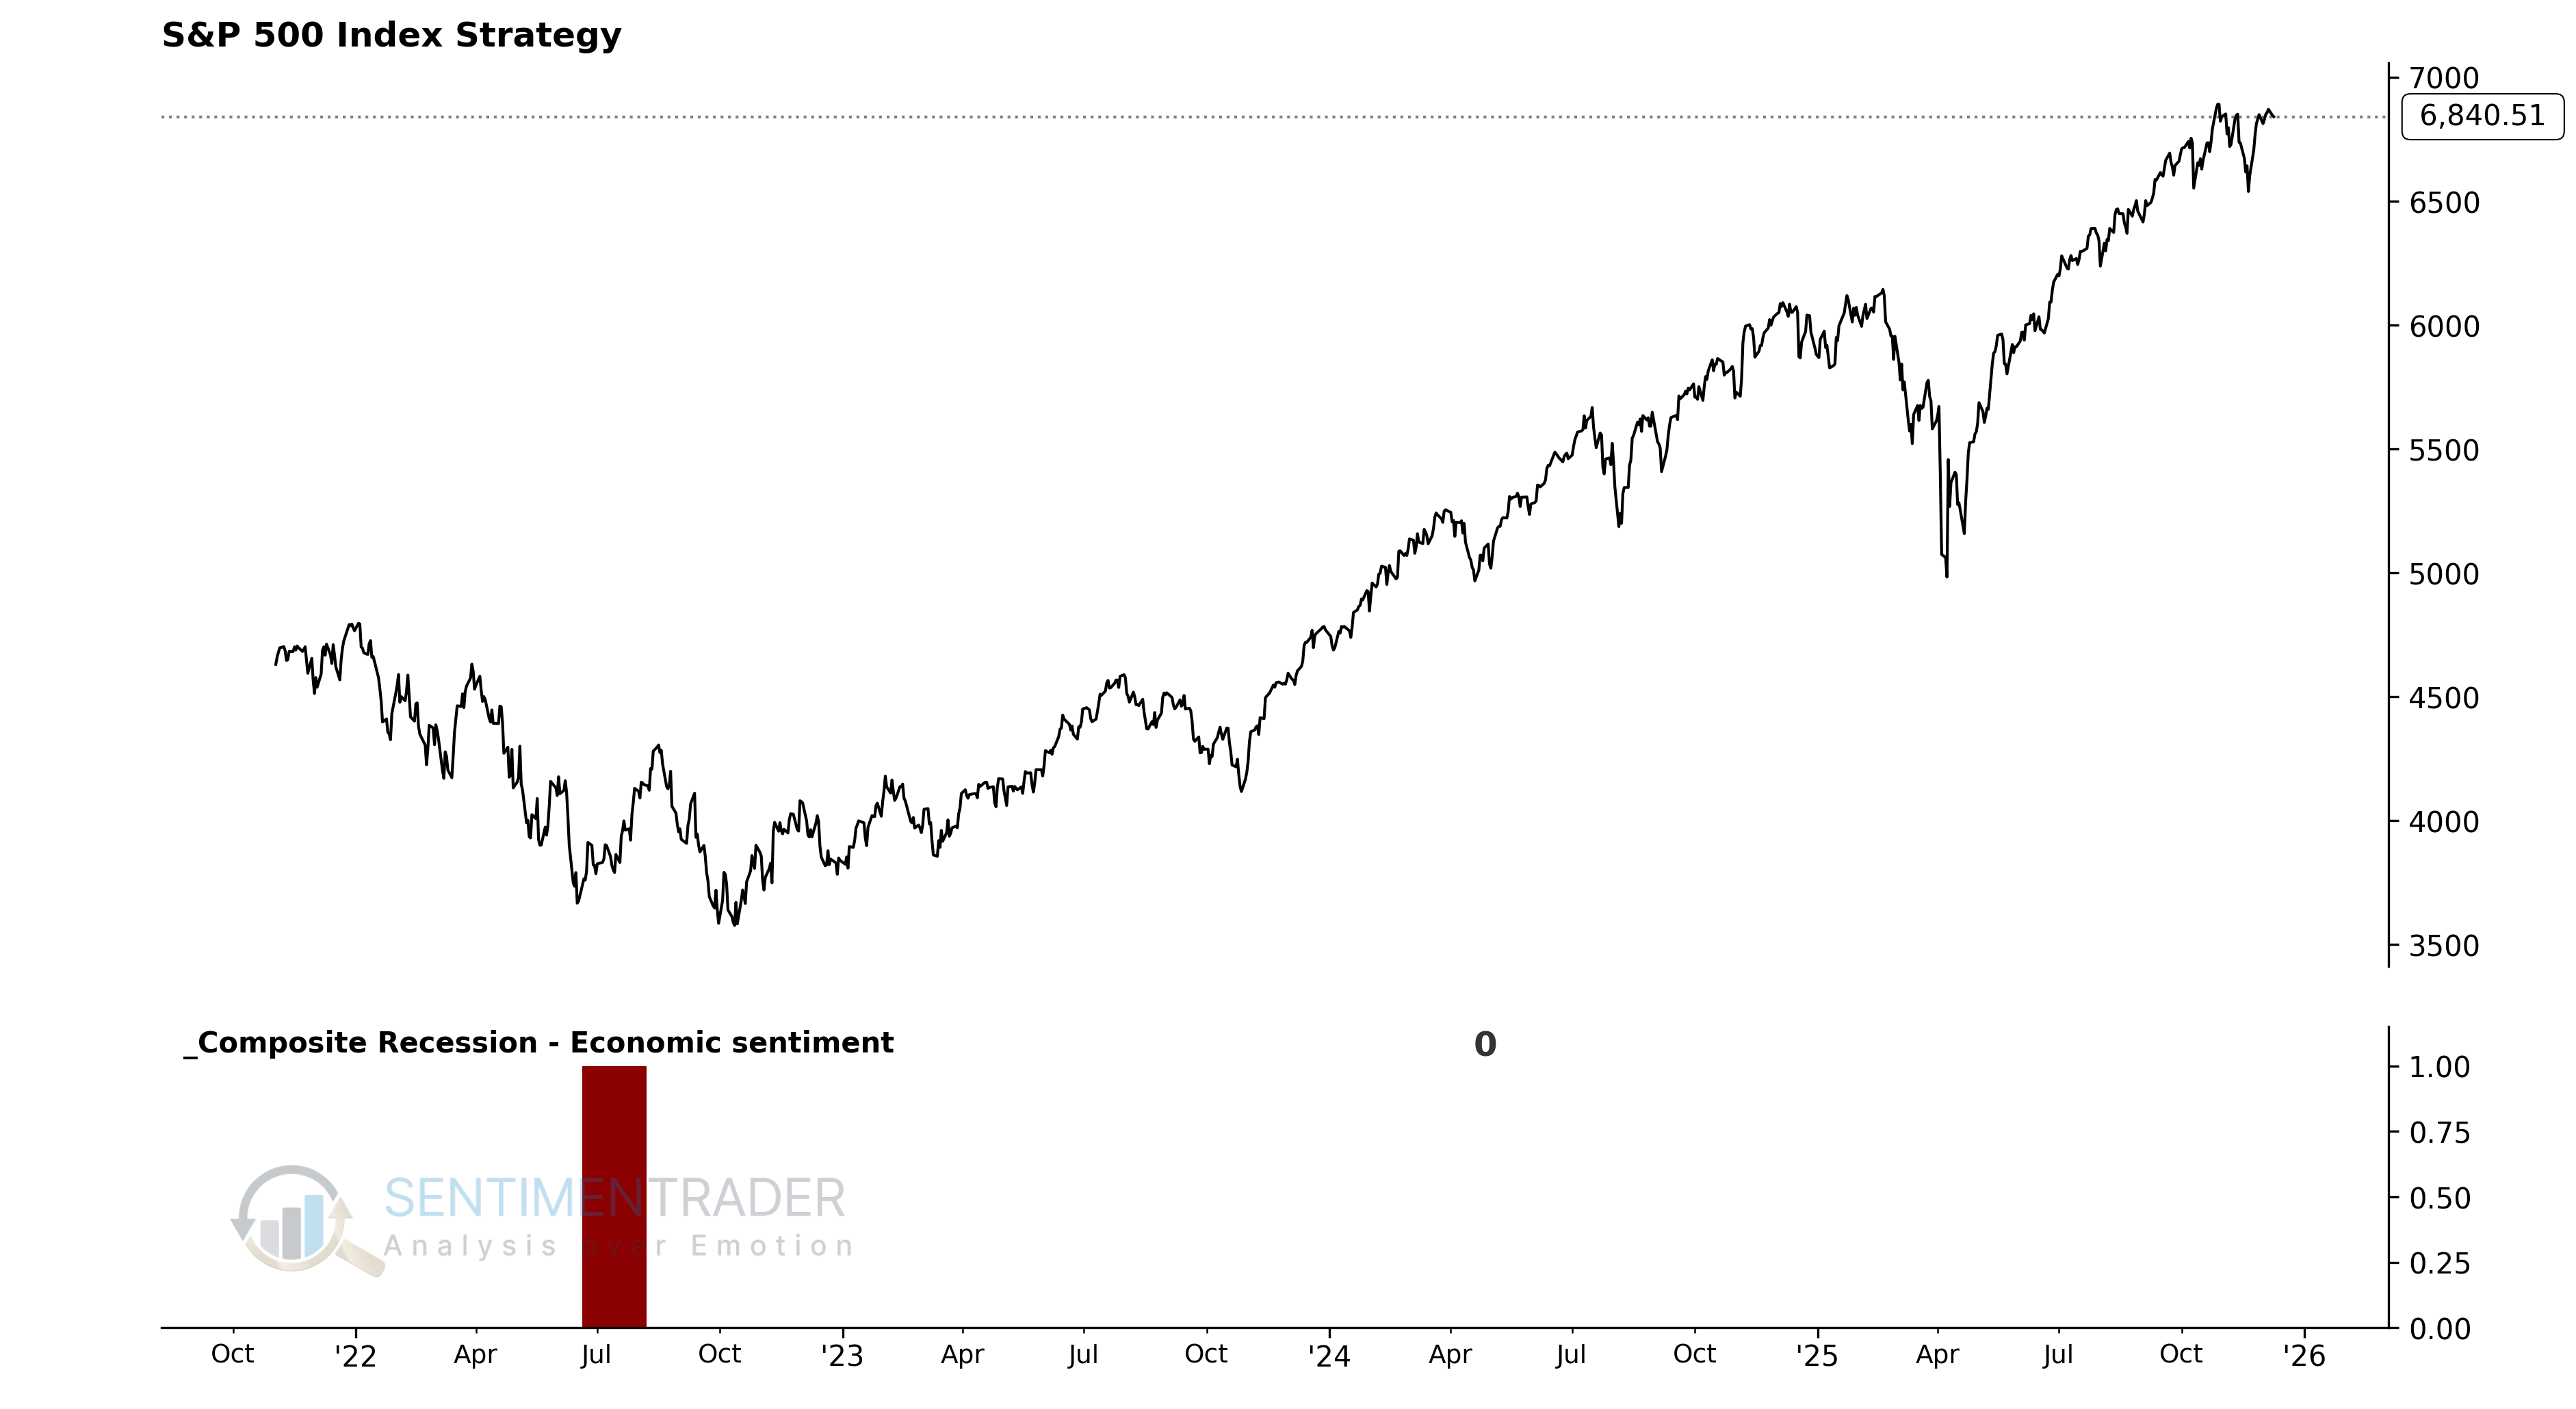
As the chart below illustrates, these individual components are combined into a single composite indicator-the Composite Recession Model-which uses a 0 or 1 value to issue alerts. Currently, the model shows a reading of 0, indicating no recession warning signal is active.
Utilizing the S-TCTM Composite Recession Model
The model's output allows us to define the market environment as "Favorable" or "Unfavorable" without subjective interpretation. Specifically:
- When the Composite Recession Model flips from 0 to 1, the primary trend is considered Unfavorable for stocks.
With this framework, we can construct a systematic trend-following strategy to see how this approach has performed historically.
Using the Backtest Edge engine, we can set up the entry and exit criteria to follow the model's signals. The setup is straightforward:
The Entry Criteria are set for when the S-TCTM Composite Recession Model equals 1, initiating a long position when the trend becomes unfavorable.
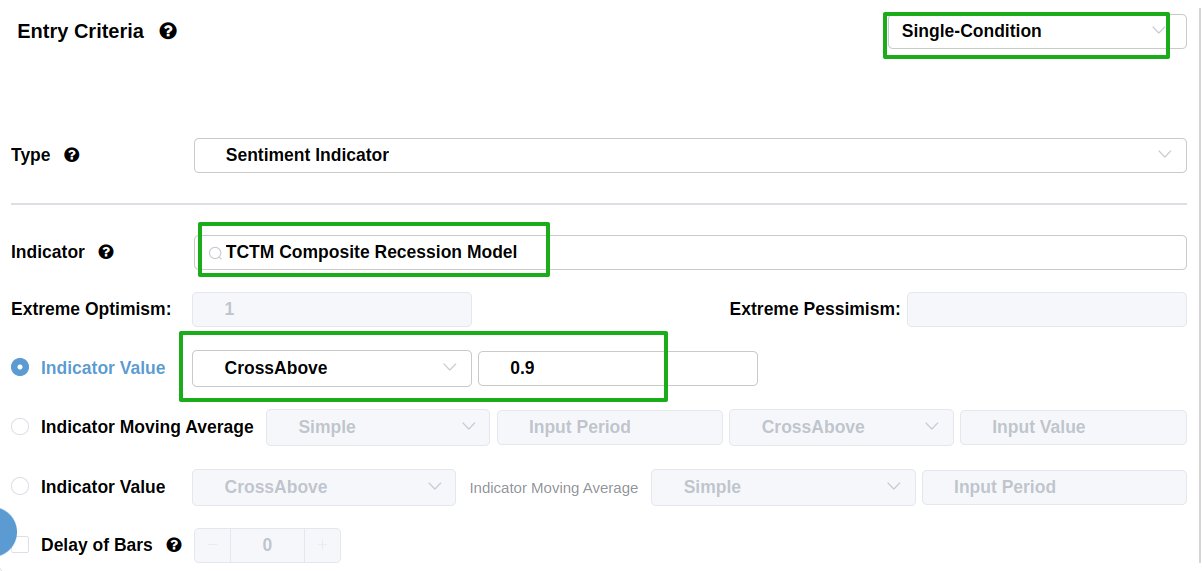
We can skip setting an explicit exit for this test, as we are primarily interested in the forward returns after the signal triggers.
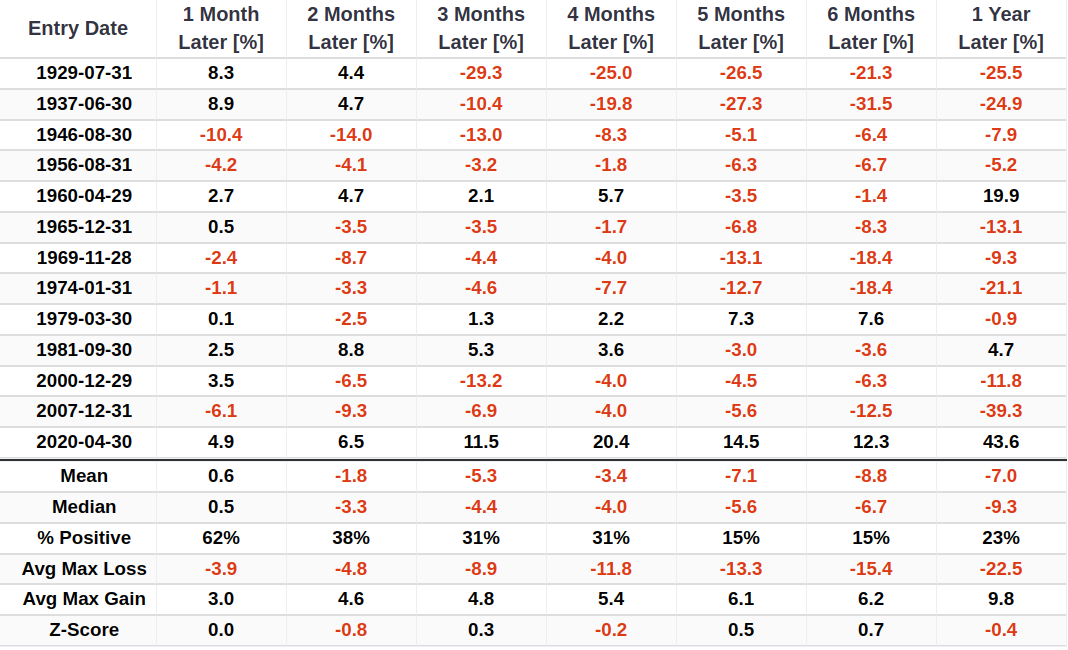
As seen in the charts below, market performance is typically poor following the triggering of this signal. For related backtest, click here.
Component Deep Dive
Heavyweight truck sales
Heavyweight trucks move a large percentage of the dollar value of freight around the country. So, when a big-ticket expenditure that moves freight around the country contracts on a year-over-year basis, we should take note as it can foreshadow a slowdown in overall economic growth.
Components
- Heavyweight Truck Sales
- S&P 500 Index
Heavyweight Truck Sales Risk-Off Model
The Heavyweight Truck Sales Risk-Off Model identifies market environments where a contraction in real economic demand (measured by truck sales) coincides with technical weakness in the stock market. The model issues an alert based on the following conditions.
Signal Criteria
- Condition 1 = Heavyweight Truck Sales Year-Over-Year Change <= -2.5%.
- Condition 2 = S&P 500 Close < 12-Month Moving Average.
- If both Condition 1 and Condition 2 are met, a risk-off signal is issued.
Current Day Chart
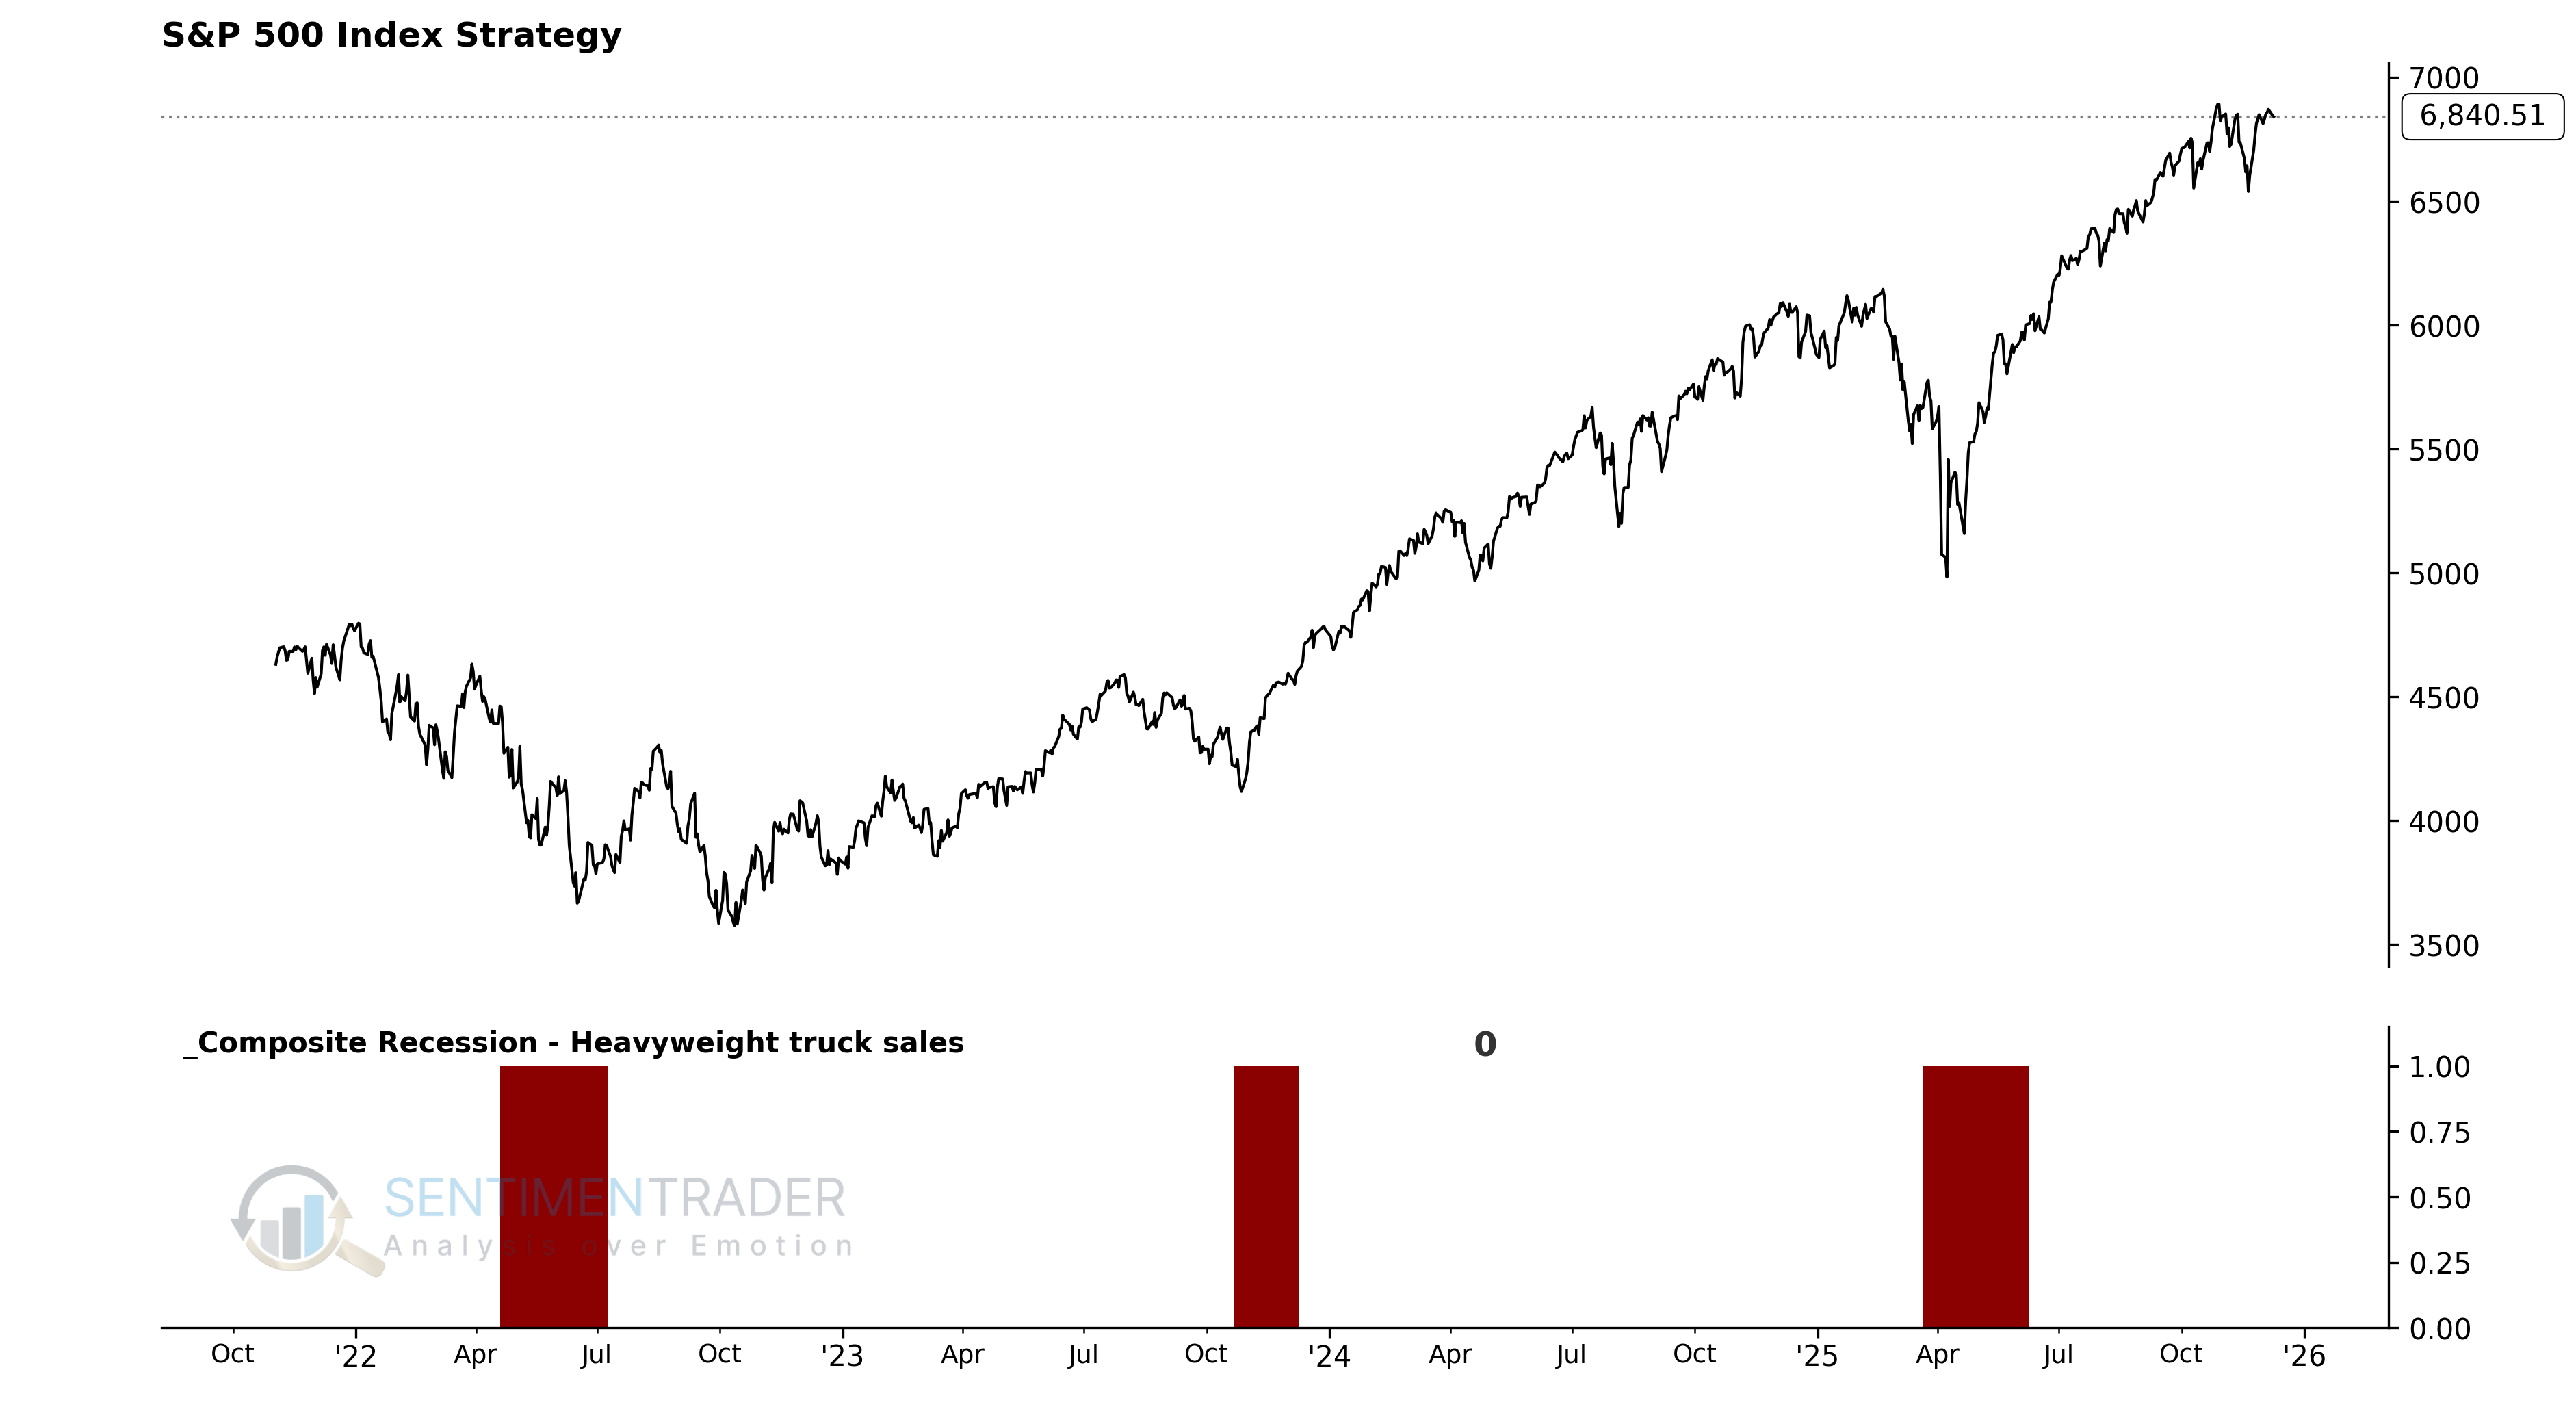
Signal Performance
As seen, performance across all time periods was subpar.
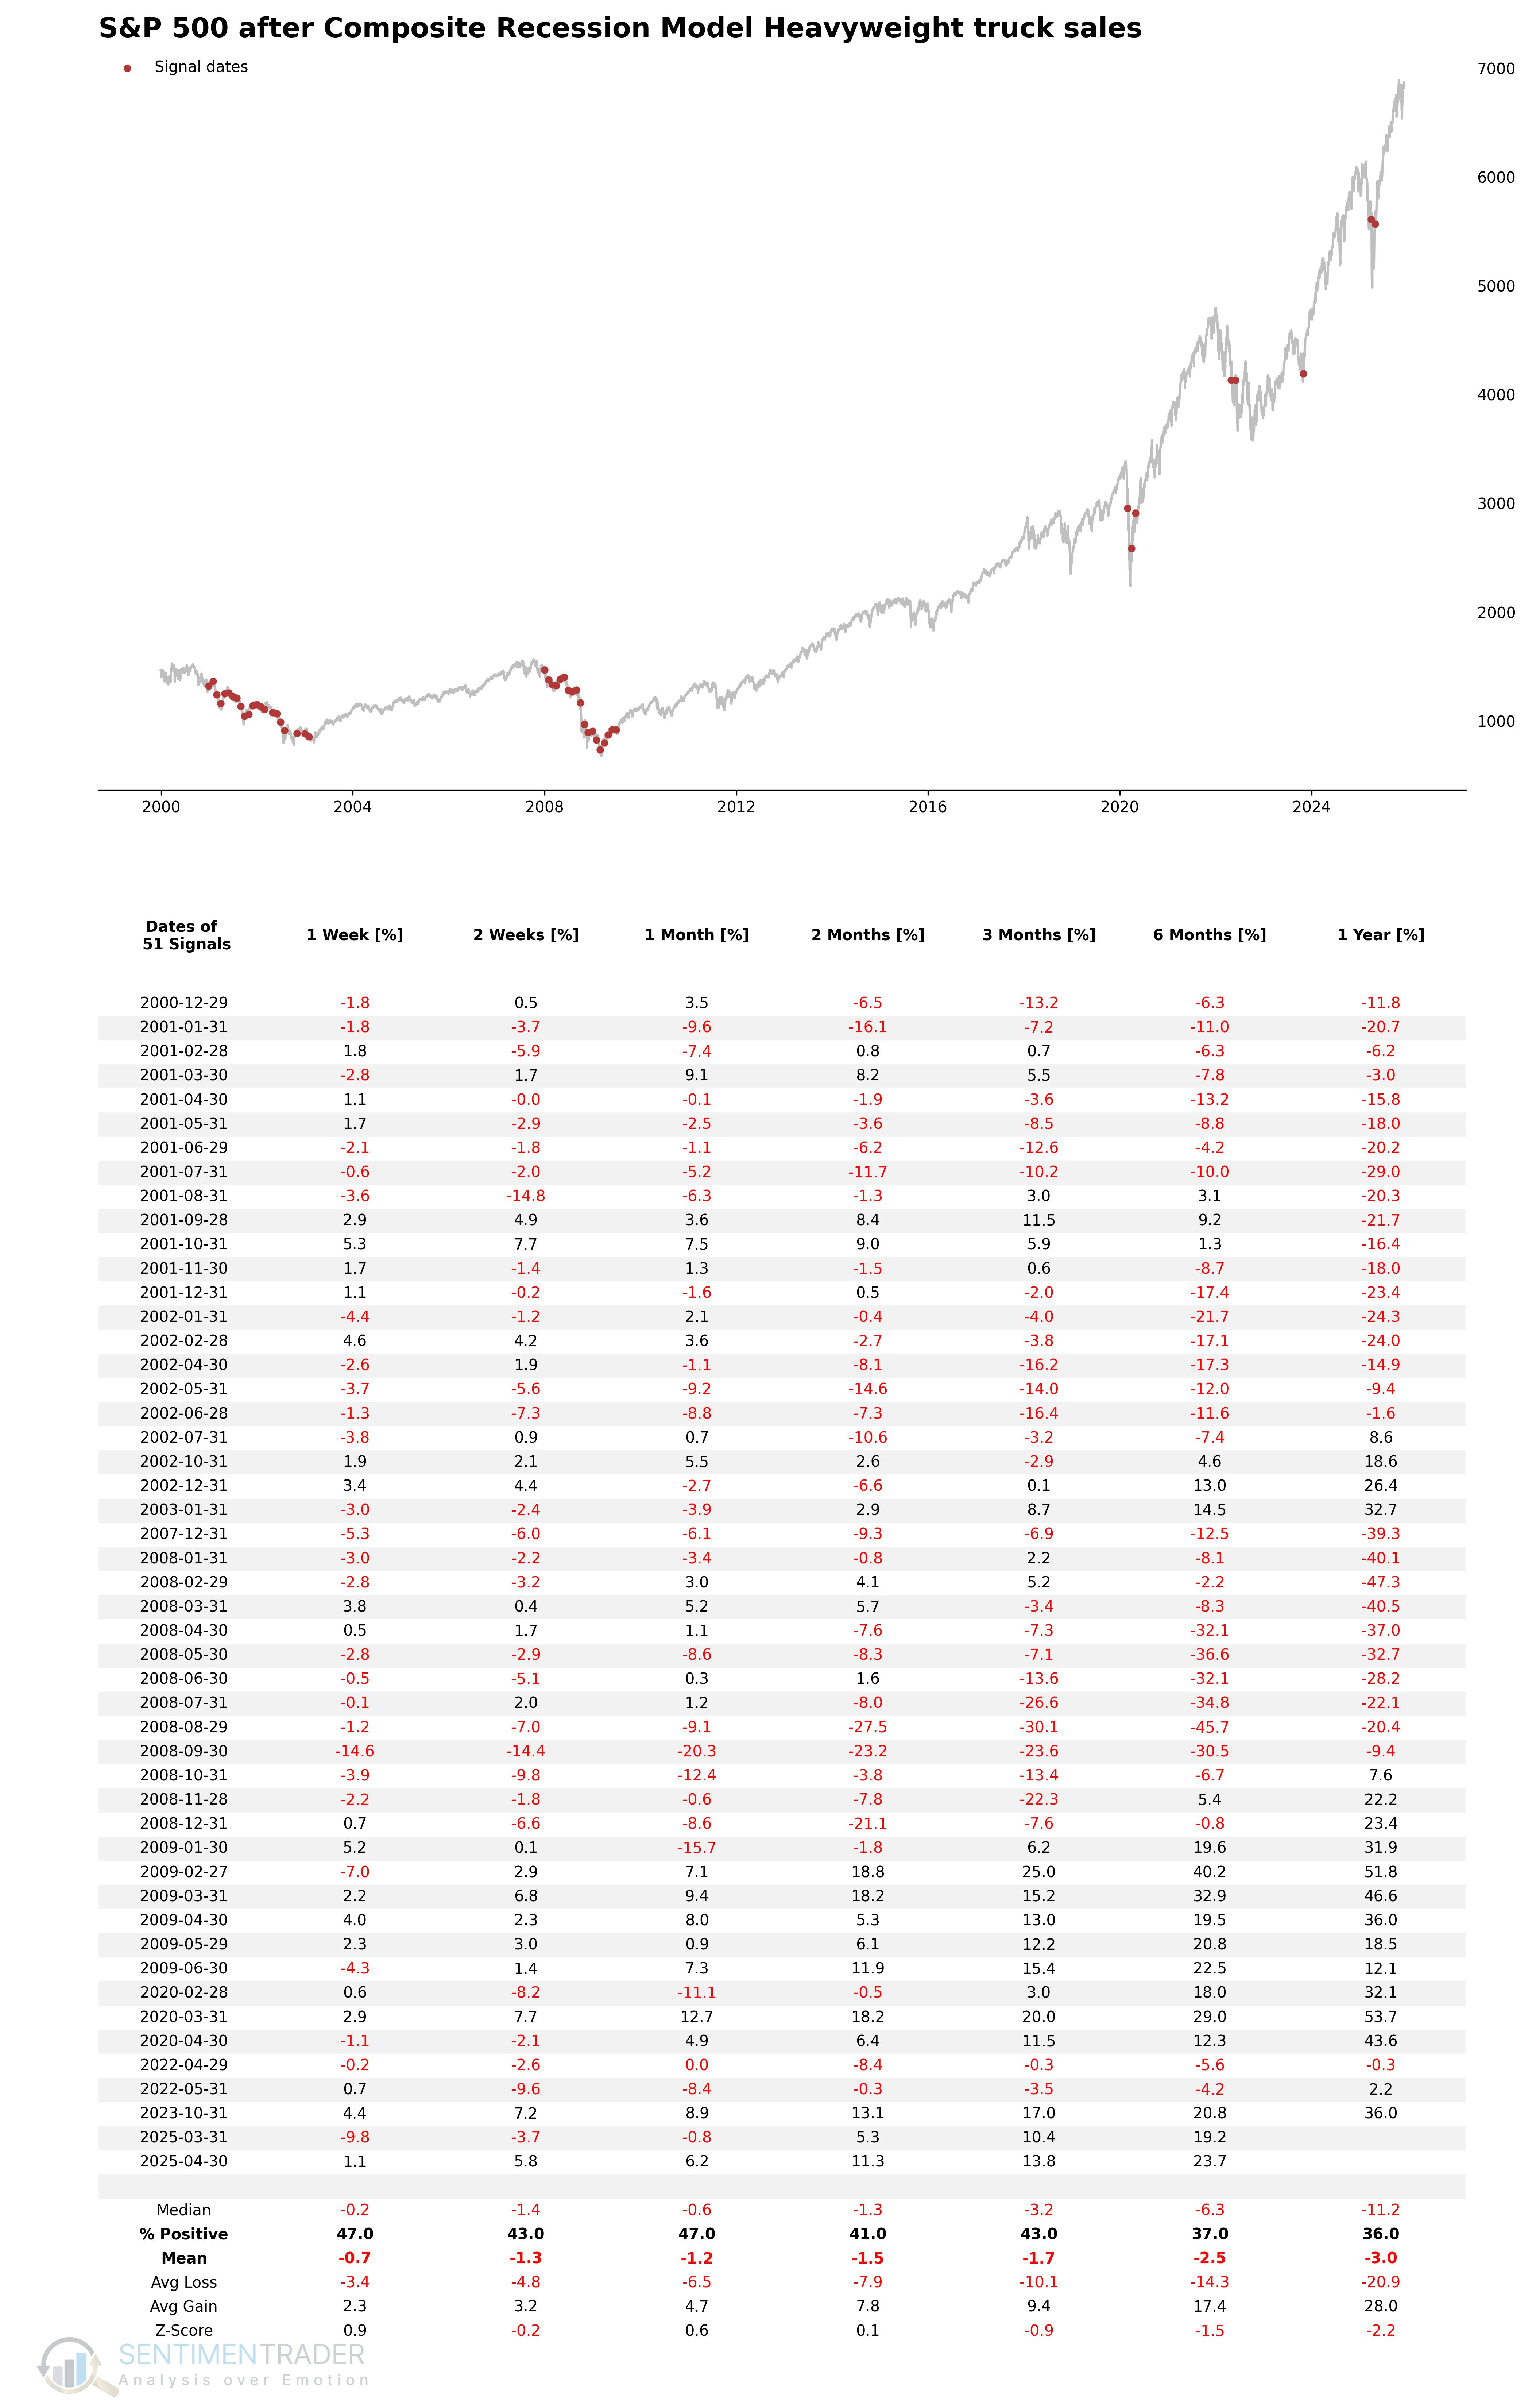
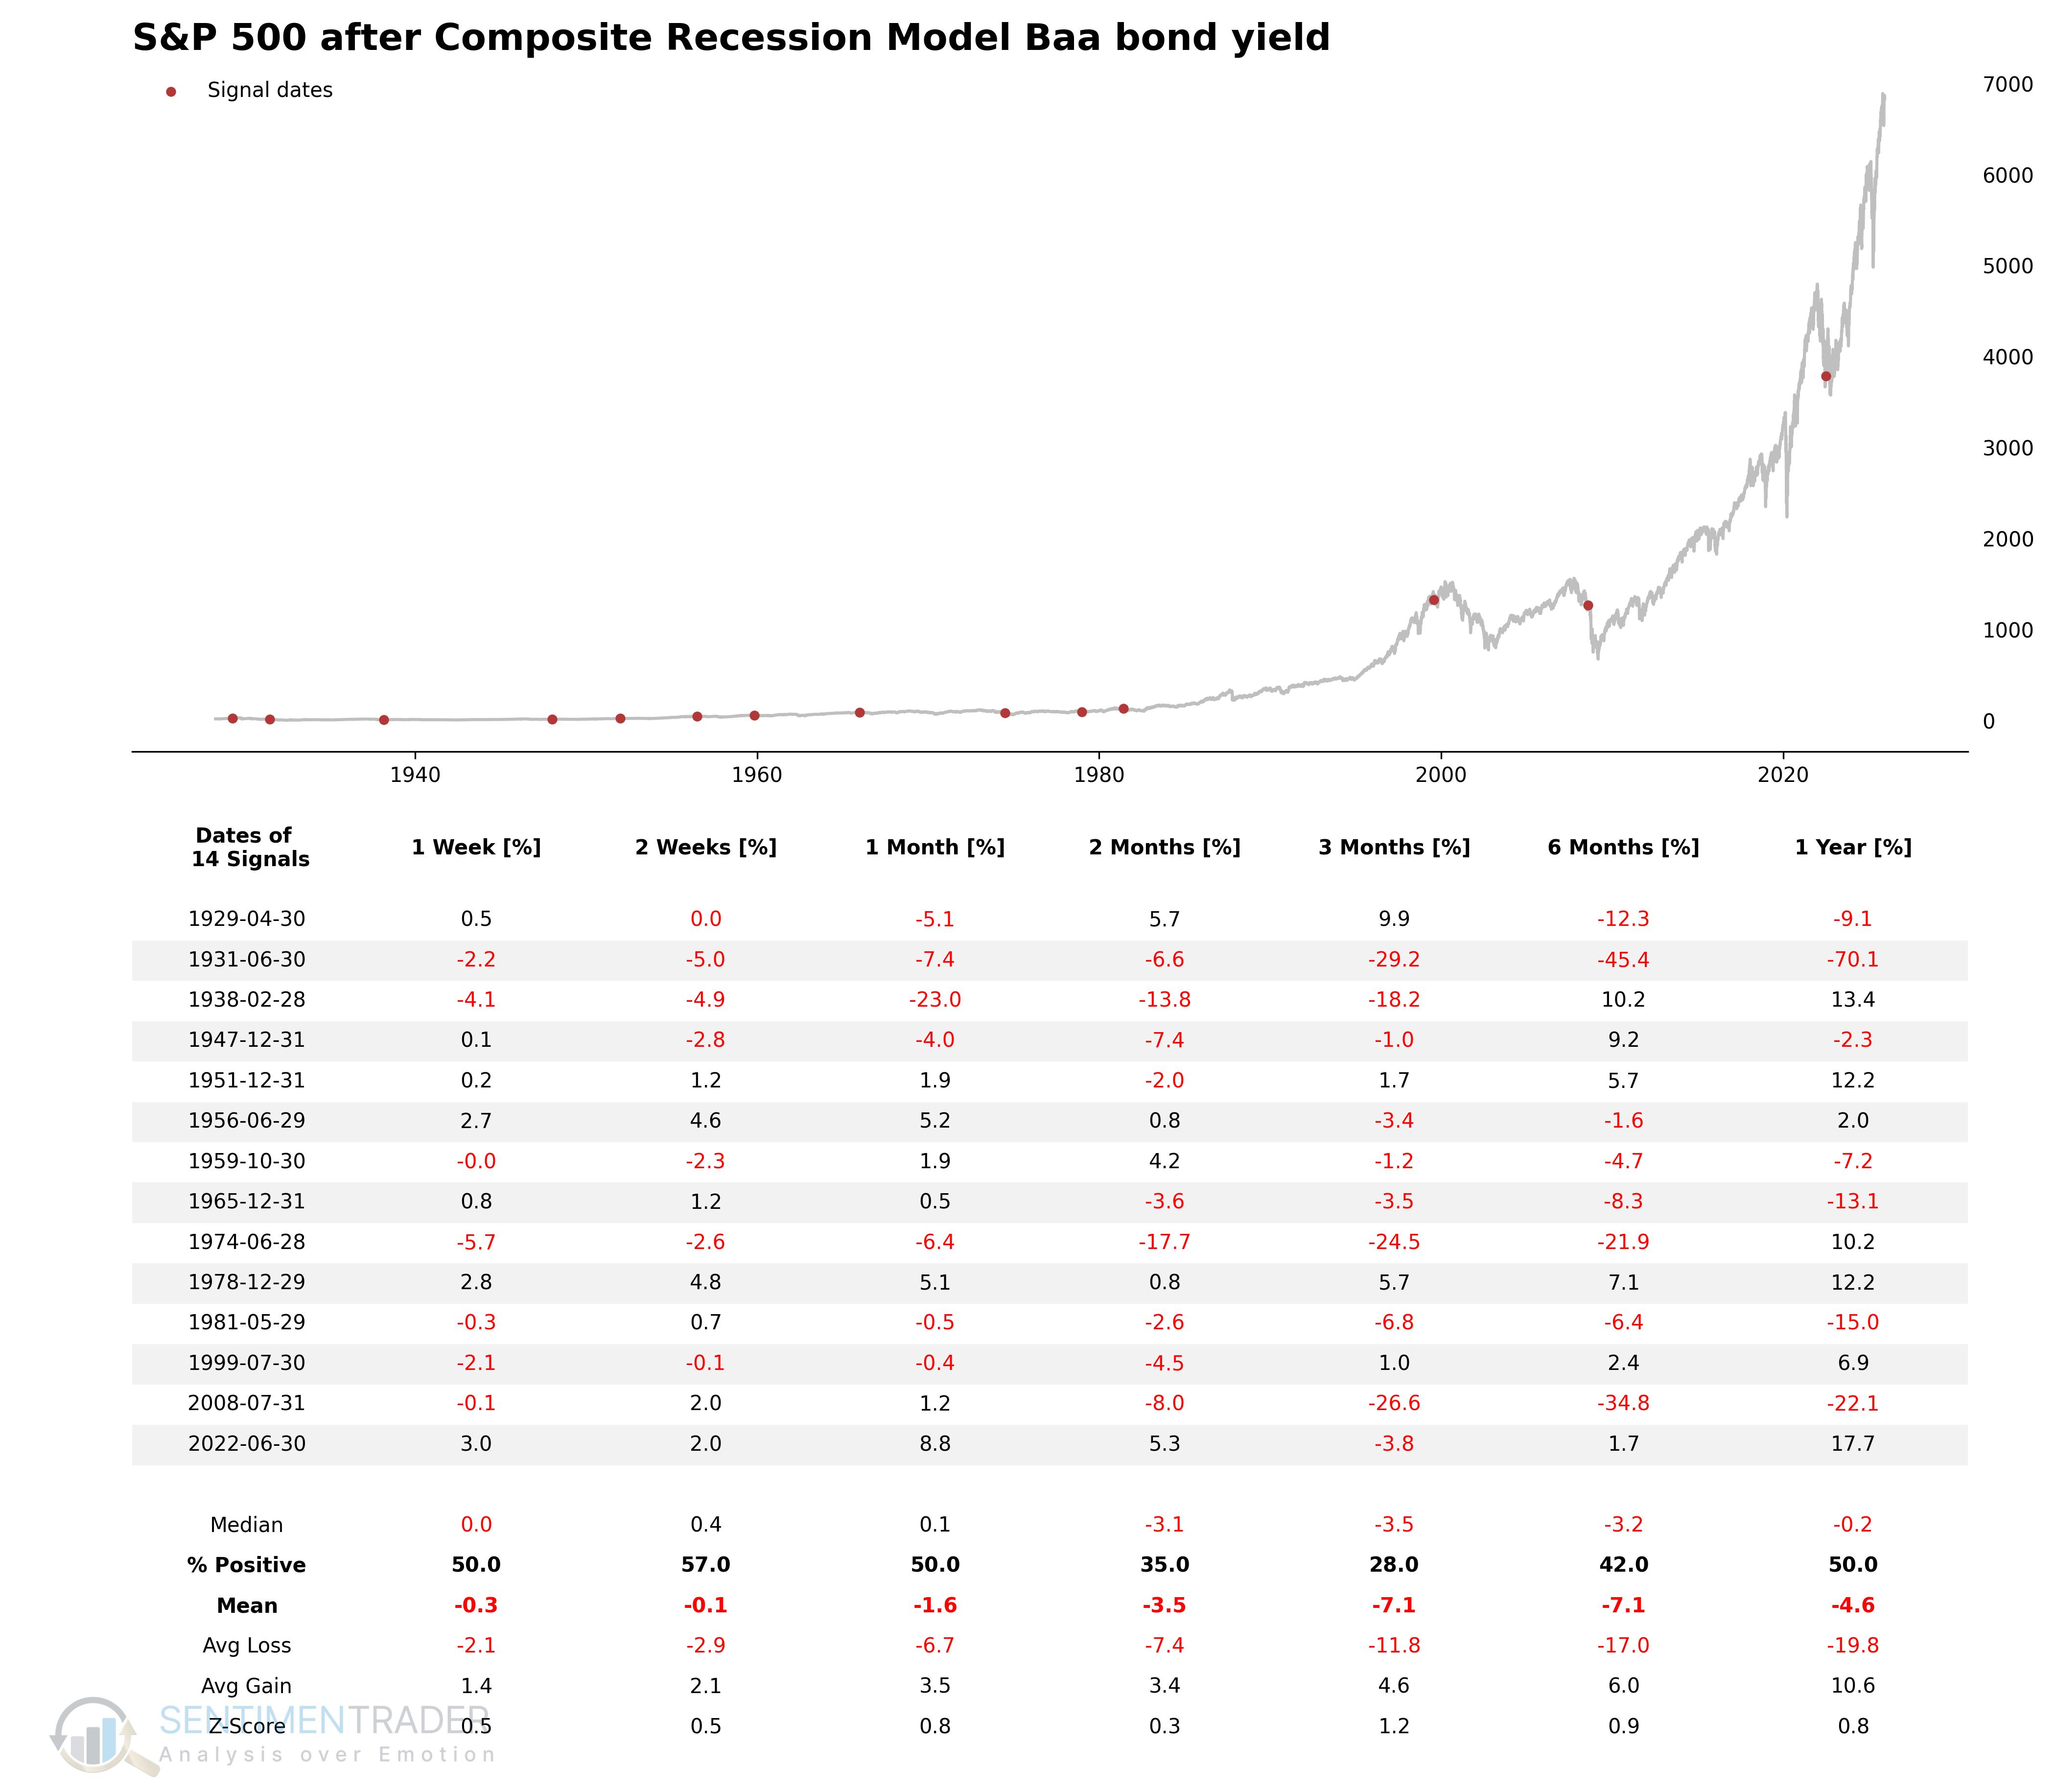
Baa bond yield
This model identifies periods where corporate borrowing costs are rising persistently and frequently, signaling tightening credit conditions.
Components
Moody's Seasoned Baa Corporate Bond Yield.
Baa Corporate Bond Yield Risk-Off Model
The Baa Corporate Bond Yield Risk-Off Model aims to identify historical periods where corporate bond yields show a sustained uptrend. The model uses an "edge trigger" mechanism, issuing an alert only at the moment the stress count reaches a critical threshold.
Signal Criteria
- Condition 1 = Baa Bond Yield hits an 18-month high (i.e., Current Yield >= Highest Yield in the last 18 months).
- Condition 2 = In a rolling 12-month window, the number of months meeting Condition 1 is >= 5.
- If both Condition 1 and Condition 2 are met, a risk-off signal is issued.
Current Day Chart
Signal Performance
Signal performance looks weak across several timeframes.
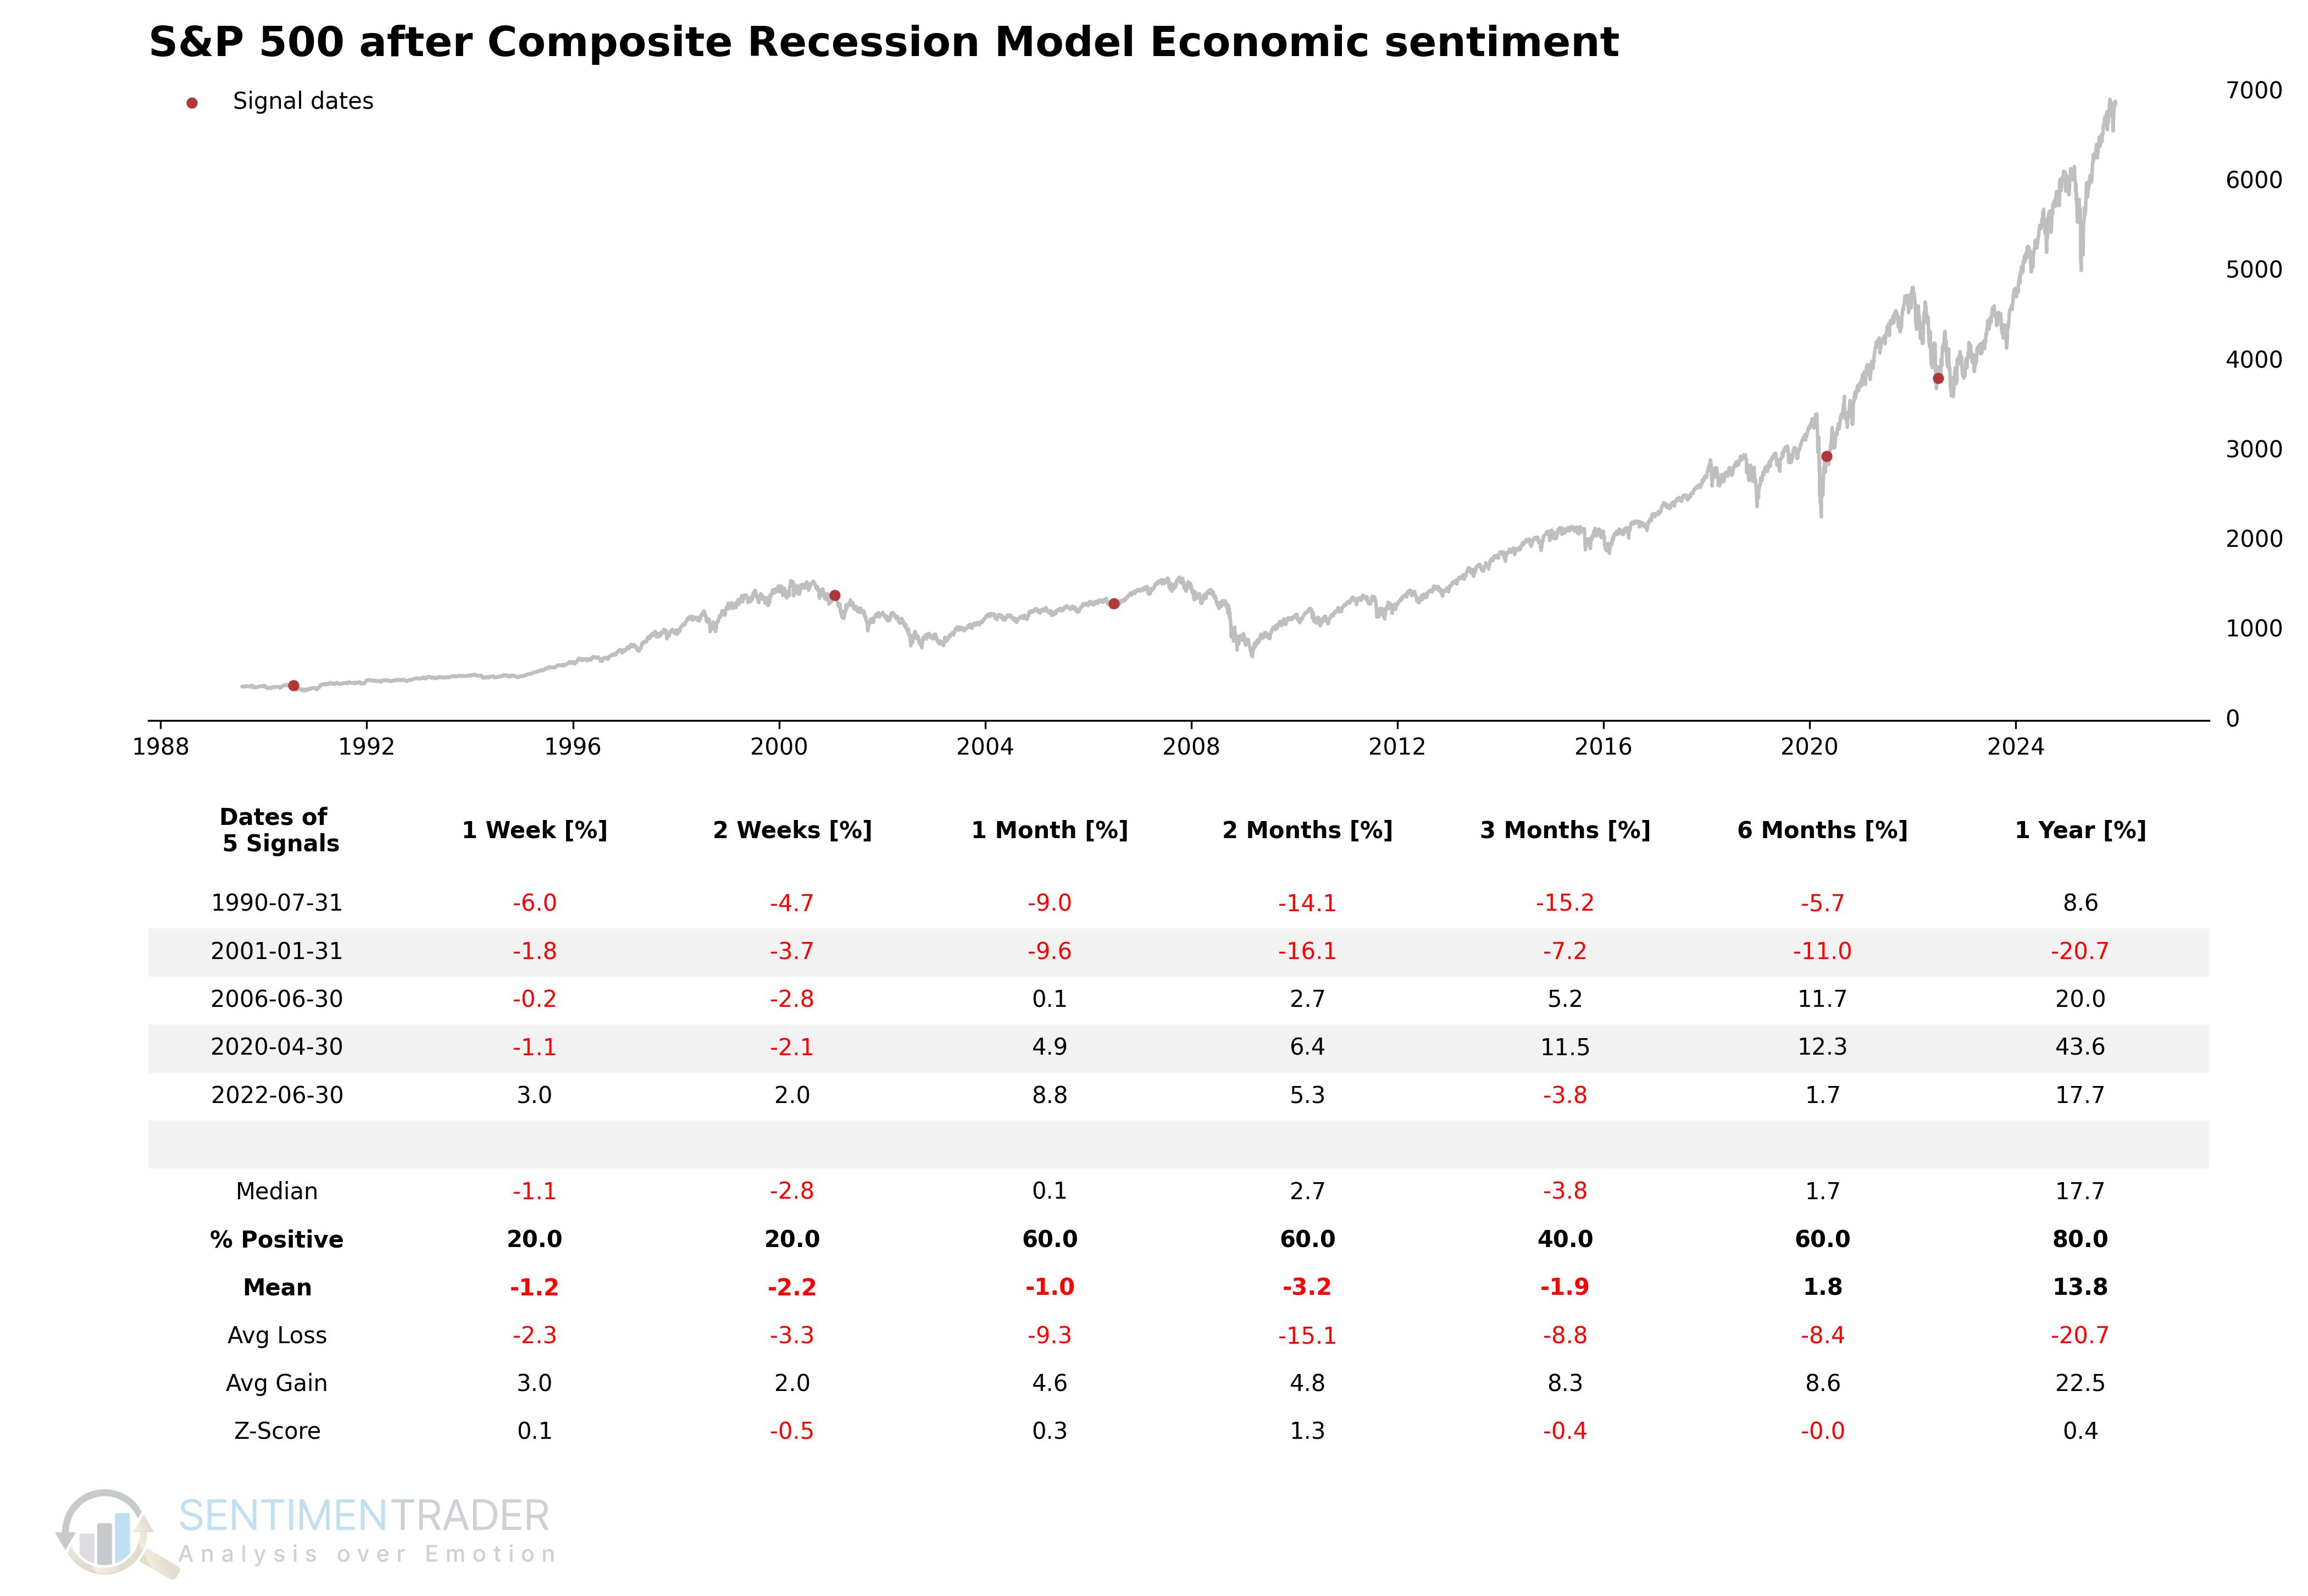
Economic sentiment
Economic sentiment surveys ("soft data") provide insights into how consumers and businesses view current and future economic conditions, often shifting before "hard" economic data does. This model doesn't rely on the absolute reading of a single indicator; instead, it converts multiple key sentiment indicators into a historical percentile rank ("Expanding Rank") to normalize data differences across surveys. It identifies moments when aggregate sentiment swiftly reverses from extreme optimism (high historical rank) to pessimism (low historical rank), which is often an early signal of an economic cycle turn.
Components
- Small Business Optimism (NFIB)
- NFIB Small Business Outlook for General Business Conditions
- University of Michigan Consumer Sentiment
- Conference Board Consumer Confidence
- ISM Manufacturing PMI
- NAHB Housing Market Index
- Philadelphia Fed Business Outlook Survey
- ISM Services PMI
Economic Sentiment Survey Risk-Off Model
This model aggregates multi-dimensional survey data to smooth out noise from single data points and uses historical quantiles to standardize sentiment readings. It monitors for structural deterioration in the composite ranking.
Signal Criteria
- Condition 1 = Calculate Expanding Rank: For each of the 8 sentiment indicators, calculate its percentile rank (0-100%) within an expanding historical window. This establishes the strength of the current reading relative to history.
- Condition 2 = Calculate Sentiment Avg Rank: Take the arithmetic mean of the ranks of all available indicators to generate a daily/monthly Composite Sentiment Score.
- Condition 3 = Sentiment Reversal: The Composite Avg Rank reverses from an "Optimistic Zone" and falls into a "Pessimistic Zone."
- If Conditions 1-3 are met, confirming that the economic outlook has shifted from optimistic to pessimistic, a risk-off signal is issued.
Current Day Chart
Signal Performance
Performance in the short term has not been particularly strong.
Other Indicators
The model uses the following indicators as "confirmation" signals to identify current market sentiment. The specific method involves identifying instances where the indicator's year-over-year change exceeds a certain threshold. When these signals confirm the current pessimistic environment, the Composite Recession Model's signal count increases. Once a threshold (>= 75%) is reached, a risk-off signal is issued.
- Building permits
- Initial Jobless Claims
- Continuing Jobless Claims
- Financial Conditions
- Unemployment Rate
What the research tells us...
The S-TCTM Composite Recession Model is a sophisticated, 'weight-of-the-evidence' tool designed to identify the onset of economic contractions. By aggregating signals from hard data (like truck sales and jobless claims), credit markets (Baa bond yields), and soft data (consumer and business sentiment), it provides a holistic view of economic health.
When these economic engines sputter simultaneously, equity markets typically face significant headwinds. A composite reading of 75% or higher serves as a high-conviction warning, suggesting that the probability of a recession-and a subsequent bear market-has risen to a critical level, warranting a defensive posture.