Products
SentimenTrader Trading Tools
‍
Backtest Engine
My Trading Toolkit
Correlation Analysis
Seasonality
Market Prediction
Indicators & Data API
‍
Proprietary Indicators & Charts
Market Data API
Strategies & Scanner
‍
50+ Trading Strategies
Smart Stock Scanner
Smart Option Scanner
Research Reports
‍
Research Solutions
Reports Library
Free Resources
Simple Backtest Calculator
Simple Seasonality Calculator
The Kelly Criterion Calculator
Sentiment Geo Map
Public Research Reports
Education
Sentiment Indicators
Technical Indicators
Pricing
Company
About
In the News
Testimonials
Client Success Stories
Contact
Log inLoginSign up
< BACK TO ALL REPORTS

An improvement in relative trends across the market-cap spectrum

Dean Christians
2024-07-29
The percentage of S&P 1500 sub-industry groups hovering within 5% of a 6-month relative low cycled from over 75% to under 15%, indicating a broadening in relative performance across the market-cap spectrum. Similar relative trend shifts preceded a bullish outlook for the world's most benchmarked index.

Key points:

  • The percentage of sub-industries within 5% of a 6-month relative low cycled from above 75% to below 15%
  • Similar relative trend reversals preceded solid returns and consistency for the S&P 500 over the next year 
  • Despite several calls for a great rotation, a significant sector theme across all capitalizations has yet to develop

A significant reversal in relative trends

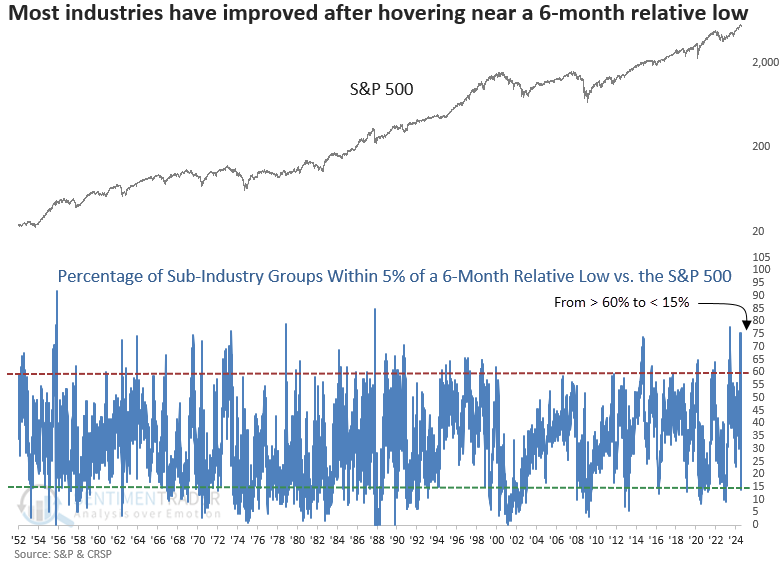
In June, I published a research note highlighting how most sub-industry groups were hovering near 6-month relative lows compared to the S&P 500. At the time, investors were crowding into predominantly mega-cap technology stocks at the expense of everything else.

After climbing to one of the highest levels in history, the percentage of S&P 1500 sub-industry groups hovering within 5% of a 6-month relative low versus the S&P 500 reversed to the downside, indicating an improvement in relative trends for stocks across all market capitalizations.

Because a reversal from above 75% to below 15% has occurred only four other times in history, I lowered the upper threshold to 60% to capture more precedents.

Comparable relative trend shifts preceded positive returns

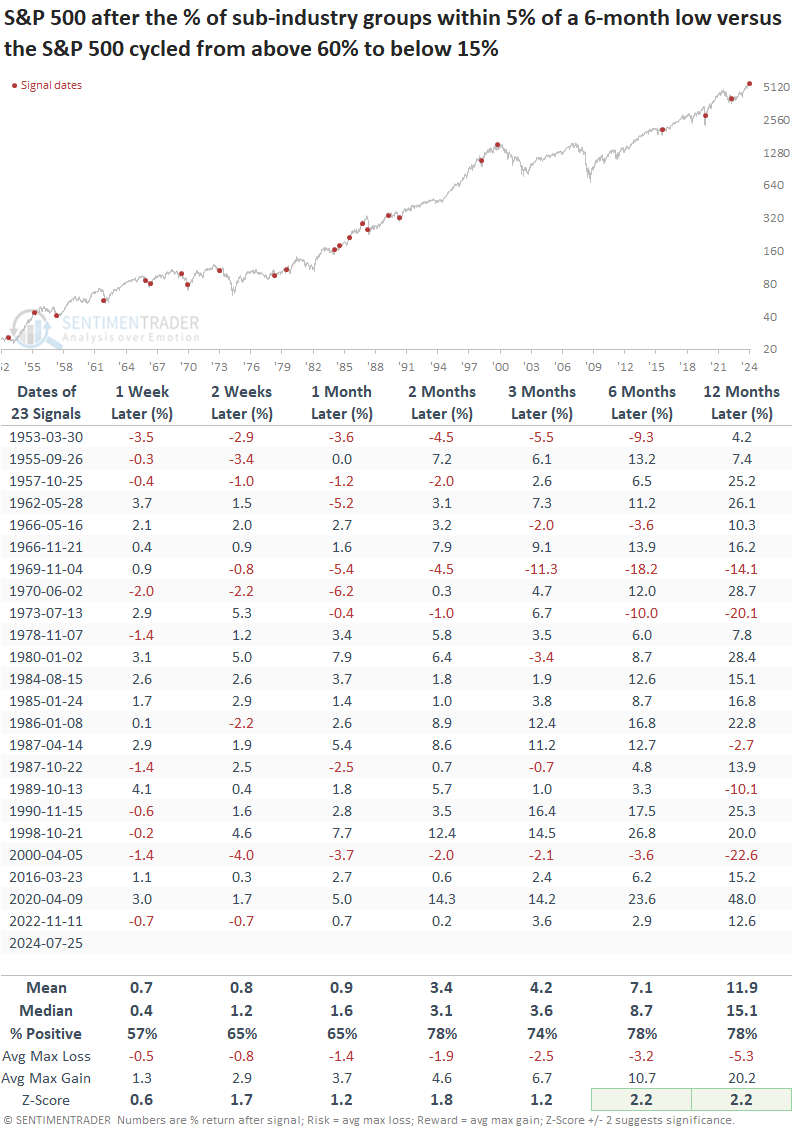
Whenever the percentage of sub-industry groups within 5% of a 6-month relative versus the S&P 500 cycled from above 60% to below 15%, the world's most benchmarked index demonstrated solid returns and consistency over the following year. Furthermore, six and twelve months later, returns showed significance relative to random returns over the study period.

Suppose I isolated signals that occurred within 5% of a 5-year high in the S&P 500, context similar to now. In that case, the S&P 500 was higher in five out of six instances a year later, with the only loss being in April 2000. 

Although most signals appeared after corrections or bear markets, a time when the equal-weighted S&P 500 typically outperforms the cap-weighted S&P 500, the comparison between these two index weighting methodologies does not reveal a decisive advantage for either index.

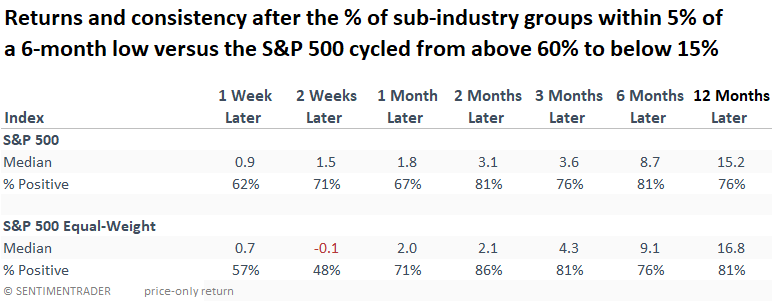
The above table contains two fewer signals due to data limitations for the equal-weighted index.

Big-picture trends

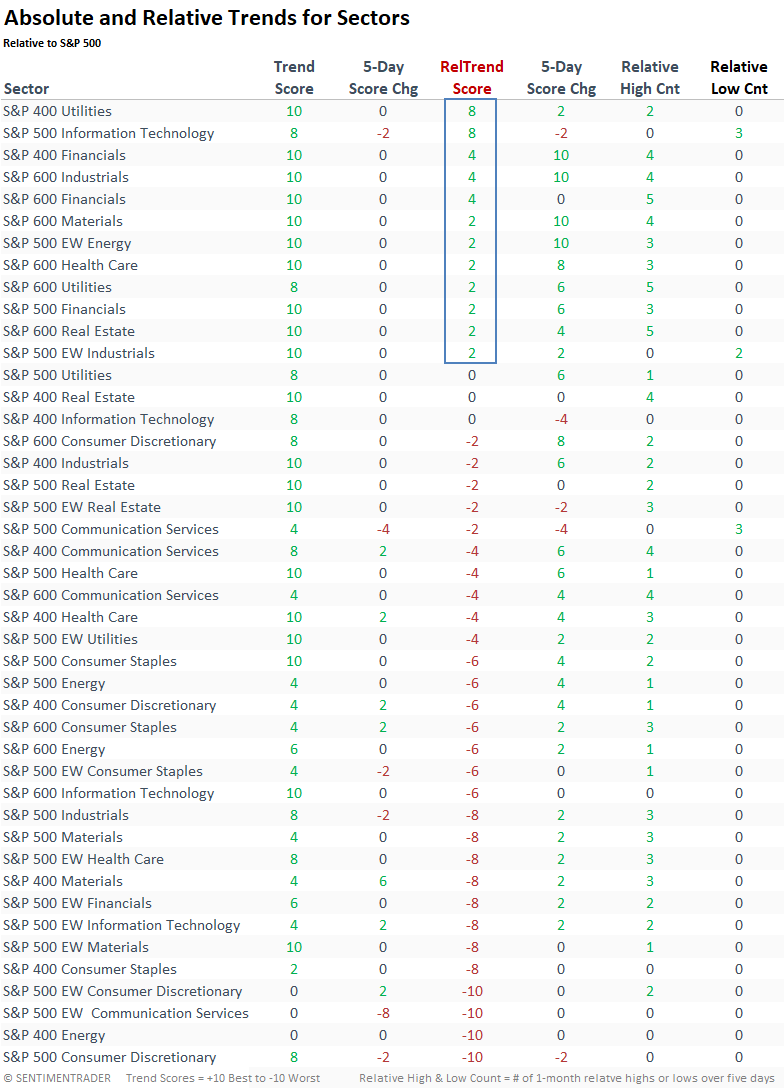
While the research team has highlighted several favorable signals, suggesting a broadening in participation and the potential for improvement in relative trends down the market-cap spectrum, a significant rotation theme has yet to emerge. Therefore, investors should rely upon individual stock selection in companies exhibiting strong absolute and relative trends rather than broadly owning a sector ETF.

What the research tells us...

Relative trends for S&P 1500 sub-industry groups reversed from a high level of groups hovering near a 6-month low to a more favorable stance, indicating improved relative performance down the market-cap spectrum. Similar shifts were more commonly associated with inflection points coming out of corrections or bear markets. Regardless of the environment, returns and consistency were solid, especially a year later.
Despite a swift transition, relative trend score rankings, which employ medium to long-term trend-following indicators, have yet to indicate a significant rotation or emerging sector theme. Consequently, without clear sector leadership, investors should focus on individual stocks with robust absolute and relative trend scores.

PRODUCTS
SentimenTrader
Trading Tools
Indicators & Data API
‍
Strategies & Scanner
‍
Research Reports
FREE
RESOUrCES
Simple Backtest
Calculator
Simple Seasonality
Calculator
The Kelly Criterion
Calculator
Sentiment Geo Map
‍
Public Research Reports
‍
Education
Sentiment Indicators
‍
Technical Indicators
‍
Pricing
Bundle pricing
‍
FAQ
‍
Announcements
‍
COMPANY
‍
About
‍
In the News
‍
Testimonials
‍
Client Success Stories
CONTACT
‍
General Inquiries
‍
Media Inquiries
‍
Financial Professionals Inquiries
‍
© 2026 Sundial Capital Research Inc. All rights reserved.
Setsail Marketing
TermsPrivacyAffiliate Program
Risk Disclosure: The information and tools provided are for research and analytical purposes only and are not intended as investment advice. Market analysis involves uncertainty, and outcomes may differ from expectations. Users should conduct their own due diligence and consider their individual circumstances before making any financial decisions. Past performance is not necessarily indicative of future results.

Hypothetical Performance Disclosure: Hypothetical performance results have many inherent limitations, some of which are described below. No representation is being made that any account will or is likely to achieve profits or losses similar to those shown; in fact, there are frequently sharp differences between hypothetical performance results and the actual results subsequently achieved by any particular trading program. One of the limitations of hypothetical performance results is that they are generally prepared with the benefit of hindsight. In addition, hypothetical trading does not involve financial risk, and no hypothetical trading record can completely account for the impact of financial risk of actual trading. for example, the ability to withstand losses or to adhere to a particular trading program in spite of trading losses are material points which can also adversely affect actual trading results. There are numerous other factors related to the markets in general or to the implementation of any specific trading program which cannot be fully accounted for in the preparation of hypothetical performance results and all which can adversely affect trading results.

Testimonial Disclosure: Testimonials appearing on this website may not be representative of other clients or customers and is not a guarantee of future performance or success.