Products
SentimenTrader Trading Tools
‍
Backtest Engine
My Trading Toolkit
Correlation Analysis
Seasonality
Market Prediction
Indicators & Data API
‍
Proprietary Indicators & Charts
Market Data API
Strategies & Scanner
‍
50+ Trading Strategies
Smart Stock Scanner
Smart Option Scanner
Research Reports
‍
Research Solutions
Reports Library
Free Resources
Simple Backtest Calculator
Simple Seasonality Calculator
The Kelly Criterion Calculator
Sentiment Geo Map
Public Research Reports
Education
Sentiment Indicators
Technical Indicators
Pricing
Company
About
In the News
Testimonials
Client Success Stories
Contact
Log inLoginSign up
< BACK TO ALL REPORTS

An impressive win streak for the S&P 500 suggests more upside 

Dean Christians
2024-10-21
For only the 14th time since 1928, the S&P 500 has closed above its 200-day average for 242 consecutive sessions. Similar win streaks saw the world's most benchmarked index rise 85% of the time over the next six months.

Key points:

  • The S&P 500 has now closed above its 200-day average for 242 consecutive sessions
  • Similar win streaks saw the S&P 500 rise 85% of the time over six months
  • Current market breadth indicators suggest a healthier environment than other signal date periods

Consistent uptrends tend to go higher and longer than most expect

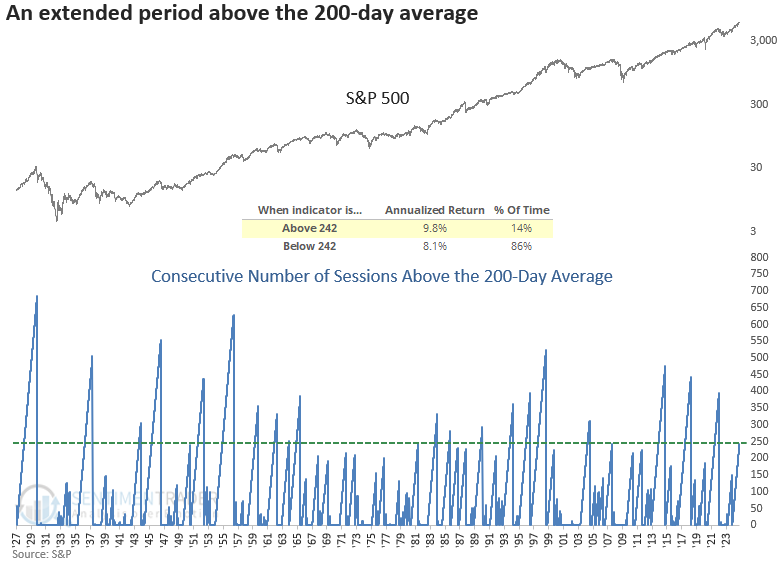
The S&P 500 has closed 242 consecutive sessions above its 200-day moving average. While nothing is critical about this particular number of days, it just happened to be an observation I made over the weekend: consistent momentum of this type has historically led to further upside in the world's most benchmarked index. 

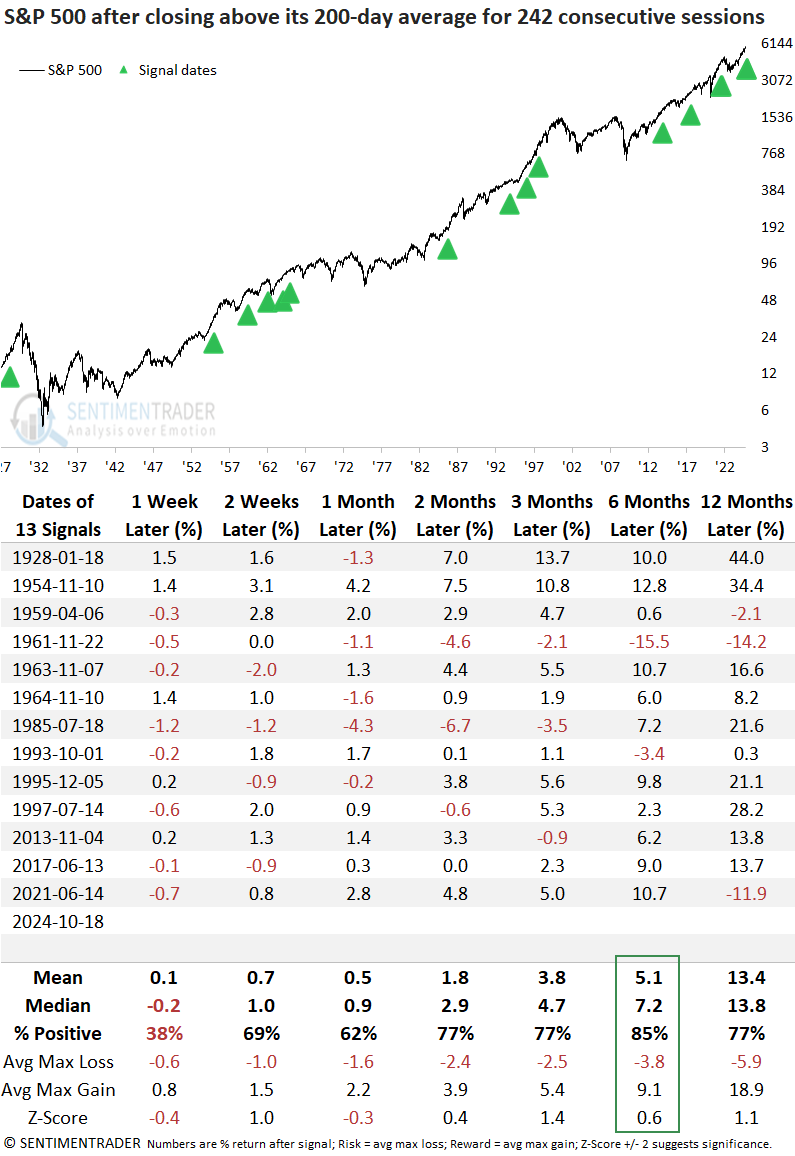
The previous signal occurred in June 2021, and the S&P 500 gained 10.7% over six months. 

As shown in the chart below, the S&P 500 delivers an annualized return of 9.8% when the win streak count surpasses 242 sessions. Conversely, when the streak resides below 242 days, the index yields an annualized return of 8.1%.

Comparable win streaks preceded additional upside for stocks

Whenever the S&P 500 closed above its 200-day average for 242 straight sessions, with the index less than 3% below a record high, the world's most benchmarked index rose 85% of the time over the ensuing six months. 

Although none of the time horizons showed significance compared to random returns, the consistency observed from two weeks to 12 months easily surpassed historical norms, indicating a sustainable uptrend despite what might seem like a long period above the 200-day average. 

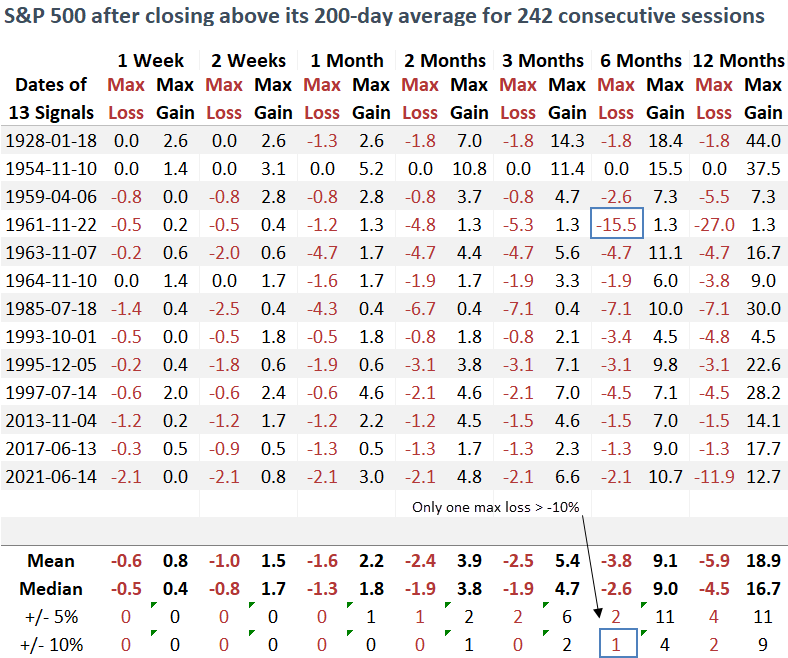
Over the subsequent six months, the S&P 500 experienced just one instance of a maximum loss exceeding 10% and only two precedents surpassing that same downside risk over the following year. 

Historical perspective

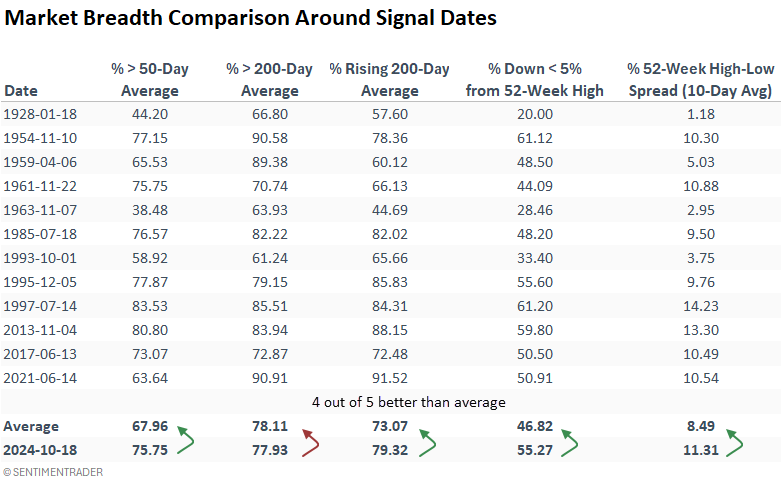
As of the close on October 18, 2024, four out of five market breadth indicators showed more robust participation than the average of all other signals, indicating a more favorable backdrop for the S&P 500 than in previous periods. 

What the research tells us...

Stock indexes continue to grind higher, fueled by improving market breadth and consistent price momentum. In such environments, where nearly all indicators align-whether through expanding new highs, stocks trading above key moving averages, or bullish leadership in cyclical groups-it's tempting to believe that the market can't go any higher. Yet, history shows that markets often defy these expectations, pushing higher for longer than most investors anticipate. While a consolidation around the election is possible, the big picture heading into the most seasonally strong period of the year suggests investors continue to give the market the benefit of the doubt. 

PRODUCTS
SentimenTrader
Trading Tools
Indicators & Data API
‍
Strategies & Scanner
‍
Research Reports
FREE
RESOUrCES
Simple Backtest
Calculator
Simple Seasonality
Calculator
The Kelly Criterion
Calculator
Sentiment Geo Map
‍
Public Research Reports
‍
Education
Sentiment Indicators
‍
Technical Indicators
‍
Pricing
Bundle pricing
‍
FAQ
‍
Announcements
‍
COMPANY
‍
About
‍
In the News
‍
Testimonials
‍
Client Success Stories
CONTACT
‍
General Inquiries
‍
Media Inquiries
‍
Financial Professionals Inquiries
‍
© 2026 Sundial Capital Research Inc. All rights reserved.
Setsail Marketing
TermsPrivacyAffiliate Program
Risk Disclosure: The information and tools provided are for research and analytical purposes only and are not intended as investment advice. Market analysis involves uncertainty, and outcomes may differ from expectations. Users should conduct their own due diligence and consider their individual circumstances before making any financial decisions. Past performance is not necessarily indicative of future results.

Hypothetical Performance Disclosure: Hypothetical performance results have many inherent limitations, some of which are described below. No representation is being made that any account will or is likely to achieve profits or losses similar to those shown; in fact, there are frequently sharp differences between hypothetical performance results and the actual results subsequently achieved by any particular trading program. One of the limitations of hypothetical performance results is that they are generally prepared with the benefit of hindsight. In addition, hypothetical trading does not involve financial risk, and no hypothetical trading record can completely account for the impact of financial risk of actual trading. for example, the ability to withstand losses or to adhere to a particular trading program in spite of trading losses are material points which can also adversely affect actual trading results. There are numerous other factors related to the markets in general or to the implementation of any specific trading program which cannot be fully accounted for in the preparation of hypothetical performance results and all which can adversely affect trading results.

Testimonial Disclosure: Testimonials appearing on this website may not be representative of other clients or customers and is not a guarantee of future performance or success.