
An impressive win streak for the Nasdaq Composite

Key points:
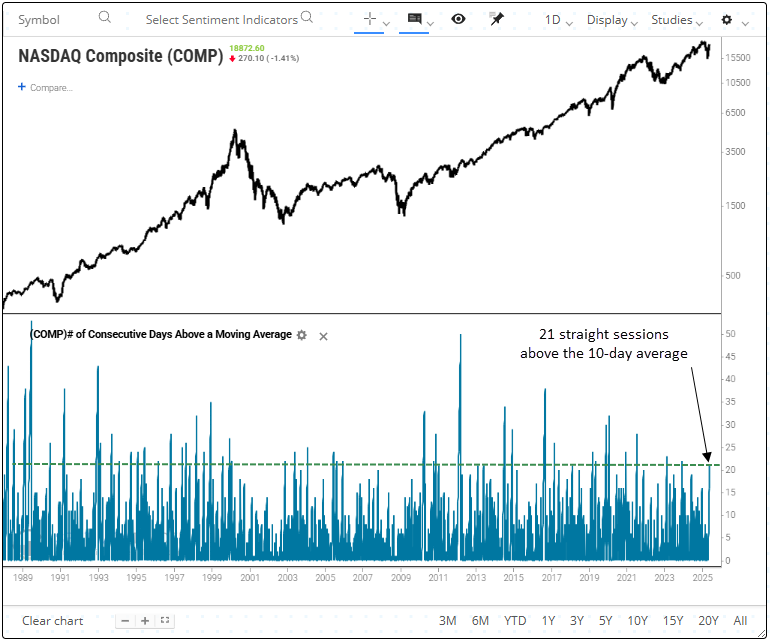
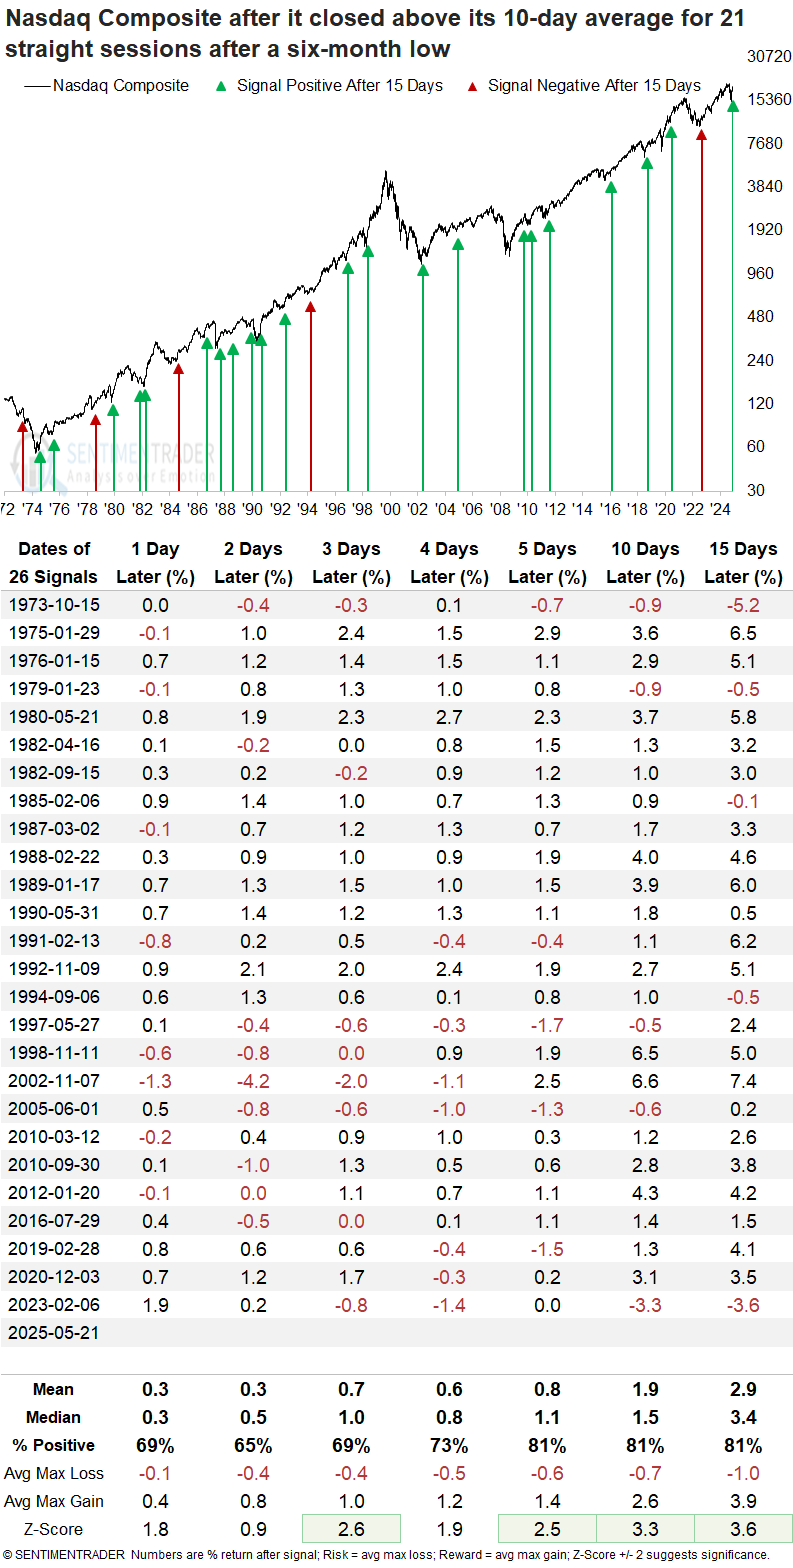
- The Nasdaq Composite closed above its 10-day average for 21 straight days, following a six-month low
- Similar win streaks saw the tech-heavy index rise 92% of the time over the next year
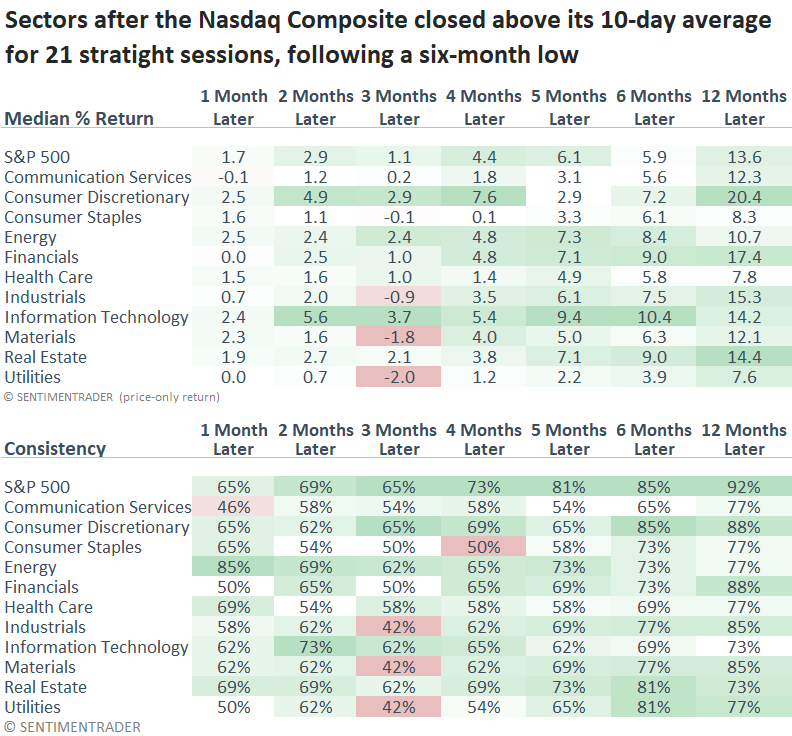
- Technology outperformed the S&P 500 across all timeframes, ranging from one to twelve months
Persistence above short-term moving averages suggests a bull market environment
A component of the TCTM Composite Confirmation Model, which tracks when the S&P 500 closed above its 10-day moving average for 21 consecutive sessions following an extended period below it, came within striking distance of triggering a signal, reaching 20 straight sessions before breaking the streak on Wednesday.
In volatility-driven bear markets, it's rare for indexes to maintain strength above a short-term moving average like the 10-day. Sustained closes above this level typically indicate that buyers are in control and that the path of least resistance has shifted back to the upside.
Although the S&P 500 failed to generate a signal, the Nasdaq Composite did, marking its 27th occurrence since 1973. The last signal in February 2023 preceded significant gains for the index.
In today's report, I used a six-month low rather than an extended period below the average as the reset condition for the Nasdaq signal to isolate context similar to now.
Comparable win streaks preceded a bullish outcome for the Nasdaq
Whenever the Nasdaq Composite sustained above its 10-day average for 21 consecutive sessions following a six-month low, the tech-heavy index displayed outstanding returns and consistency, especially a year later, rising 92% of the time.
Only two instances occurred within the context of a bear market rally: 1973 and 1990.
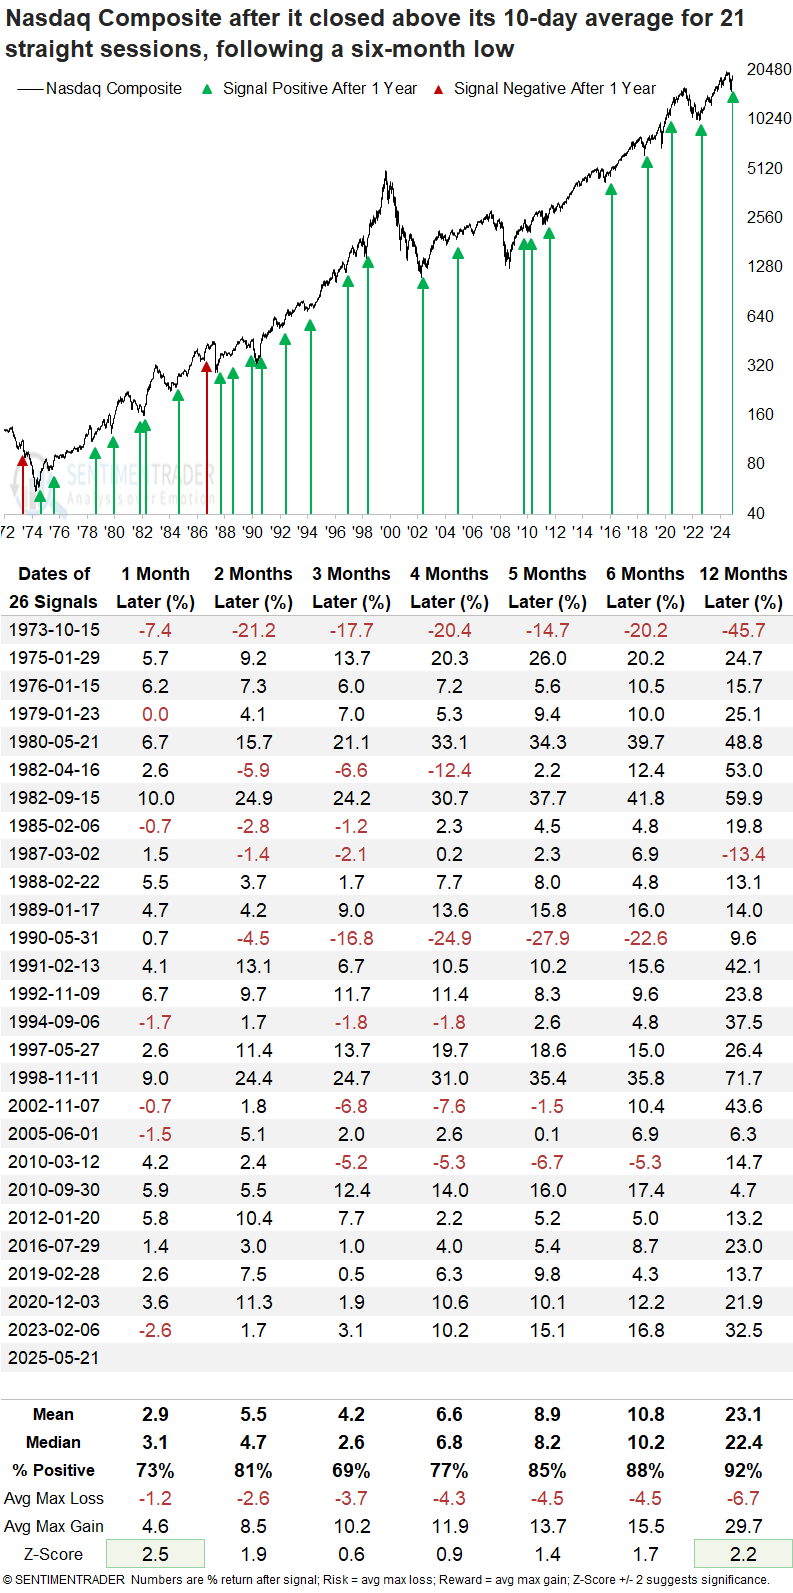
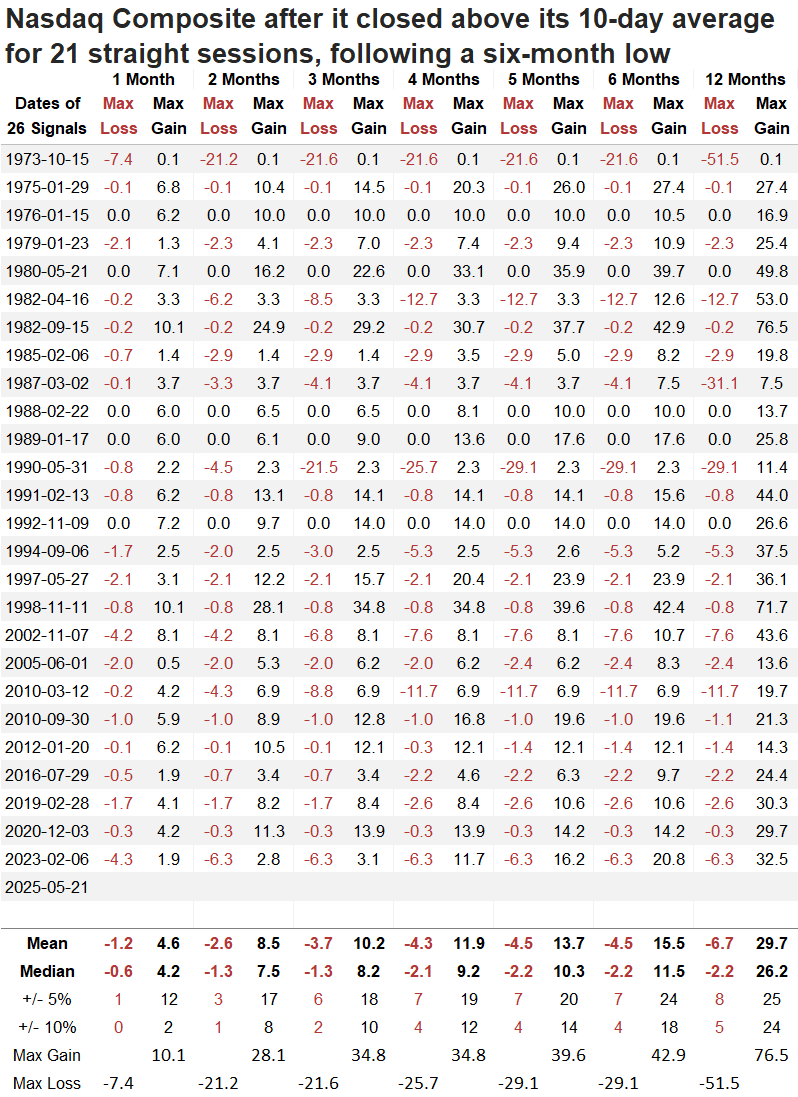
A year later, the Nasdaq Composite declined more than 10% only five times. In contrast, it posted rallies of over 10% in 24 cases, suggesting a favorable risk/reward scenario.
Cyclical sectors-such as consumer discretionary, financials, industrials, and technology-have generally outperformed the S&P 500, while defensive groups lagged. This scenario commonly occurs as indexes transition from a bearish to a bullish environment.
If I apply the signals to a short-term outlook table, the results look solid, although there has been some weakness in the initial three sessions since 1997.
Impressive momentum from technology stocks
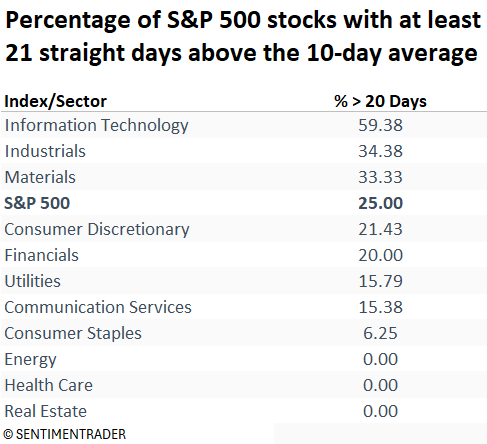
The technology sector dominates the proportion of stocks on a win streak above the 10-day average, with 59% of their members sustaining above the short-term average for more than 20 sessions, indicating bullish price momentum.
A risk to broad participation from this point forward
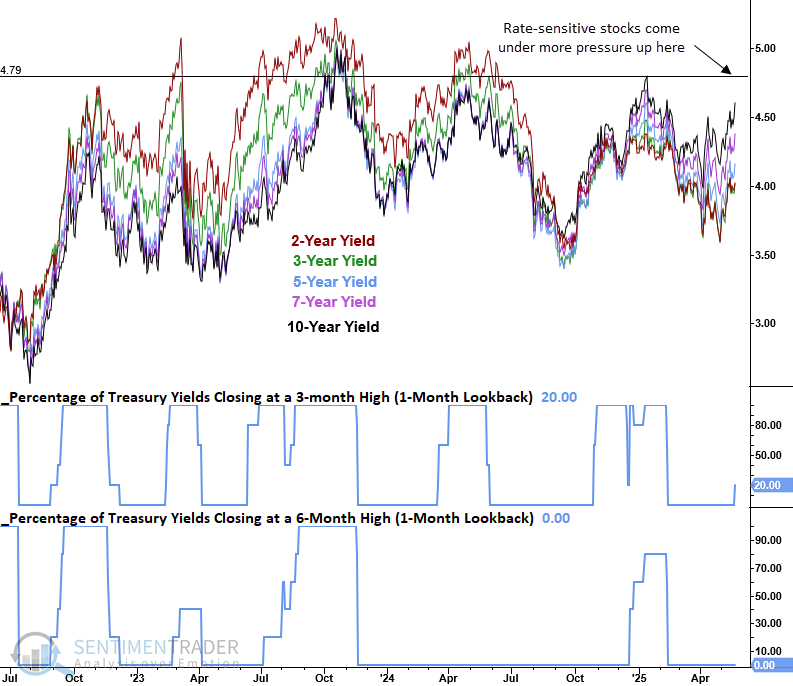
Although the weight of the evidence overwhelmingly skews in favor of the bulls, should yields continue to climb toward the upper end of their multi-year range, broad market participation will likely dwindle as interest-rate sensitive groups, like homebuilders, experience additional pressure.
What the research tells us...
The Nasdaq Composite closed above its 10-day moving average for 21 consecutive sessions, a remarkable show of strength following a six-month low. This sustained momentum above a short-term average is more associated with bull markets than bear markets, reflecting persistent buying interest. Similar occurrences have led to gains in the tech-heavy index 92% of the time over the following year, reinforcing the view that the broader equity market backdrop is likely to remain favorable.
While this and numerous other signals suggest a positive equity market environment over the next six to twelve months, it's essential to recognize that markets do not rise in a straight line. Periodic consolidations and short-term pullbacks are normal and healthy within cyclical advances.