
An important development in U.S. vs. International stocks

Key points
- The U.S. stock market has significantly and consistently outperformed international stocks for many years
- No asset ever enjoys a permanent advantage over another, so this state of affairs will not last forever
- The first sign of a potential reversal has taken place
U.S. vs. them
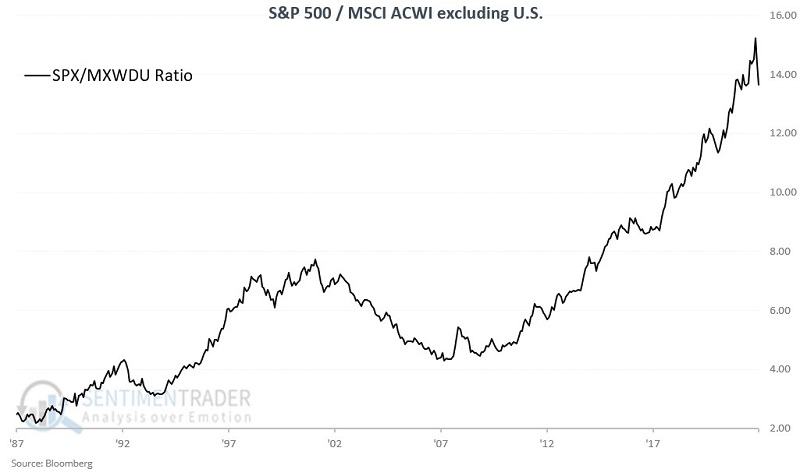
For testing purposes, we will use month-end price-only data for the S&P 500 Index ("SPX") and the MSCI ACWI excluding United States Index ("MXWDU") starting in January 1988. The chart below displays the relative performance of U.S. stocks versus international. Since late 2010, performance has consistently favored U.S. stocks by a significant margin.
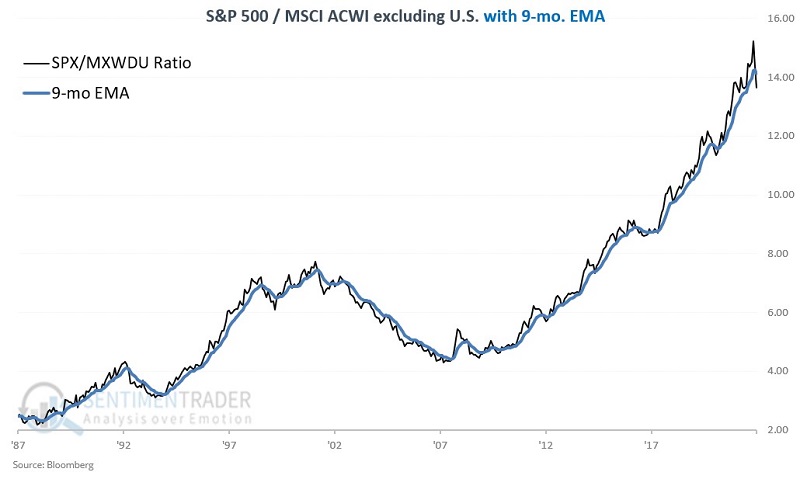
The chart below displays the SPX / MXWDU ratio (black line) and a 9-month exponential moving average (blue line). When the black line is above the blue line, it suggests that SPX is leading and vice versa.
Index performance based on relative strength configuration
Let's look at the performance of the two indexes based on whether the SPX/MXWDU ratio is above or below its 9-month EMA at the end of the previous month. The chart below displays the performance of both indexes when the SPX/MXWDU ratio is above the 9-month EMA.
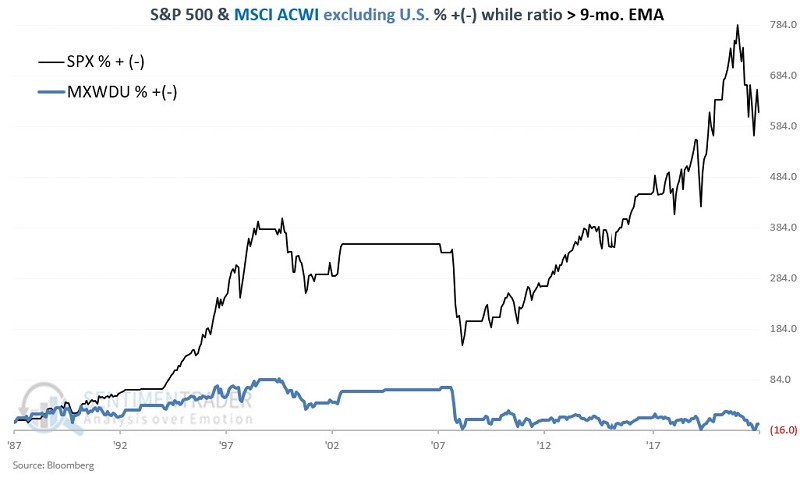
From December 1987 through December 2022, while the ratio was above the 9-month EMA SPX gained +612.2 while MXWDU lost -3.6%.
The chart below displays the performance of both indexes when the SPX/MXWDU ratio is below the 9-month EMA.
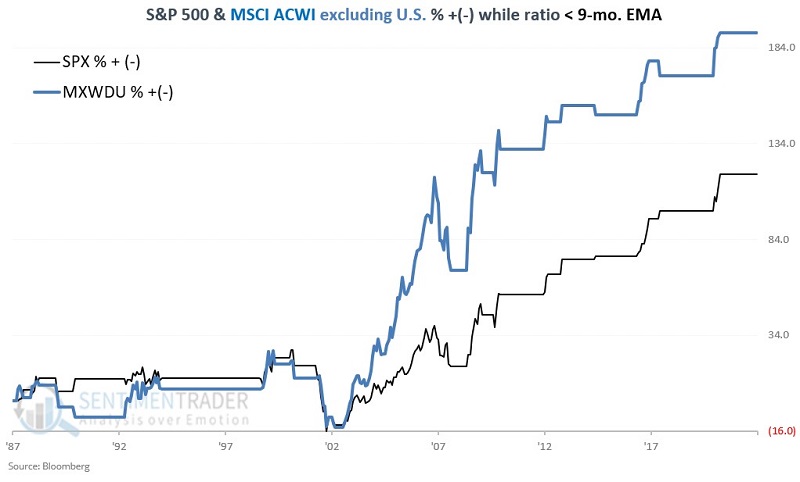
From December 1987 through December 2022, while the ratio was below the 9-month EMA, SPX gained +118.2 while MXWDU gained +192.0%.
Putting the two together
A simple model can be created by holding SPX when the ratio is above the 9-month EMA and holding MXWDU when the ratio is below the 9-month EMA. As a baseline, we will compare switching results to a strategy that splits 50/50 between SPX and MXWDU and rebalances to a 50/50 split at the end of each year.
The results appear in the chart below. The black line represents the switching strategy, while the blue line represents the buy/hold/rebalance approach.
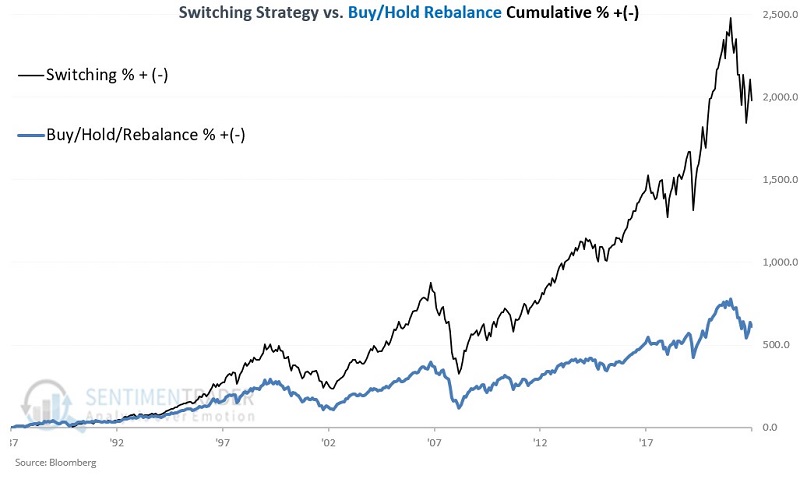
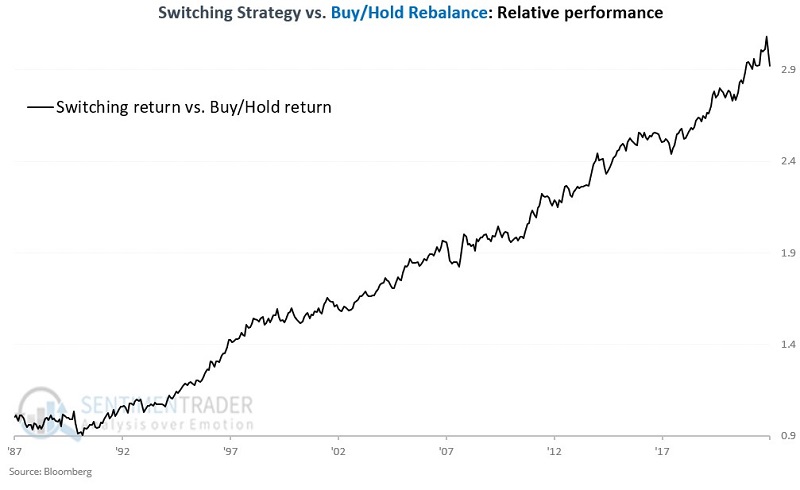
The switching strategy registered a hypothetical gain of +1,979.3% versus +611.4% for buy/hold/rebalance. The chart below divides the cumulative growth of $1 for the switching strategy by the cumulative growth of $1 for the buy/hold/rebalance strategy.
The current status has changed
For the first time since March 2021, this simple switching strategy once again favors international stocks as the SPX/MXWDU ratio dropped below the 9-month moving average at the end of December 2022.
What the research tells us…
No stock, index, market, or security ever holds a permanent advantage over any other asset. There is a constantly fluctuating interplay between all tradable assets. Tracking relative performance can offer clues as to which of two assets is presently leading (or lagging). U.S. stocks enjoyed a significant performance advantage over international stocks for over 12 years. The simple switching method above suggests that the "worm has turned" and that momentum now favors international stocks. The one caveat is that there is no guarantee that this new trend will play out meaningfully. The method described above is essentially a trend-following approach, and trend-following strategies are prone to whipsaws.
Regardless, the real takeaway for investors is to fight the recency bias established over the last 12 years that has led many investors to focus solely on U.S. stocks and to eschew international stocks. If the tide is indeed turning to favor international stocks, they may lead for several years.