
An important clue from leading economic indicators

Key points
- The Conference Board Index of Leading Economic Indicators ticked higher in the latest reported month after eight consecutive months of decline
- This simple reversal has typically been a positive sign for both stocks and the overall economy
- While this is not a "trading system" the recent uptick suggests positive things for stocks and the economy in 2025
An upside reversal in the leading indicators
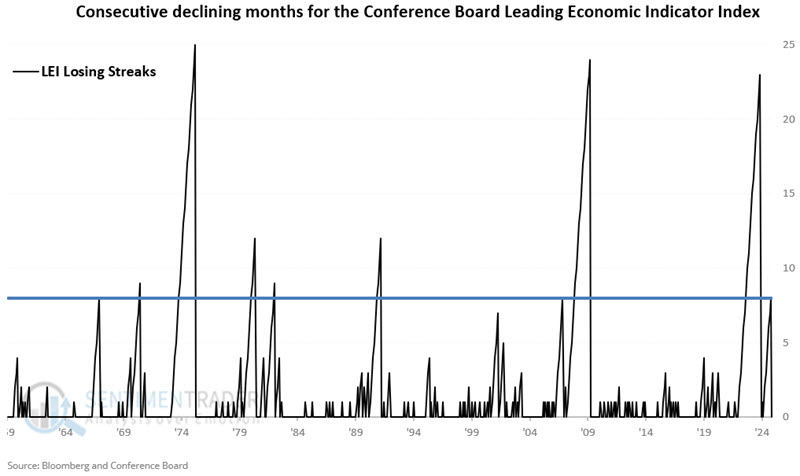
The proprietary Conference Board Index of Leading Economic Indicators (LEI) most recent report came out in mid-December and showed an upside reversal for November 2024. This follows eight consecutive months of decline. The table below displays a history of monthly losing streaks for the index.
This simple reversal has tended to portend good things for stocks and the economy in the year ahead.
A look at stock performance
For testing purposes, we measure performance beginning at the end of the month when the most recent LEI data was released. For example, November 2024 index data was released in mid-December 2024. For testing stock and economic performance going forward, we will use December 31st, 2024 as our test date for the November 2024 data.
For testing stock performance, we will apply the following rules:
- A favorable signal for stocks occurs when the LEI reverses higher for one month after declining for at least eight consecutive months
- The "buy" date is the last trading day of the month when the upside reversal in LEI was reported
- For this test, we will buy and hold the S&P 500 for twelve months after a signal
From May 1967 through December 1967, the LEI declined each month (these results were reported in June 1967 through January 1968). In January 1968, the LEI finally reversed higher (which was reported sometime during February 1968).
As a result, by the rules above, a "favorable" signal occurred at the end of February 1968, at which point we would buy the S&P 500 Index and hold it for twelve months.
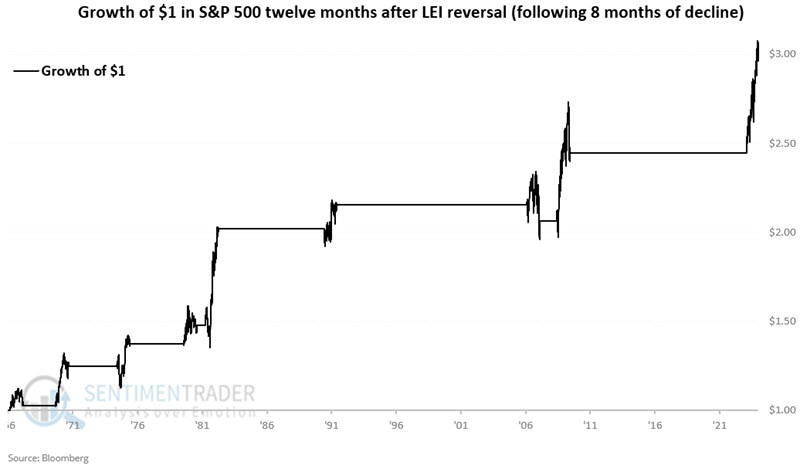
The chart below displays the hypothetical growth of $1 invested in the S&P 500 Index only during the purportedly favorable periods highlighted in the table above.
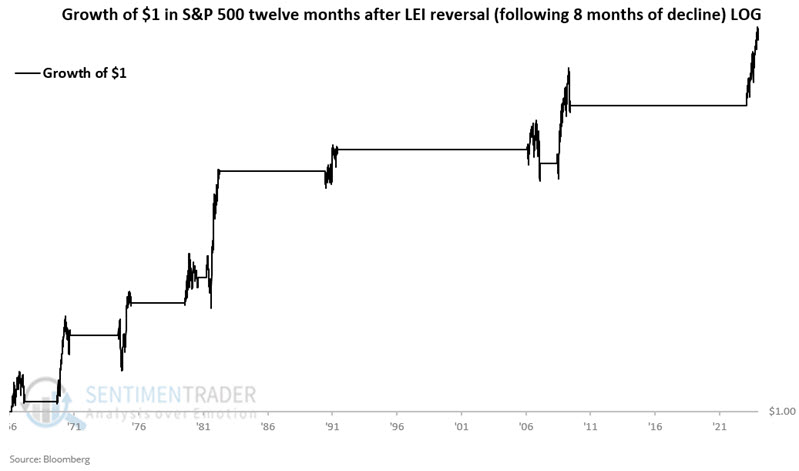
The chart below displays the same results on a logarithmic scale.
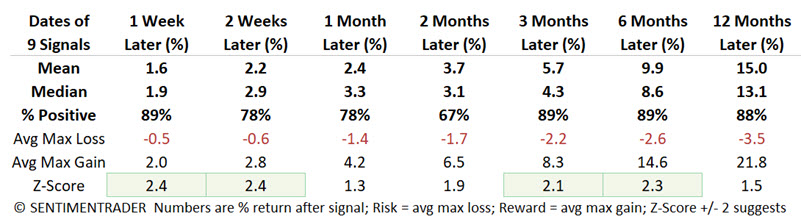
The table below displays S&P 500 results for various timeframes following previous signals.
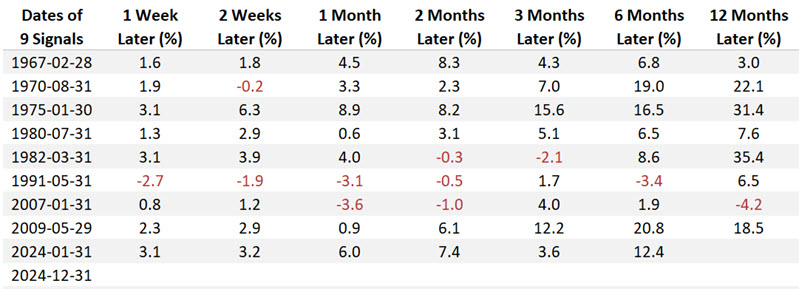
The table below summarizes S&P 500 results for various timeframes following previous signals.
A closer look at the economy
We will use the Coincident Economic Activity Index (CEAI) to track the economy. The chart below sets a baseline of 1.00 starting in 1967 and shows the monthly growth/contraction of the CEAI only during the twelve months following each of the dates shown in the tables above.
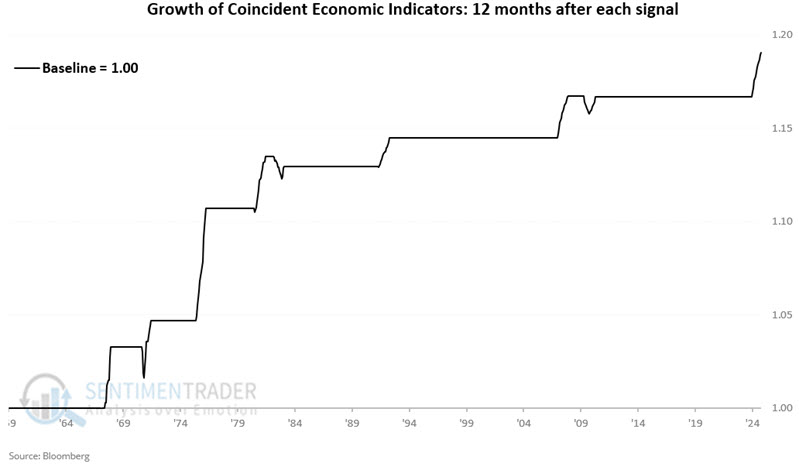
The CEAI did experience slight temporary declines during the twelve months following the 1982-03-31 signal (-0.5%) and the 2009-05-31 signal (-0.1%). The good news is that during these two periods, the stock market anticipated much greater future economic growth (which it got) and rallied sharply (+36.6% and +18.5%, respectively). So the "economic declines" were more anecdotal than meaningful in any real sense.
What the research tells us…
History suggests that the latest uptick in the Leading Economic Index bodes well for both the economy and the stock market. That said, this type of indicator is best utilized as "weight of the evidence" and not necessarily as a standalone trading model. Take it as a "good sign", but not as a "sure thing."