
An extremely rare overbought condition in utilities

Key points:
- Market breadth and relative performance indicators for utilities have reached a critical juncture
- Similar conditions suggest investors should be mindful that the sector could reverse to the downside
- Following comparable precedents, utilities underperformed the broad market across all time horizons
A bad overbought condition
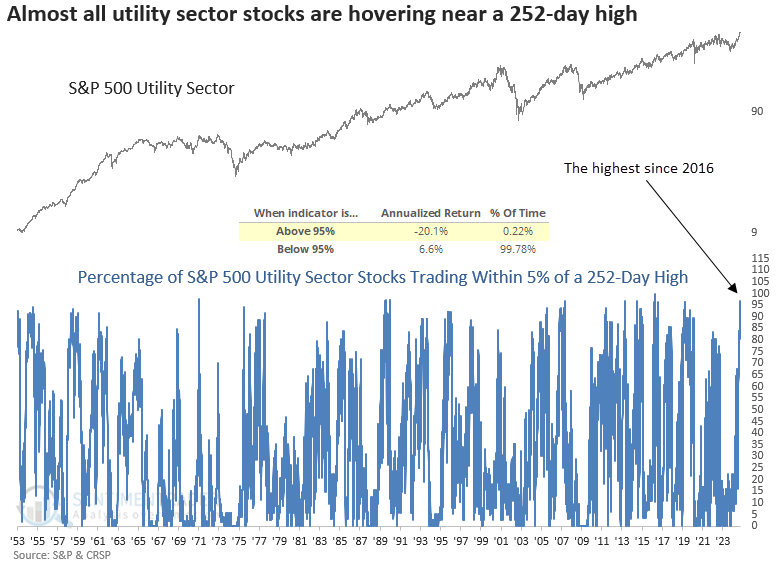
The S&P 500 Utilities sector has surged nearly 20%, outpacing the S&P 500 by more than 16% in the past three months. Whether this stems from the Fed policy shift, a slowing job market, or anticipated energy demands driven by artificial intelligence, it's anyone's guess.
Regardless, the sector has reached a critical crossroads as several indicators suggest the group is overextended to the upside. One of those indicators is the percentage of S&P 500 Utility sector stocks trading within 5% of a 252-day high, which reached 96%-a threshold last surpassed in 2016 and recorded in fewer than 1% of trading sessions since 1953.
As illustrated in the following chart, readings above 95% produced annualized returns of -20% for the sector.
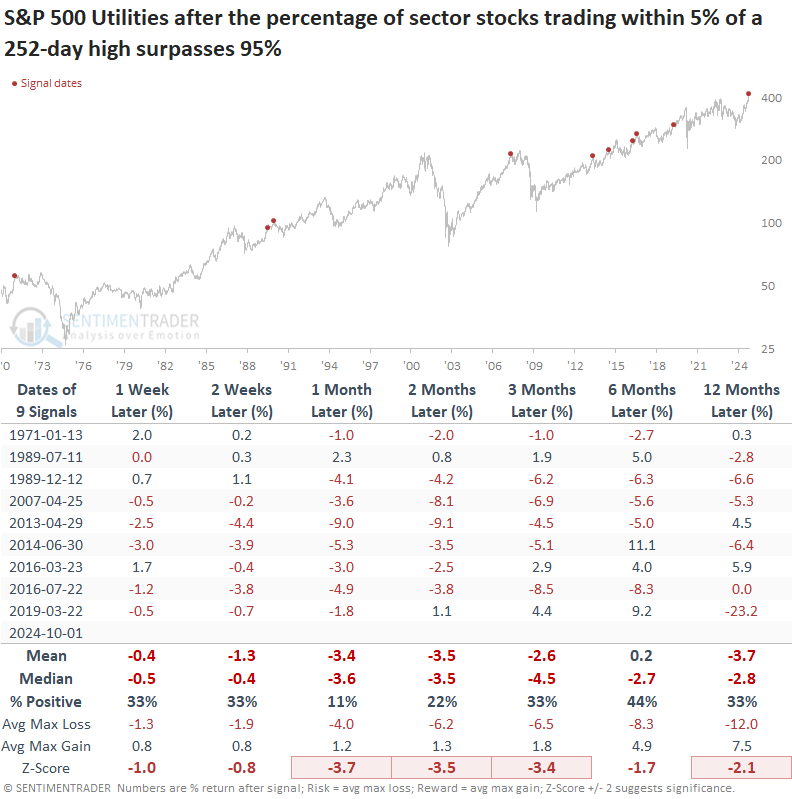
Similar overbought conditions preceded a negative outlook for utilities
Whenever the percentage of S&P 500 Utility sector stocks trading within 5% of a 252-day high surpassed 95%, the extreme overbought condition was likely to mark the end of a favorable period for the utility sector. Over the following year, the group exhibited unfavorable returns and win rates. The situation was especially dire in the near term, with the sector declining 89% of the time in the subsequent month.
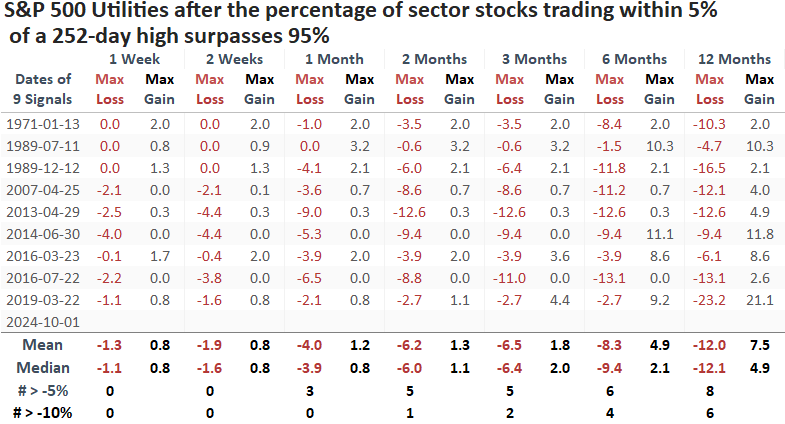
The average and median maximum loss exceeded the maximum gain across all time horizons, underscoring that risk overshadowed any potential reward.
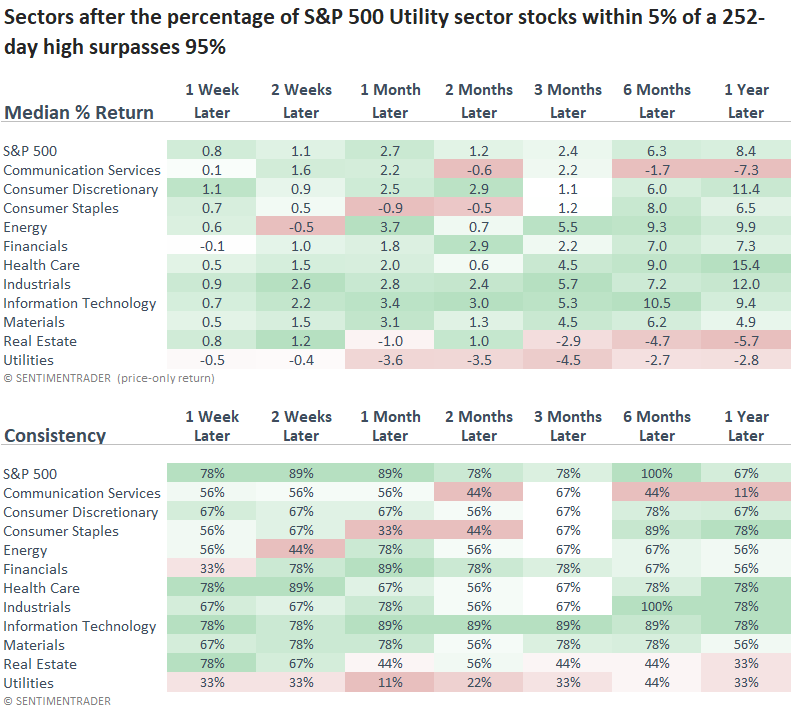
The Utility sector underperformed the S&P 500 across all time frames and most other groups over several intervals. Interestingly, the S&P 500 rose 100% of the time over the subsequent six months, suggesting that the overbought condition in utilities was a bull market phenomenon and not some ominous sign.
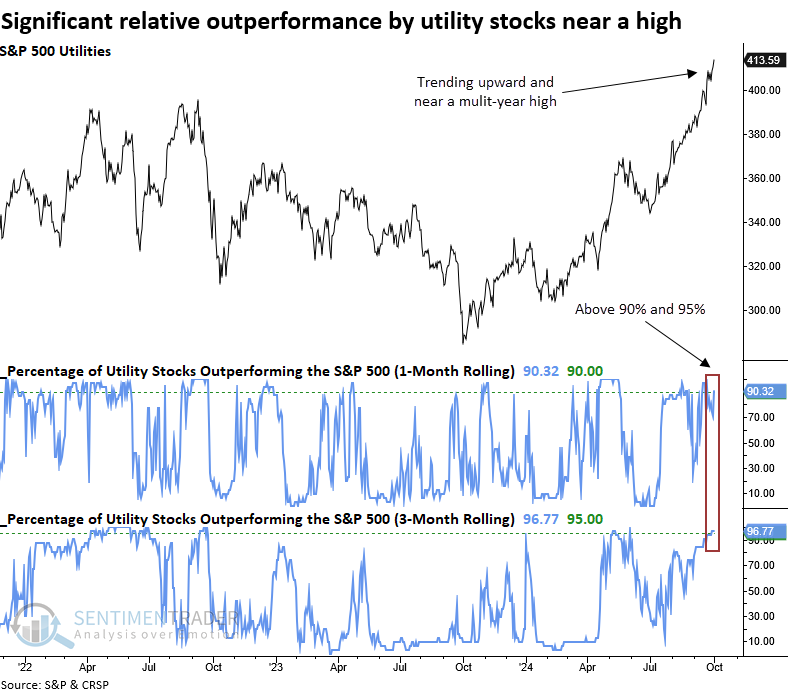
Significant relative outperformance by utilities is unlikely to persist
Defensive sectors such as utilities typically outperform during sell-offs, but it's uncommon for them to lead a broad market rally as they have over the past three months.
For only the 14th time since 1960, the percentage of S&P 500 Utility sector stocks outperforming the S&P 500 over one and three months surpassed 90% and 95%, respectively, as the sector closed within 0.5% of a 3-year high.
Following similar periods of relative outperformance by utility stocks, the S&P 500 utility sector tended to decline over the subsequent three months, with several time frames exhibiting significantly worse returns than random returns over the study period.
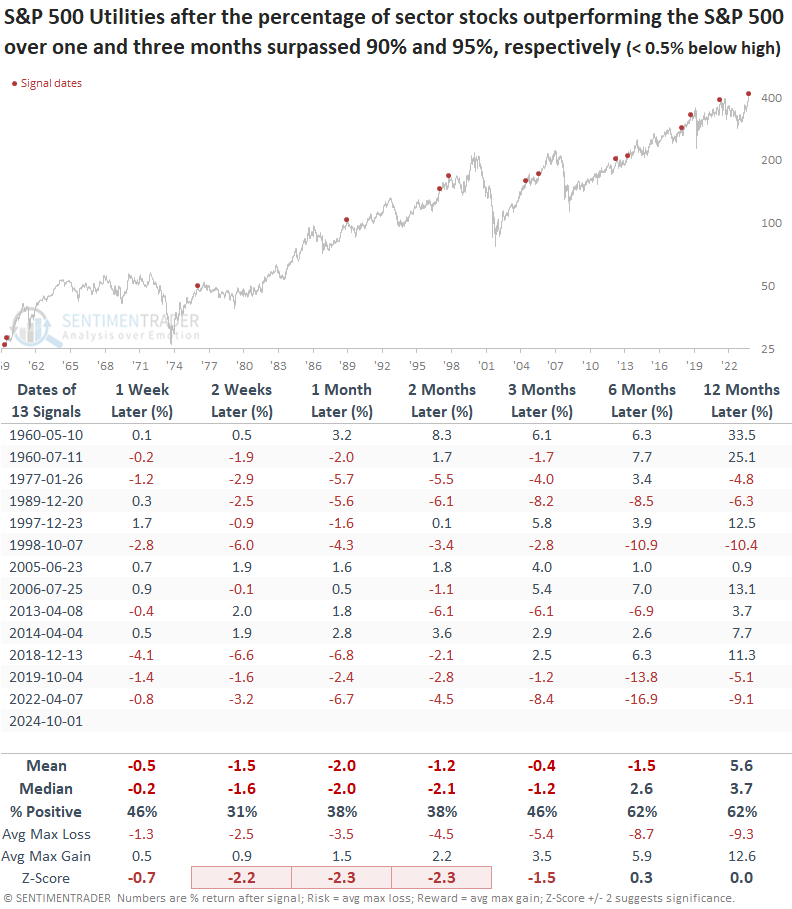
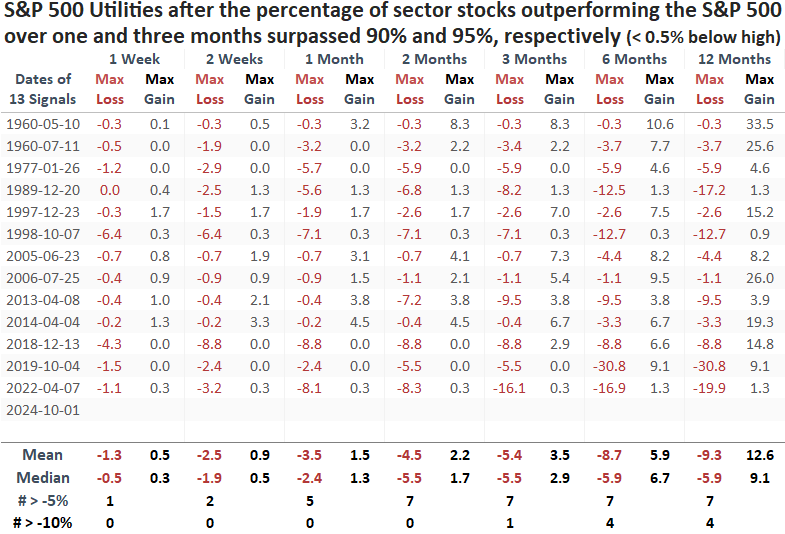
Over the following three months, the average and median maximum losses exceeded the maximum gains, highlighting a clear imbalance where risk far outweighed reward.
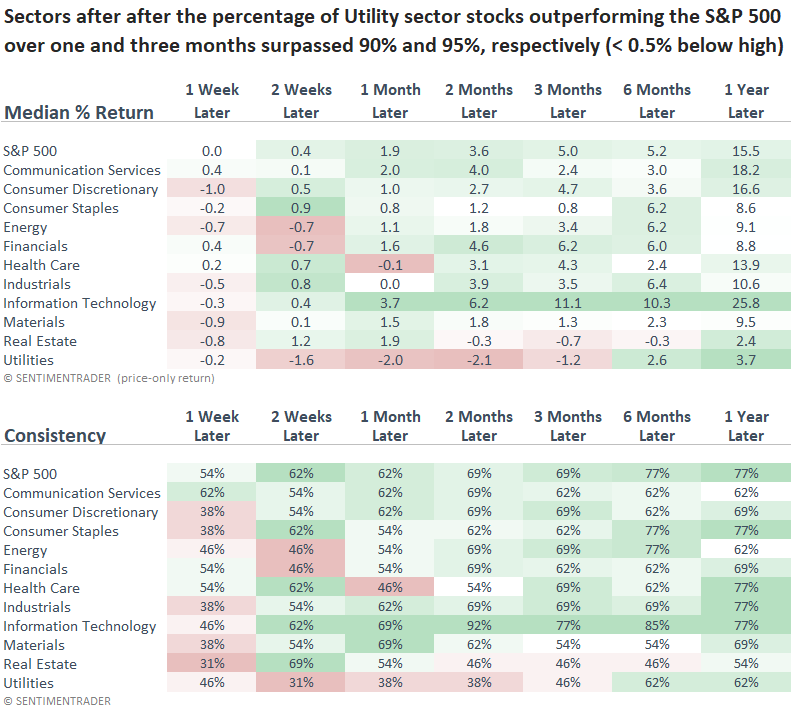
The S&P 500 Utility sector underperformed the S&P 500 across all time intervals. Furthermore, it was the second worst-performing group the following year, trailing only Real Estate.
Like the overbought signal, the overall market saw solid performance, suggesting that utilities' recent outperformance may have been influenced by a macro factor that benefitted most stocks, such as falling rates.
A dilemma regarding utilities
The relative strength timing system for utilities, found on the website's strategies page, initiated a long position in the sector on 2024-05-15. Since that date, the S&P 500 Utility sector has rallied 12.65%, far outpacing the S&P 500's 7.55% return.
For those holding XLU, consider taking partial profits now and waiting for a sell signal from the timing model to close out the rest of your position.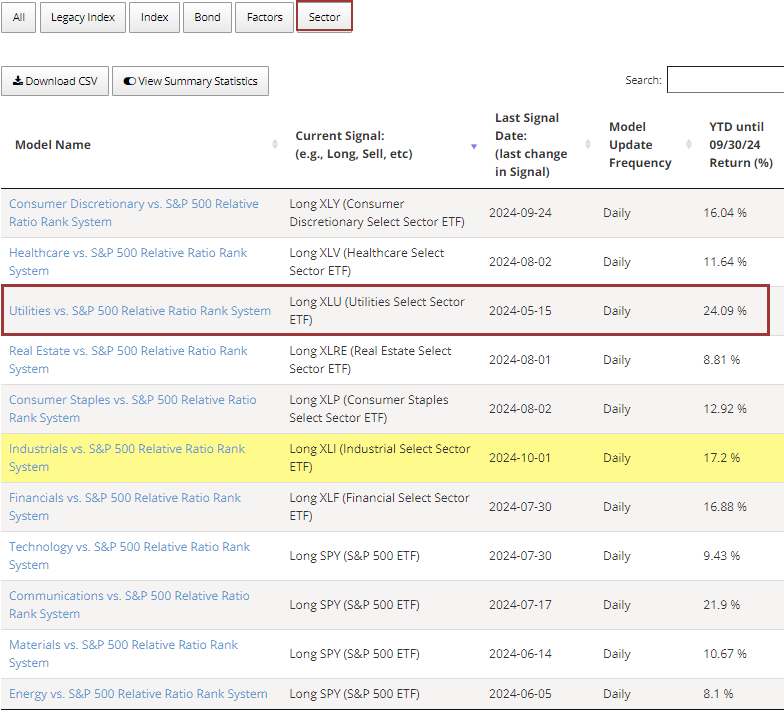
What the research tells us...
Over the last three months, the S&P 500 Utility sector has rallied significantly, easily outpacing the S&P 500. However, several indicators now suggest it may be poised for a downside reversal. Following similar overbought and relative performance conditions, the outlook for utilities was unfavorable on an absolute and relative basis, especially over short-and medium-term horizons.
If it's different this time, it's likely because the Fed cut rates for the first time following a tightening. Under that scenario, Utilities typically exhibit a positive outlook.