
An extremely bullish signal from value stocks

Key points:
- The percentage of annual highs for stocks in the Financial and Industrial sectors exceeded 25%
- Similar expansions in new highs preceded a 97% win rate for the S&P 500 over the following year
- Financial and Industrial sector stocks maintain excellent absolute and relative trend score rankings
"The inside of the stock market is the best economist I know" - Stan Druckenmiller
While examining the market breadth page on the website Thursday evening, I noticed a substantial increase in annual highs for Financial and Industrial sector stocks during Thursday's session, with both groups surpassing 25% of total issues. For perspective, the Healthcare sector recorded the third-highest reading at 10.94%.
With the introduction of our new backtest engine, users can now assess events like this one by leveraging the multi-condition feature. In conducting this study, I utilized the multi-condition same bar function to uncover precedents when the percentage of annual highs exceeded 25% simultaneously for both sectors.
As the arrows on this chart depict, an expansion in annual highs for Financial and Industrial sector stocks, like now, typically aligns with broad market uptrends.
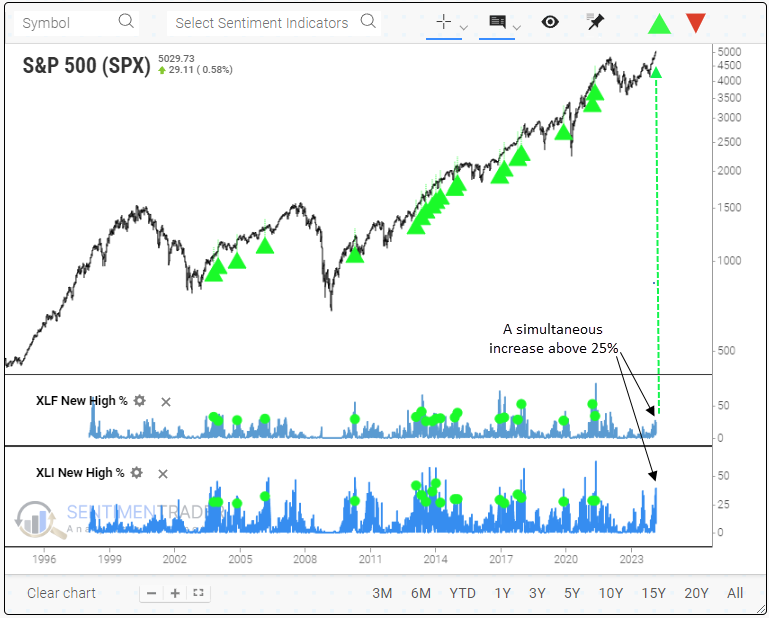
Despite our website data provider indicating annual highs surpassing 25% in both sectors, the vendor responsible for calculating breadth series for a more extensive database reported slightly fewer new highs for Financials at 23.94%. Nevertheless, recognizing the substantial historical depth in the non-website data, I opted to rely on that series for the outlook table provided below.
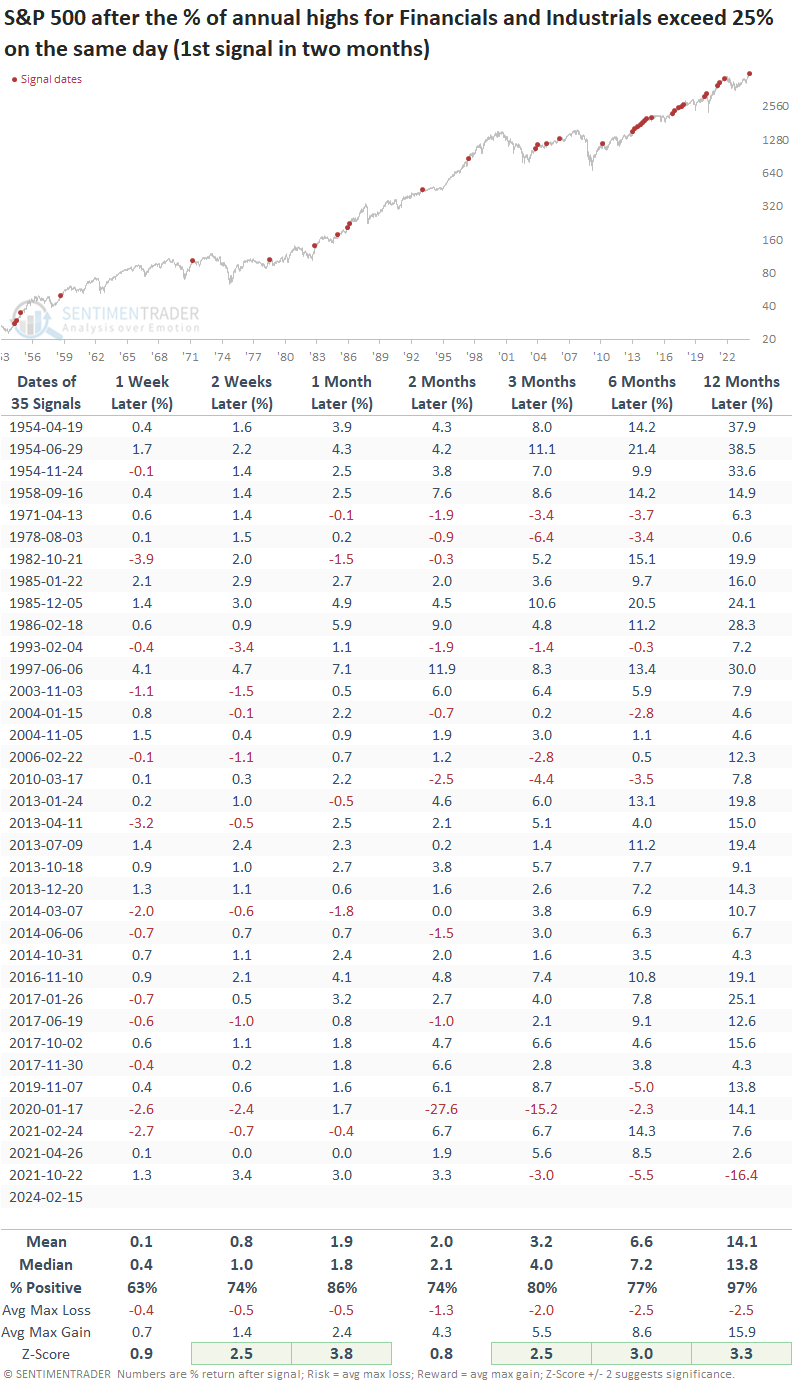
Similar expansions in annual highs preceded outstanding results for the S&P 500
When both Financial and Industrial sector stocks recorded annual highs surpassing 25% concurrently, the world's most benchmarked index displayed exceptional returns, win rates, and z-scores. A year later, the S&P 500 was higher in all but one case.
Using the backtest engine data shows a 100% win rate a year later.
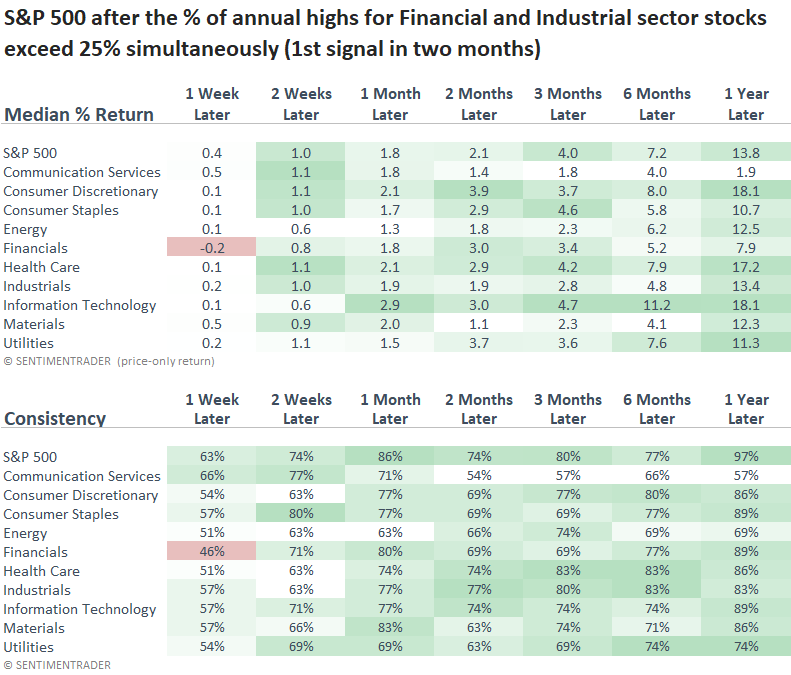
Over the following year, Financials underperformed the S&P 500 while Industrials almost kept pace with the large-cap index. The frequency of signals since 2009 might be a factor in the relative underperformance for both sectors, given that it has been a bull market driven by growth stocks. However, it's crucial to recognize that a sector's failure to outperform a benchmark doesn't preclude investors from discovering potential opportunities within a given group.
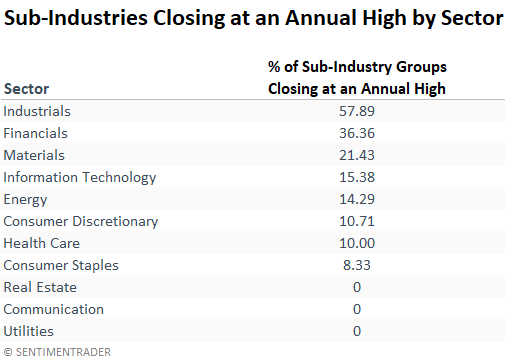
A significant number of S&P 1500 sub-industry groups within the Industrial and Financial sectors closed at an annual high on Thursday, confirming the breakout in individual stocks.
Absolute and Relative Trends
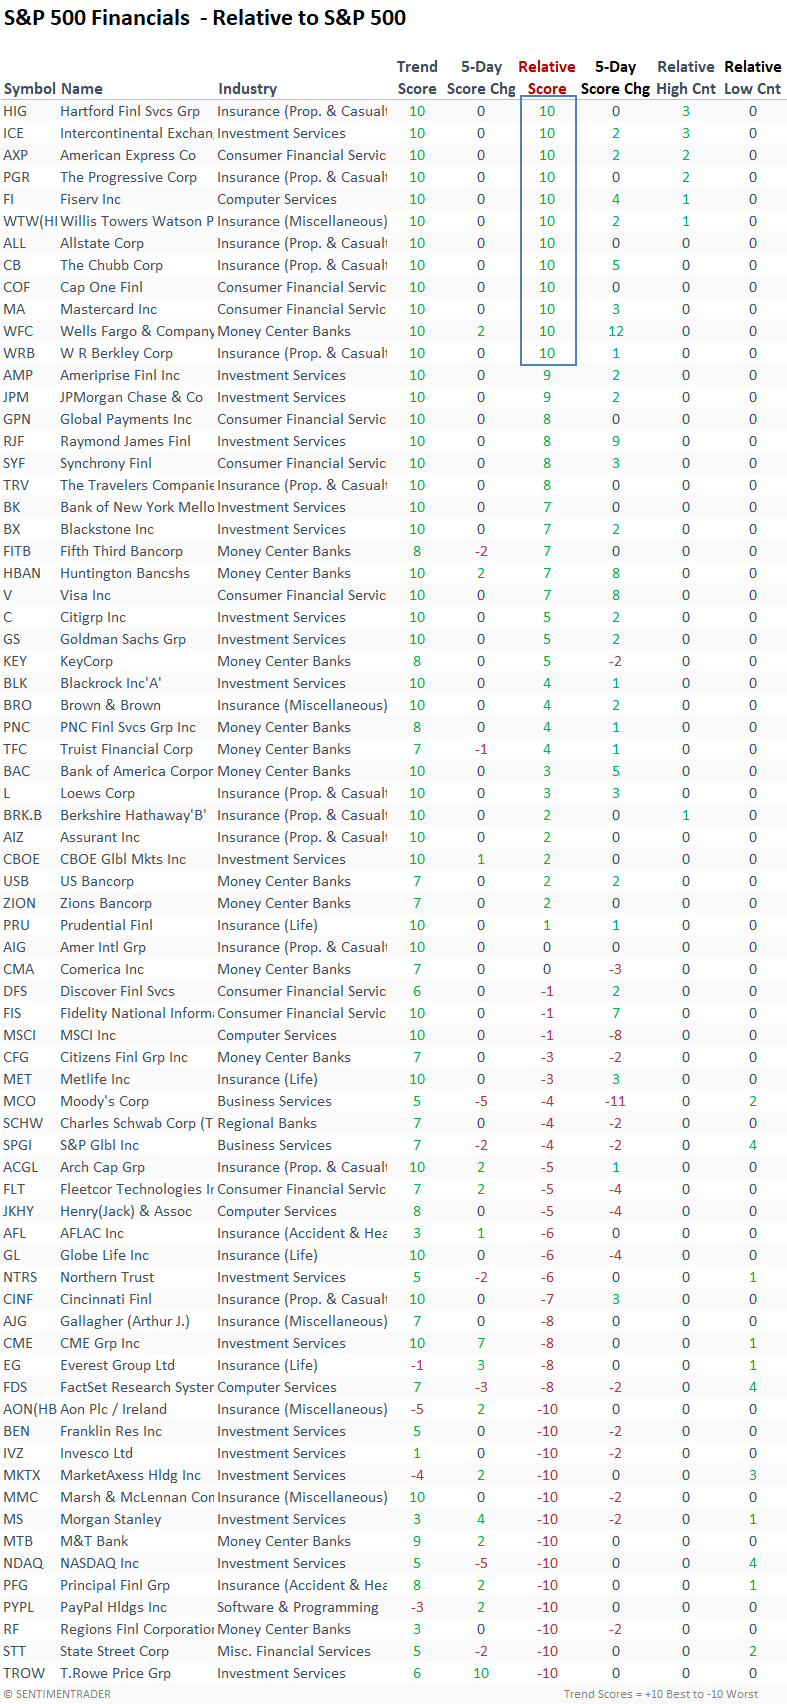
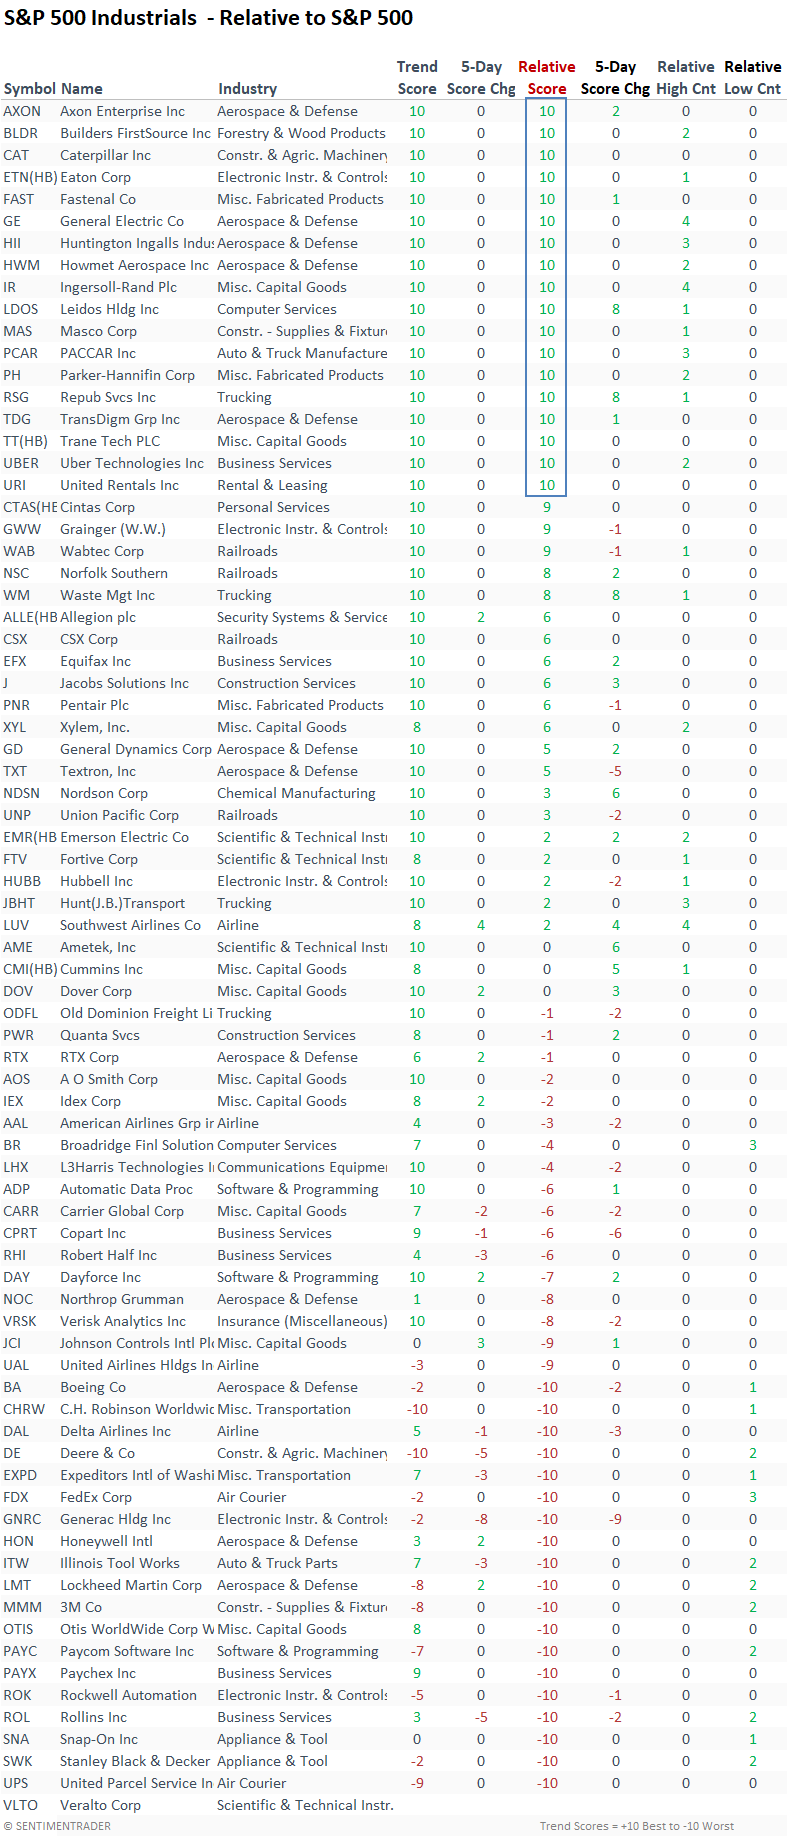
Digging beneath the surface of indexes or sectors can provide a broader perspective into underlying trends within a group. Financial and Industrial stocks, along with Technology, rank at the top of several absolute and relative trend categories.
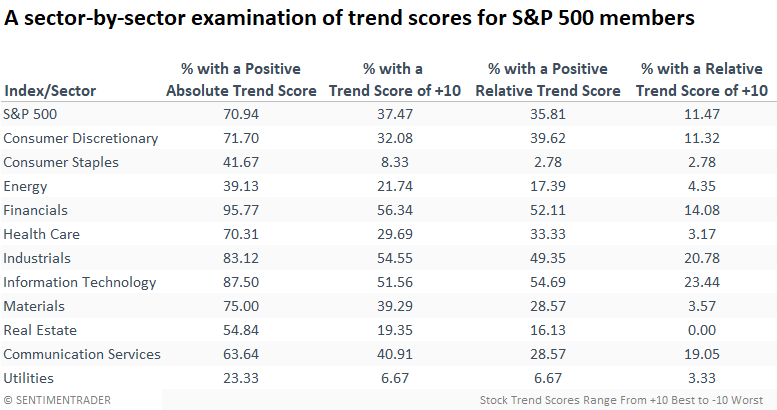
Property and casualty insurance stocks continue to maintain excellent trend scores, whereas traditional asset managers struggle on a relative basis.
Within Industrials, a diverse group of industries maintain perfect absolute and relative trend scores of ten. Over the past week, several Aerospace and Defense stocks have registered a 1-month relative high versus the S&P 500.
What the research tells us...
The research team has highlighted on numerous occasions a deterioration in short-term market breadth indicators. While knowing the exact reason is nearly impossible, an educated guess most likely revolves around higher yields and a strengthening dollar due to a resilient economy. However, throughout history, macro conditions rarely align at once for an extended period, which is why some stocks win and others lose in uptrends. With an abundance of stocks in the Industrial and Financial sectors registering annual highs simultaneously, a long-term view of market breadth suggests we should maintain a bullish outlook despite some short-term concerns.