
An expansion in annual lows typically signals further downside in stock prices

Key points:
- The percentage of S&P 500 stocks registering a 252-day low spiked above 18%
- Similar expansions in annual lows suggest the S&P 500 could struggle over the following year
- Two breadth composites show no signs of an oversold condition
More often than not, stock indexes bottom when new lows contract, not expand
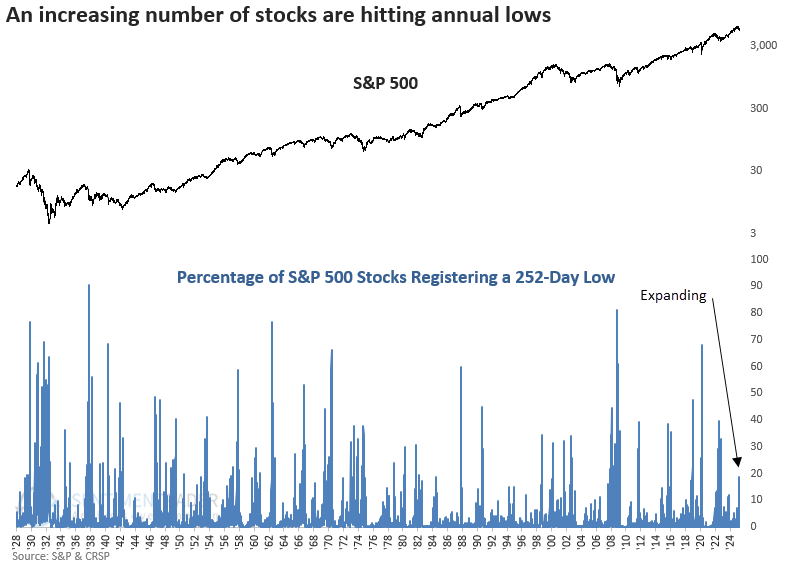
The percentage of S&P 500 stocks hitting 252-day lows has surged above 18%, marking the highest reading since the depths of the 2022 bear market. This sharp expansion in new lows signals broad internal weakness and reflects growing risk aversion among investors.
Historically, environments where new lows are rising, not falling, tend to be fraught with downside risk. Rather than rushing in, it has often paid to wait for a contraction in new lows, which typically signals that selling pressure is abating and a more favorable risk/reward backdrop is taking shape. Until that happens, caution is warranted.
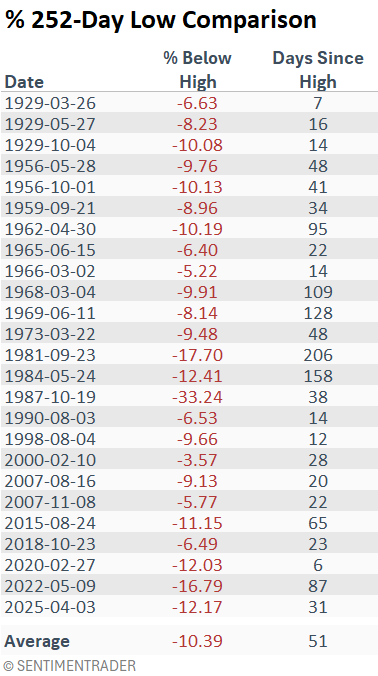
Since 1929, there have been 25 instances when annual lows increased above 15% (I used a slightly lower threshold to capture more precedents) for the first time following an all-time high. However, some of these occurred when the S&P 500 was already down more than 15% or well beyond 50 trading days from its peak.
To focus on more relevant historical parallels, I narrowed the criteria to include only those cases where the S&P 500 was down less than 15% or within 50 days of its peak. Consequently, several instances, like 1981, in the following table, were excluded from the study.
Similar expansions in annual lows suggest an unfavorable outlook for stocks
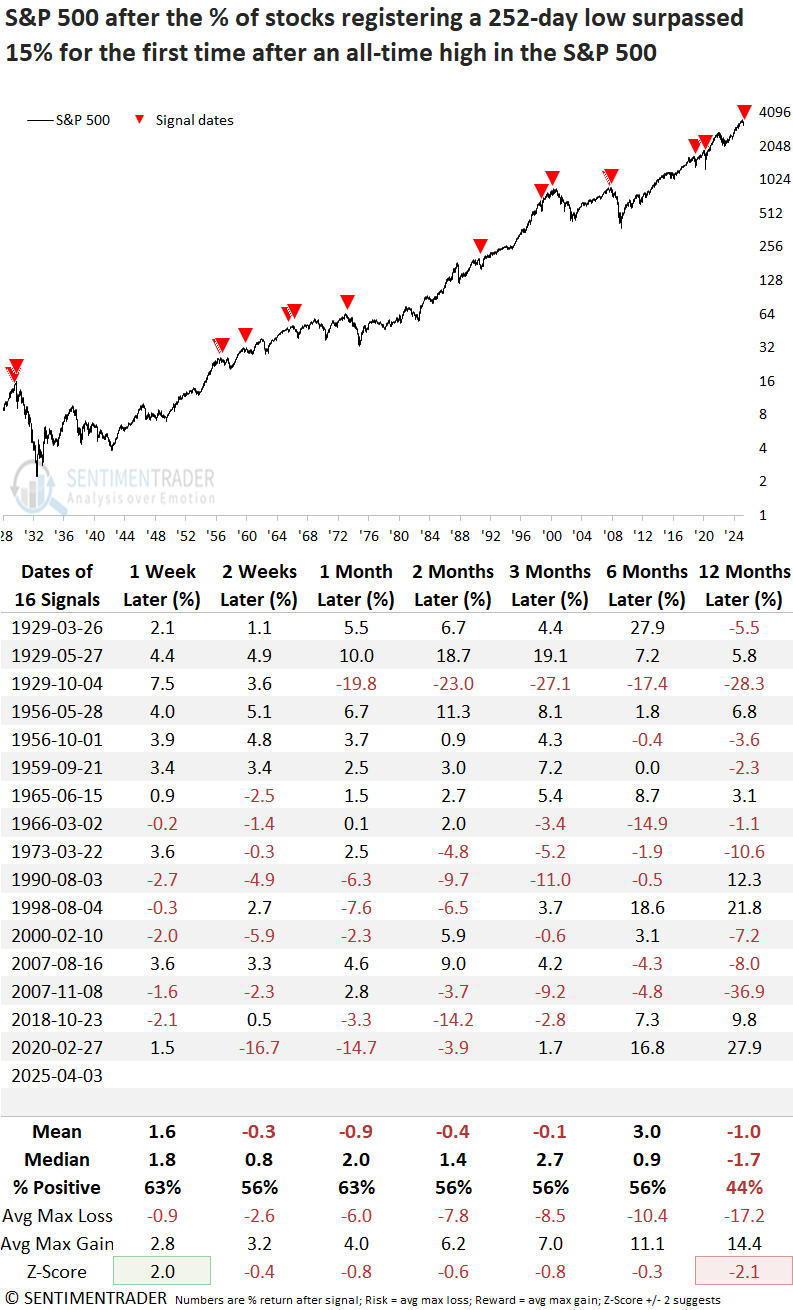
When over 15% of S&P 500 constituents hit a 252-day low for the first time following an all-time high, while the index remained near its peak, the world's most benchmarked index tended to falter over the following year, posting more losses than gains at the one-year mark.
At some point in the next year, the world's most benchmarked index was lower in 14 out of 16 cases.
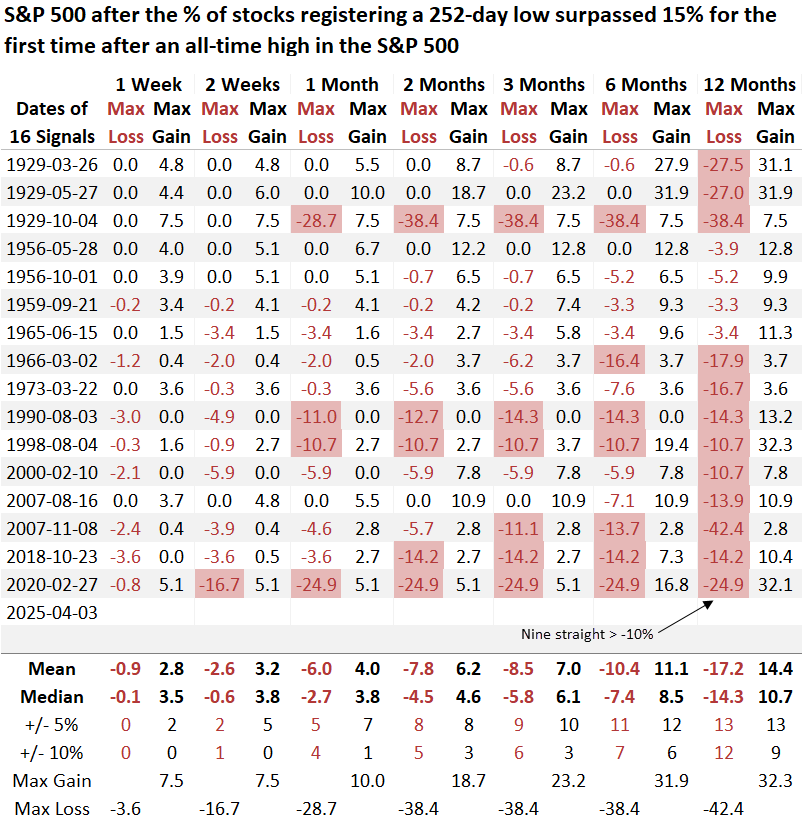
Over the following year, the maximum loss surpassed -10% in 12 out of 16 cases, including each of the last nine signals starting in 1966. By comparison, just 9 of 16 rose more than 10%, underscoring an unfavorable risk-reward profile.
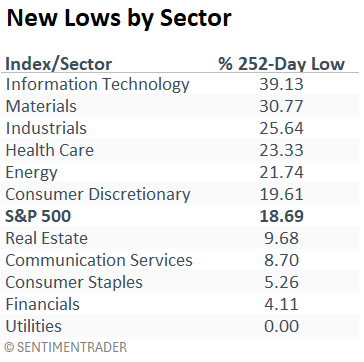
Which sectors are driving the expansion in new lows
The rise in annual lows is concentrated mainly in cyclical sectors, while defensive groups remain relatively untouched. Historically, significant drawdowns tend to culminate in broad-based selling, including defensive names - a pattern worth watching.
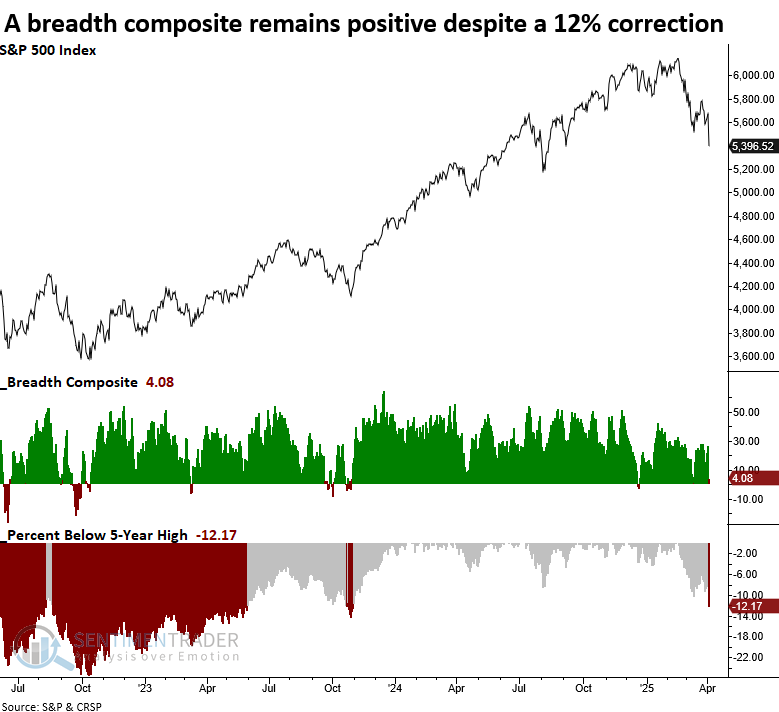
Lacking an oversold condition
Even with the market pulling back 12%, the resilience in defensive groups keeps my breadth composite in positive territory, an unusual scenario. Given today's price action, it should turn negative.
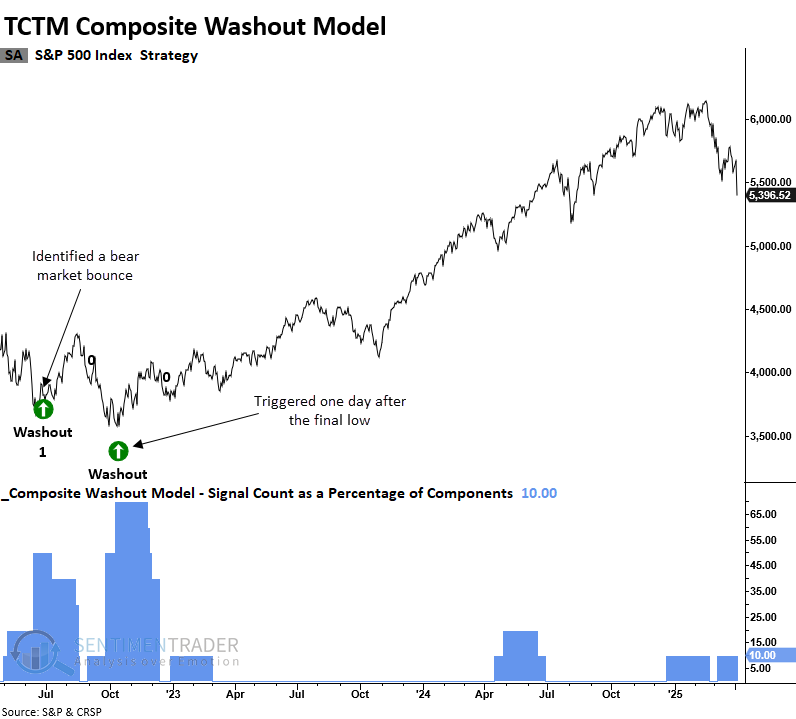
My TCTM Composite Washout Model shows no sign of capitulation, typically found around significant market lows. Three components identify a divergence in new lows across multiple time frames. With lows expanding again today, a contraction in new lows with a lower low in stock indexes, triggering an alert, is unlikely for now.
What the research tells us...
In times of heightened market volatility, it's essential to keep SentimenTrader's philosophy in mind: prioritize analysis over emotion to improve investment results. With stocks plunging, the urge to call the bottom grows louder. Tune it out. Historically, when new lows are expanding, as they are now, indexes often continue to slide. A better risk-reward setup emerges only when new lows contract, even as indexes keep falling.