Products
SentimenTrader Trading Tools
‍
Backtest Engine
My Trading Toolkit
Correlation Analysis
Seasonality
Market Prediction
Indicators & Data API
‍
Proprietary Indicators & Charts
Market Data API
Strategies & Scanner
‍
50+ Trading Strategies
Smart Stock Scanner
Smart Option Scanner
Research Reports
‍
Research Solutions
Reports Library
Free Resources
Simple Backtest Calculator
Simple Seasonality Calculator
The Kelly Criterion Calculator
Sentiment Geo Map
Public Research Reports
Education
Sentiment Indicators
Technical Indicators
Pricing
Company
About
In the News
Testimonials
Client Success Stories
Contact
Log inLoginSign up
< BACK TO ALL REPORTS

An expansion in 52-week highs bodes well for stocks

Dean Christians
2023-02-06
For the first time in more than 18 months, the 10-day average of NYSE 52-week highs as a percentage of highs and lows exceeded 90%, triggering a buy signal for stocks. With more and more issues reaching new highs and transitioning to long-term uptrends, the case for a new bull market looks encouraging.

Key points:

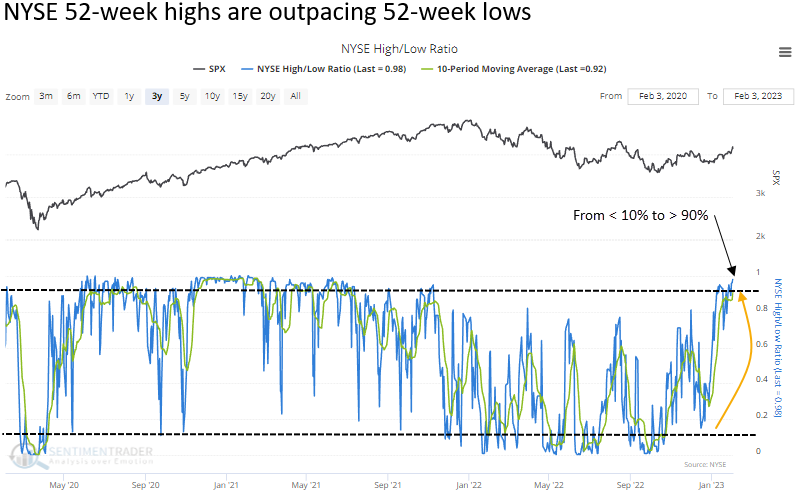
  • The 10-day average of NYSE 52-week highs as a percentage of highs and lows exceeded 90%
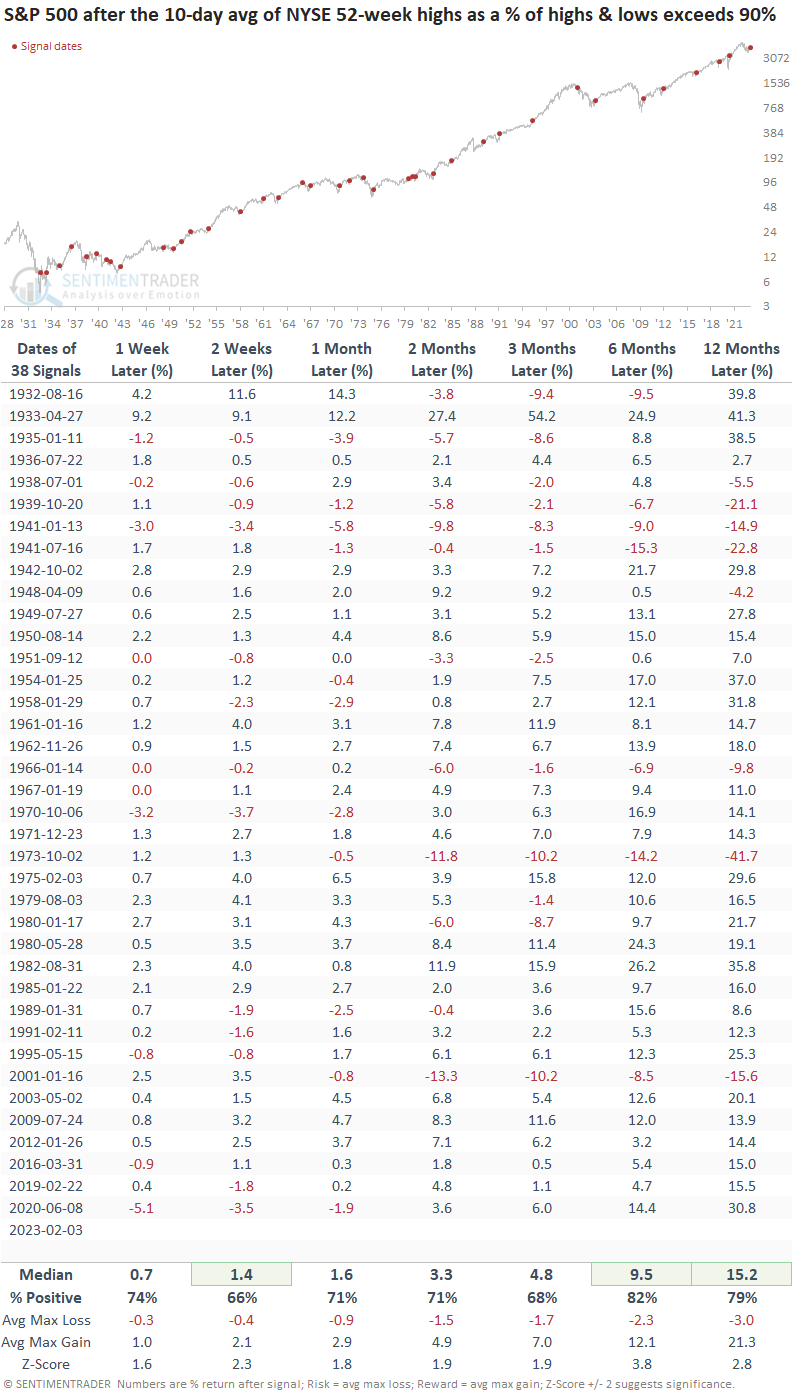
  • When the average exceeds a high level like now, stocks tend to rise
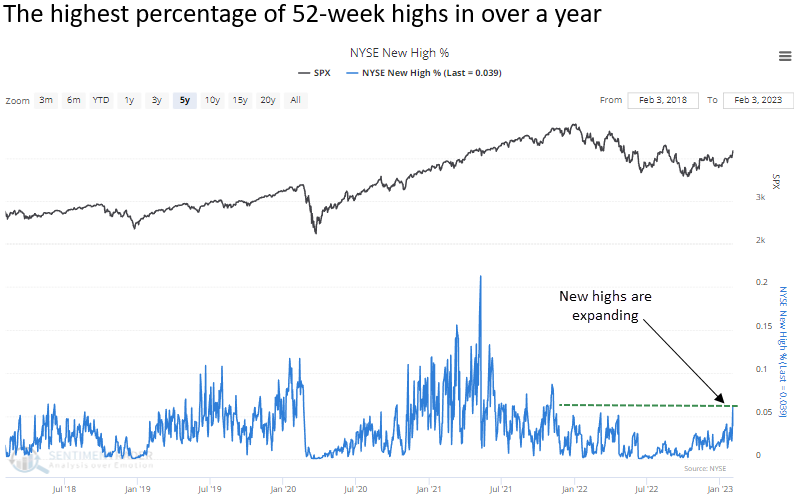
  • NYSE 52-week high as a % of total issues exceeded 6% and closed at the highest level in a year
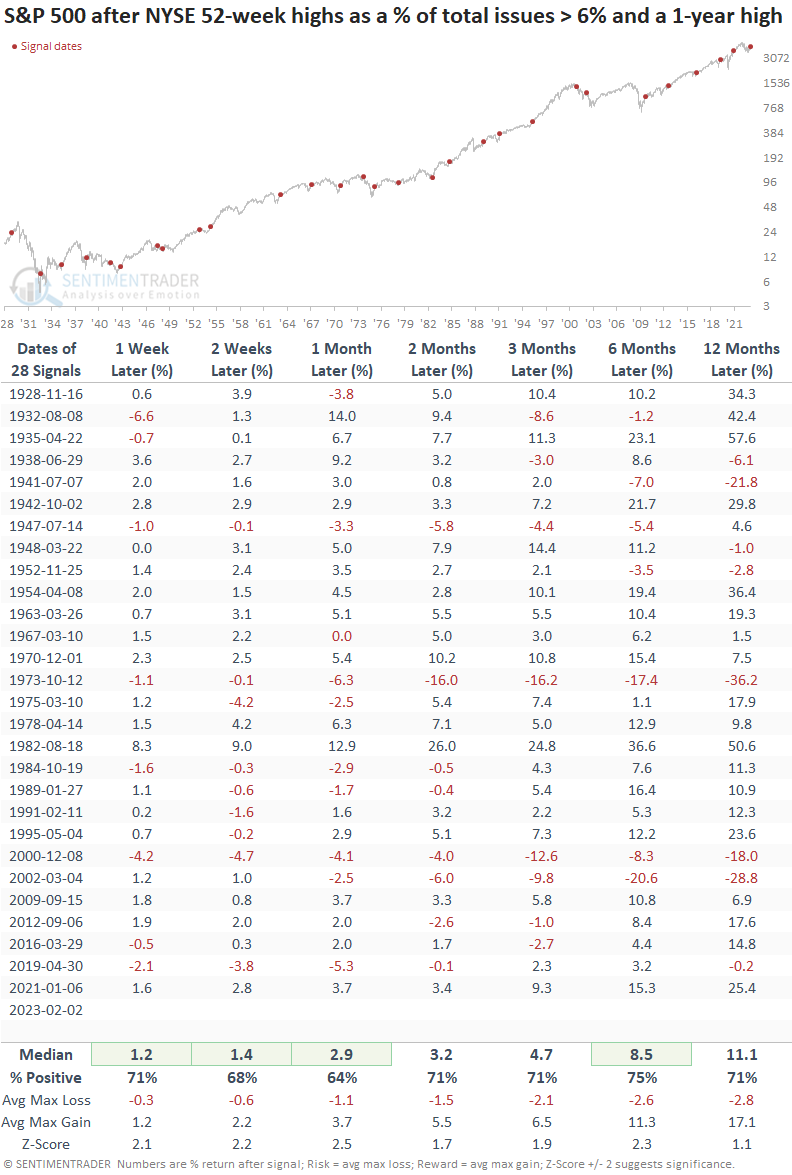
  • After similar expansions in 52-week highs, the S&P 500 had a consistent upward bias

52-week highs typically outnumber 52-week lows in bull markets

Market breadth indicators continue to recover no matter where you look. The NYSE, which contains stocks and bond proxies, has seen a pickup in 52-week highs relative to new lows and total issues traded.

For the first time in 18 months, the 10-day moving average for NYSE 52-week highs as a percentage of highs and lows exceeded 90%. The resurgence in new highs relative to lows occurred after the average fell below 10%. 

Similar reversals in new highs relative to new lows preceded bullish outcomes

When the 10-day average of NYSE 52-week highs as a percentage of highs and lows exceeds 90%, the S&P 500 showed excellent returns over the next six and twelve months since 1942, with a few notable exceptions. Before 1942, the signal mainly struggled in the 1937-42 period.

If we measure NYSE 52-week highs as a percentage of total issues, new highs exceeded 6% last Thursday. While not exceptionally high relative to what you typically find in bull markets, the rate expanded above the highest level in over a year. An expansion in new highs has to start somewhere.  

When the percentage of 52-week highs as a percentage of total issues surpasses 6%, and the ratio exceeds the highest level in a year, the S&P 500 consistently rises over the long term, with notable exceptions again occurring in the 1973-74 and 2000-02 bear markets. 

The recovery in long-term uptrends continues to gather steam

In December 2022, I highlighted the reversal in the number of NYSE common stocks trading above their 200-day average. Since that note, the percentage has continued to climb, with more than two-thirds of issues closing above their long-term average. 

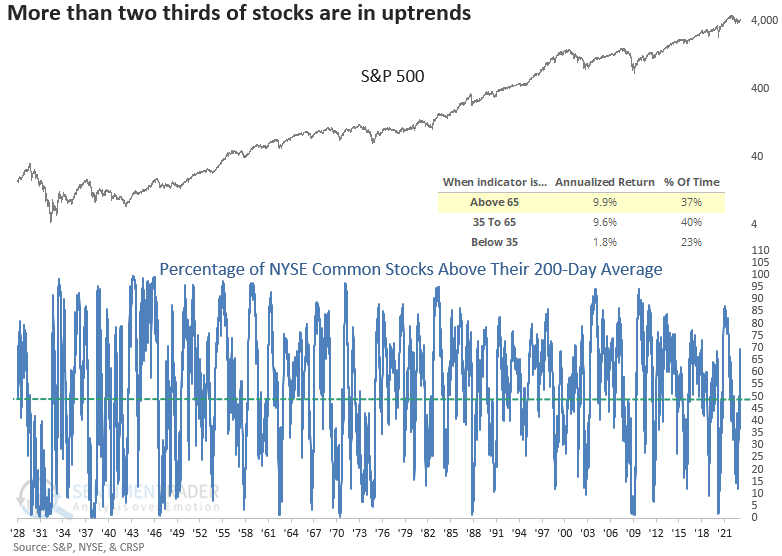
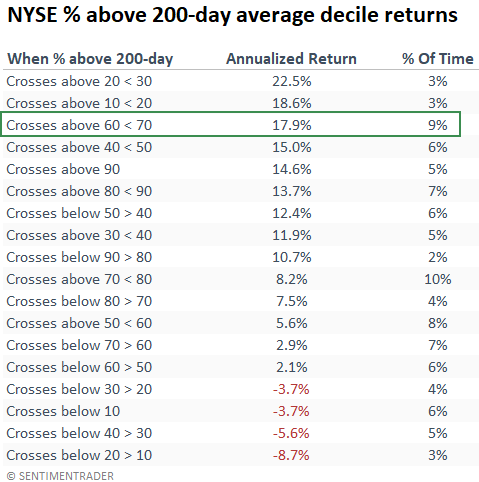
While readings above 65% are bullish for the S&P 500, when I drill down further to assess the outlook based on a decile cross, the current reading of 69% bodes well for stocks, with one of the highest annualized returns. 

What the research tells us...

An expansion in NYSE 52-week highs is a bullish development for stocks, as it is typically found in uptrends, not downtrends. With more new highs than at any point in the last year and an increasing number of common stocks transitioning to long-term uptrends, the notable change in character for the market looks encouraging. 

PRODUCTS
SentimenTrader
Trading Tools
Indicators & Data API
‍
Strategies & Scanner
‍
Research Reports
FREE
RESOUrCES
Simple Backtest
Calculator
Simple Seasonality
Calculator
The Kelly Criterion
Calculator
Sentiment Geo Map
‍
Public Research Reports
‍
Education
Sentiment Indicators
‍
Technical Indicators
‍
Pricing
Bundle pricing
‍
FAQ
‍
Announcements
‍
COMPANY
‍
About
‍
In the News
‍
Testimonials
‍
Client Success Stories
CONTACT
‍
General Inquiries
‍
Media Inquiries
‍
Financial Professionals Inquiries
‍
© 2026 Sundial Capital Research Inc. All rights reserved.
Setsail Marketing
TermsPrivacyAffiliate Program
Risk Disclosure: The information and tools provided are for research and analytical purposes only and are not intended as investment advice. Market analysis involves uncertainty, and outcomes may differ from expectations. Users should conduct their own due diligence and consider their individual circumstances before making any financial decisions. Past performance is not necessarily indicative of future results.

Hypothetical Performance Disclosure: Hypothetical performance results have many inherent limitations, some of which are described below. No representation is being made that any account will or is likely to achieve profits or losses similar to those shown; in fact, there are frequently sharp differences between hypothetical performance results and the actual results subsequently achieved by any particular trading program. One of the limitations of hypothetical performance results is that they are generally prepared with the benefit of hindsight. In addition, hypothetical trading does not involve financial risk, and no hypothetical trading record can completely account for the impact of financial risk of actual trading. for example, the ability to withstand losses or to adhere to a particular trading program in spite of trading losses are material points which can also adversely affect actual trading results. There are numerous other factors related to the markets in general or to the implementation of any specific trading program which cannot be fully accounted for in the preparation of hypothetical performance results and all which can adversely affect trading results.

Testimonial Disclosure: Testimonials appearing on this website may not be representative of other clients or customers and is not a guarantee of future performance or success.