
An expanding number of S&P 500 trend signals are in bullish alignment

Key points:
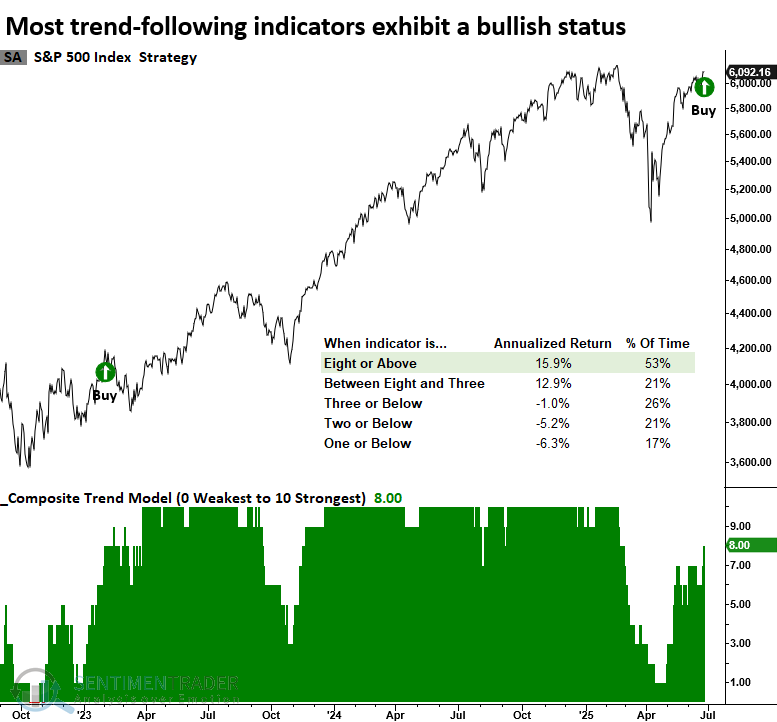
- Almost all of the trend-following indicators in the S&P 500's Composite Trend Model display a bullish status
- Similar recoveries in the trend-following composite suggest the cyclical advance in stocks will persist
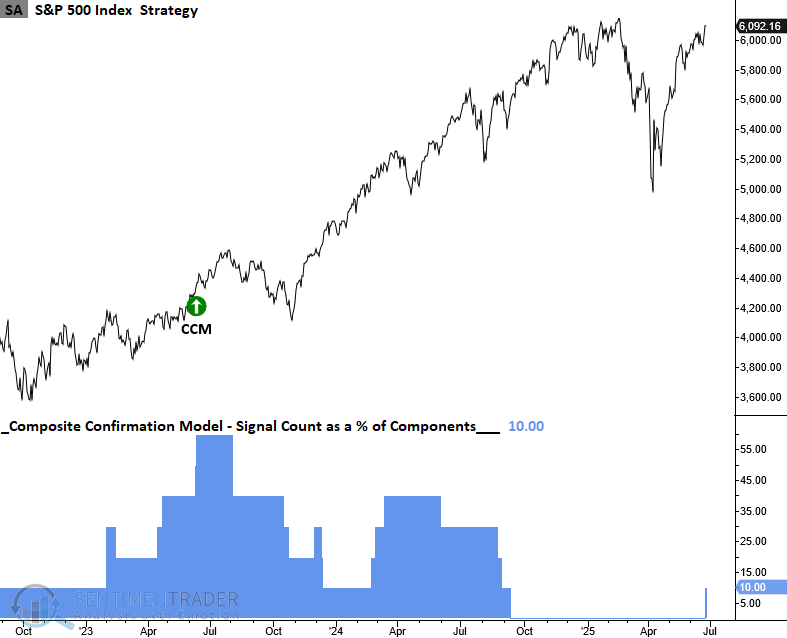
- With the new alert, the TCTM Composite Confirmation Model signal count increased to 10%
The underlying trend condition for the S&P 500 is gaining strength
In a May 19th report, I noted that the Composite Trend Model for the S&P 500 had triggered a net change buy signal, a four-point jump over five sessions. These trend score thrusts often precede broader improvement among model components, which has since occurred.
On Wednesday, the S&P 500's trend score increased to eight, a level associated with annualized returns of 15.9% since 1928, as illustrated in the chart below. This improvement in trend indicators generated a new signal for a member in the TCTM Composite Confirmation Model.
The new alert marks the first component in the confirmation model to generate a signal. Unlike the more responsive systems in the Composite Thrust Model, these confirmation components are designed with a longer-term perspective and are inherently less timely. Their purpose is to offer supporting evidence that the S&P 500's trend is gaining strength.
Similar trend composite recoveries preceded S&P 500 gains
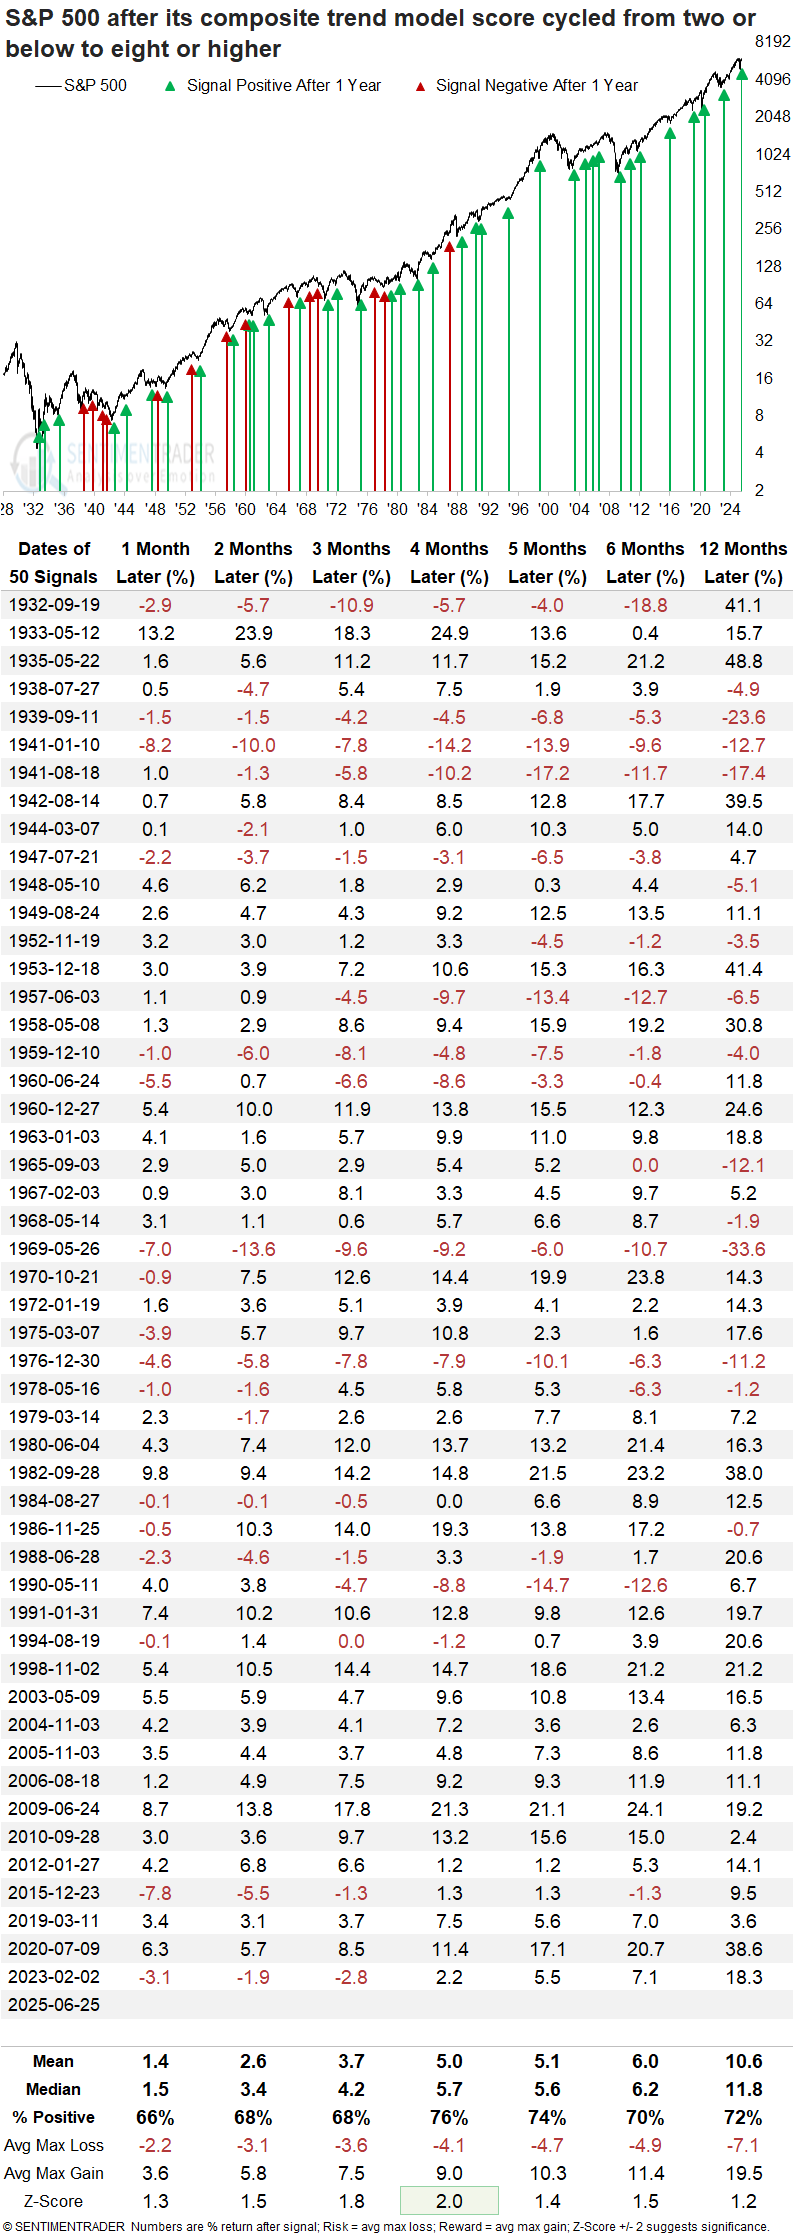
Each time the S&P 500's Composite Trend Model moved from two or lower to eight or higher, the world's most benchmarked index tended to advance over the following year, especially in recent decades, where it has posted 16 consecutive winning outcomes since 1988. The four-month horizon was especially notable, with a 76% win rate and returns that significantly outperformed random outcomes.
TCTM Composite Confirmation Model
The weight of the evidence continues to suggest that stocks are in the early stages of a cyclical upswing. Consequently, as the advance unfolds, more signals are likely to turn positive, confirming the trend's strength.
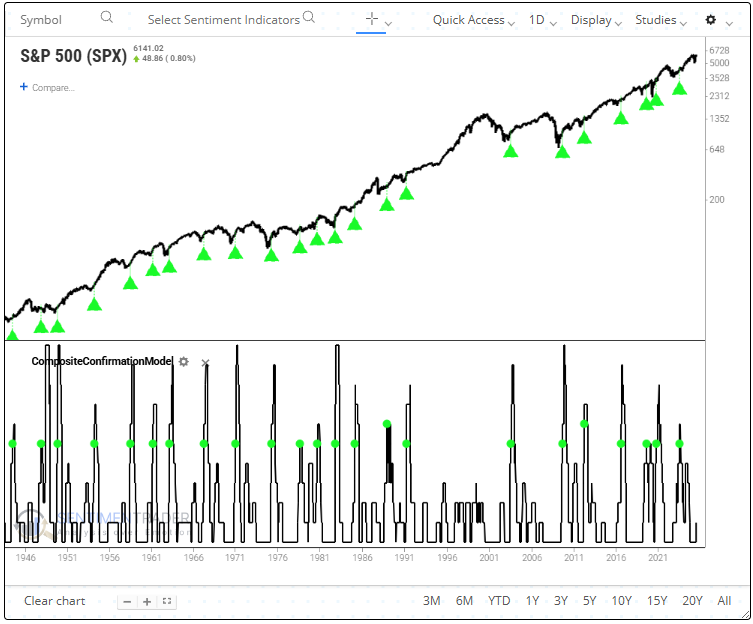
When viewed from a broader perspective, the TCTM Composite Confirmation model has consistently confirmed the durability of cyclical advances following significant drawdowns.
As a reminder, the TCTM generally follows a three-step sequence as stocks emerge from a drawdown period: first, a composite washout signal appears, indicating capitulation; next, a composite thrust signal suggests broad participation; and finally, a composite confirmation solidifies the shift in probabilities toward a bullish trend.
Weight of the evidence
In the early stages of a rebound, bullish signals typically dominate. As the rally matures, momentum slows, and negative signals begin to surface. That's when risk increases. For now, maintaining a fully invested position remains the most prudent course of action as bullish signals outweigh bearish ones.
What the research tells us...
A trend-following composite, comprising ten components, has climbed from a level of one during the depths of the market meltdown to a reading of eight, showing that most trend indicators now align in a bullish configuration. Similar recoveries produced solid returns and consistency for the world's most benchmarked index, suggesting the cyclical advance persists. This new alert represents the first signal for a member of the TCTM Composite Confirmation Model, a system designed to confirm the sustainability of cyclical upswings after market drawdowns.