
An equity earthquake

Key points:
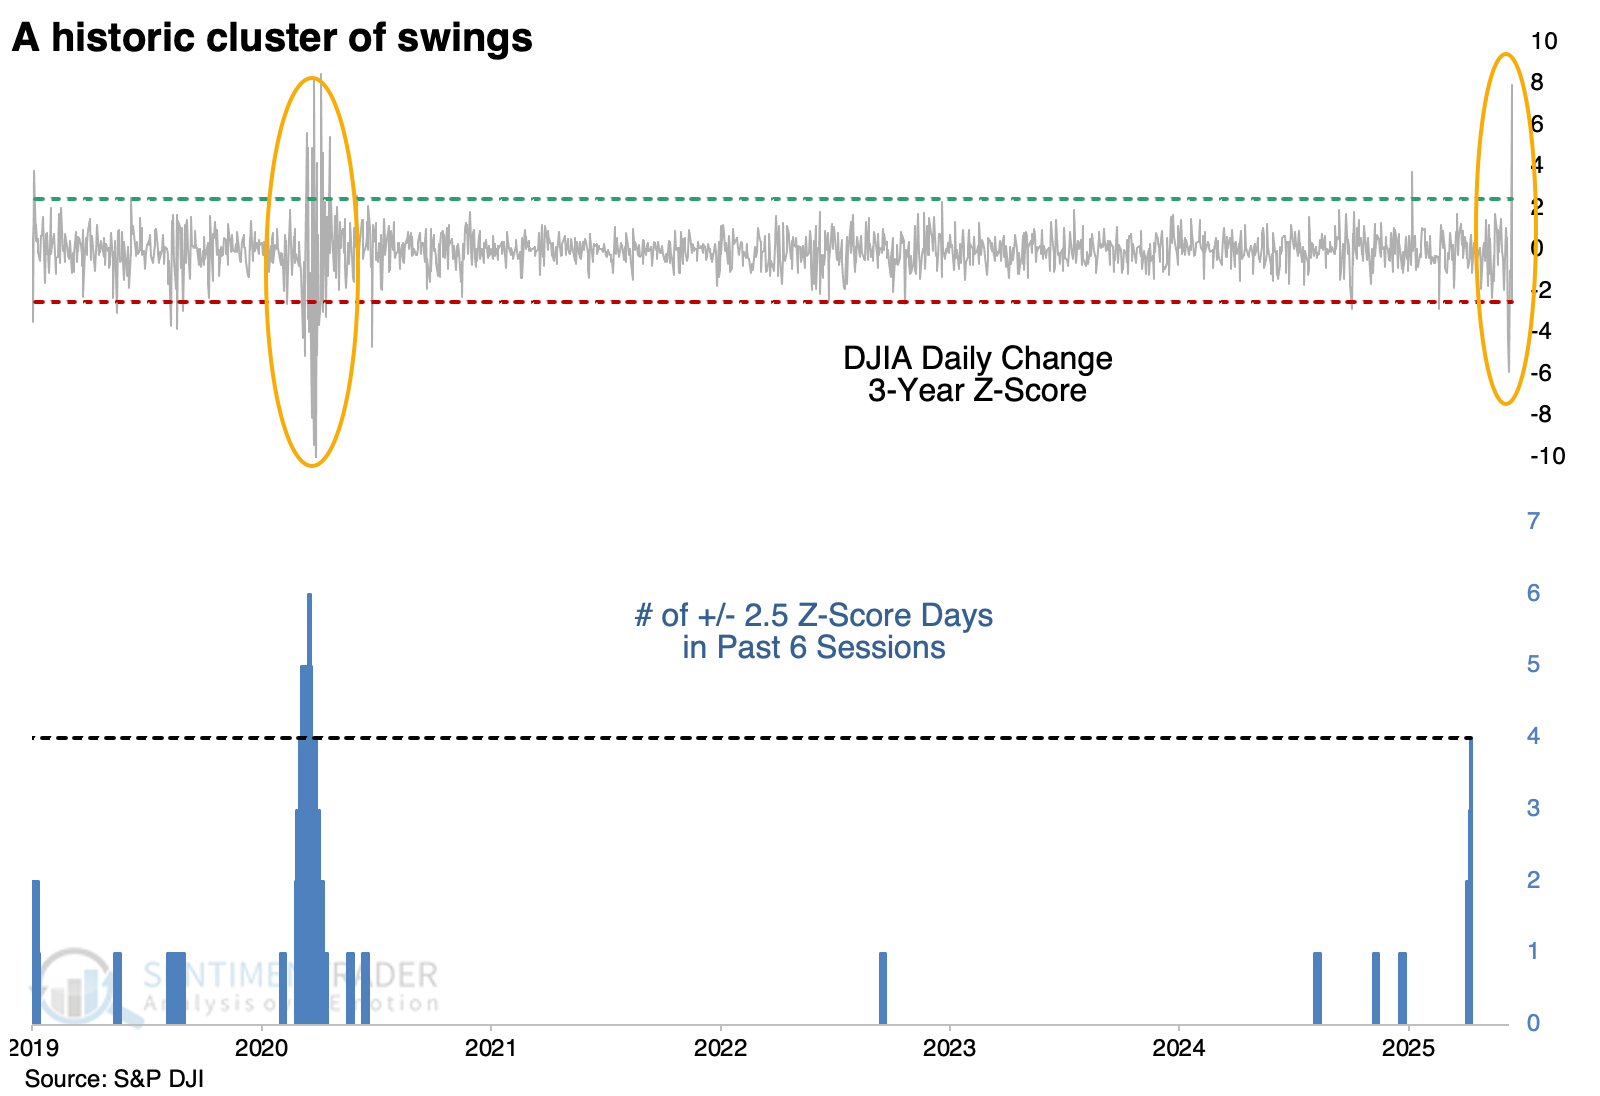
- Over six sessions, the Dow Industrials witnessed a cluster of extreme moves based on their z-score
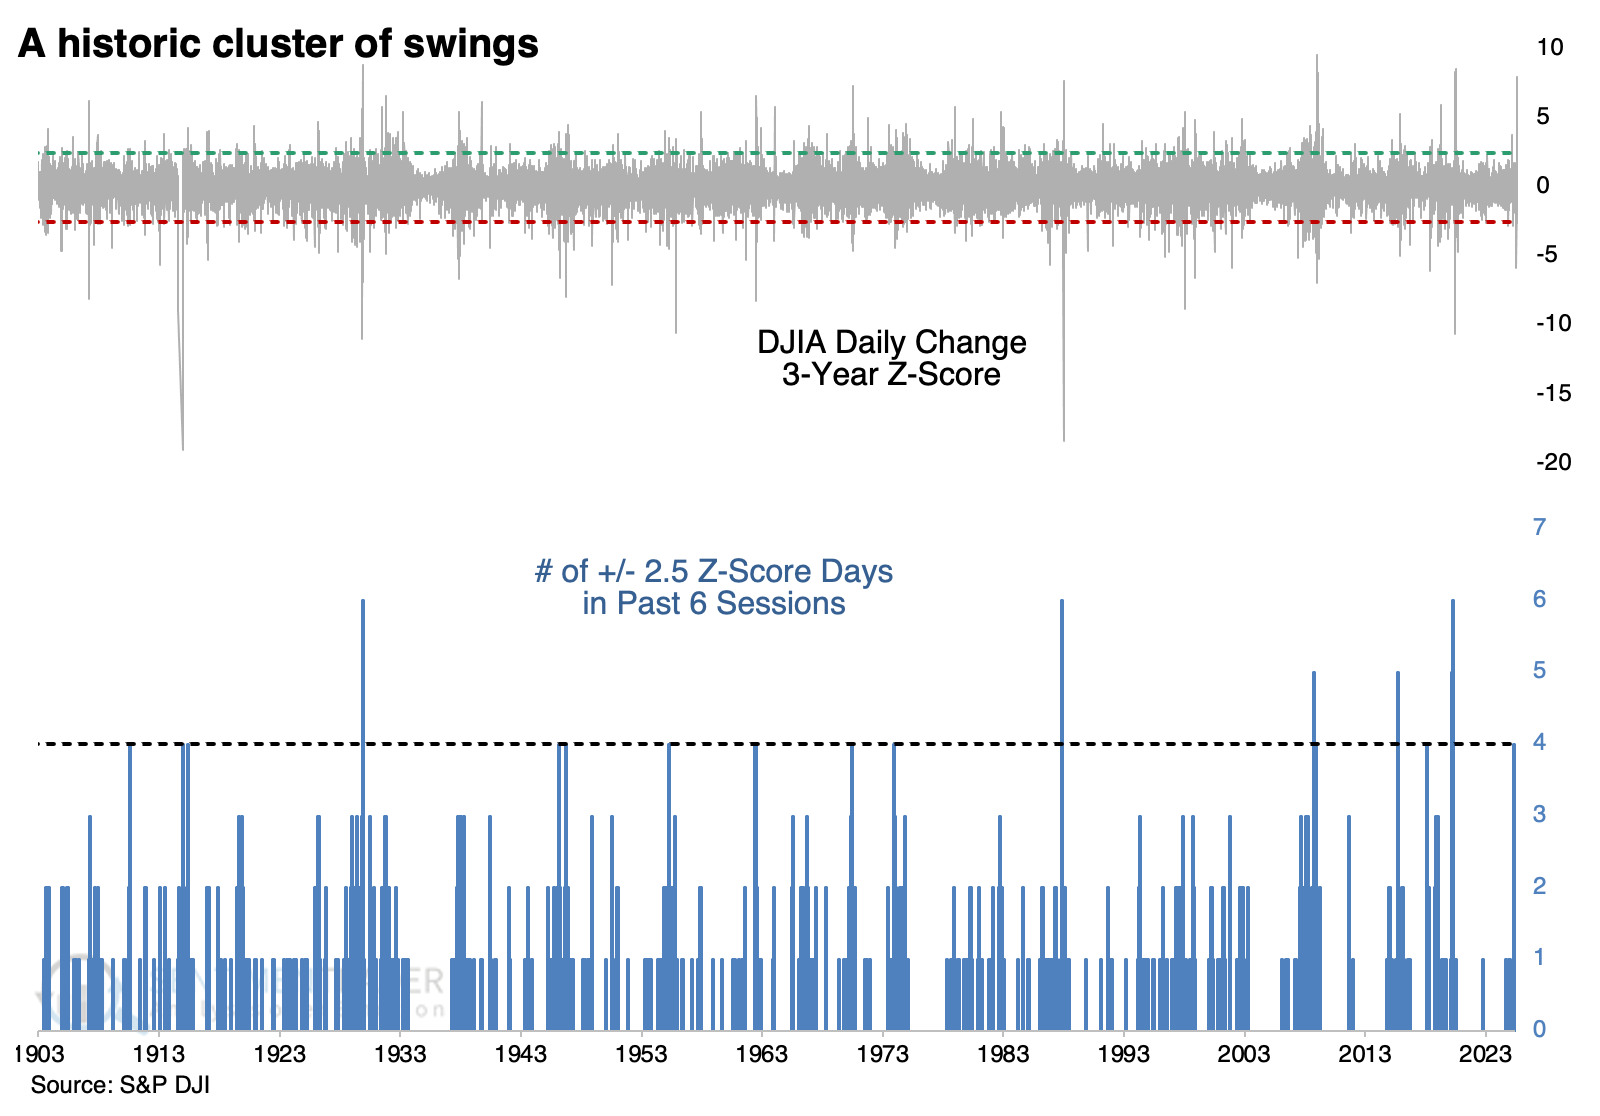
- This was an "equity earthquake" that has only about a dozen precedents over the past 125 years
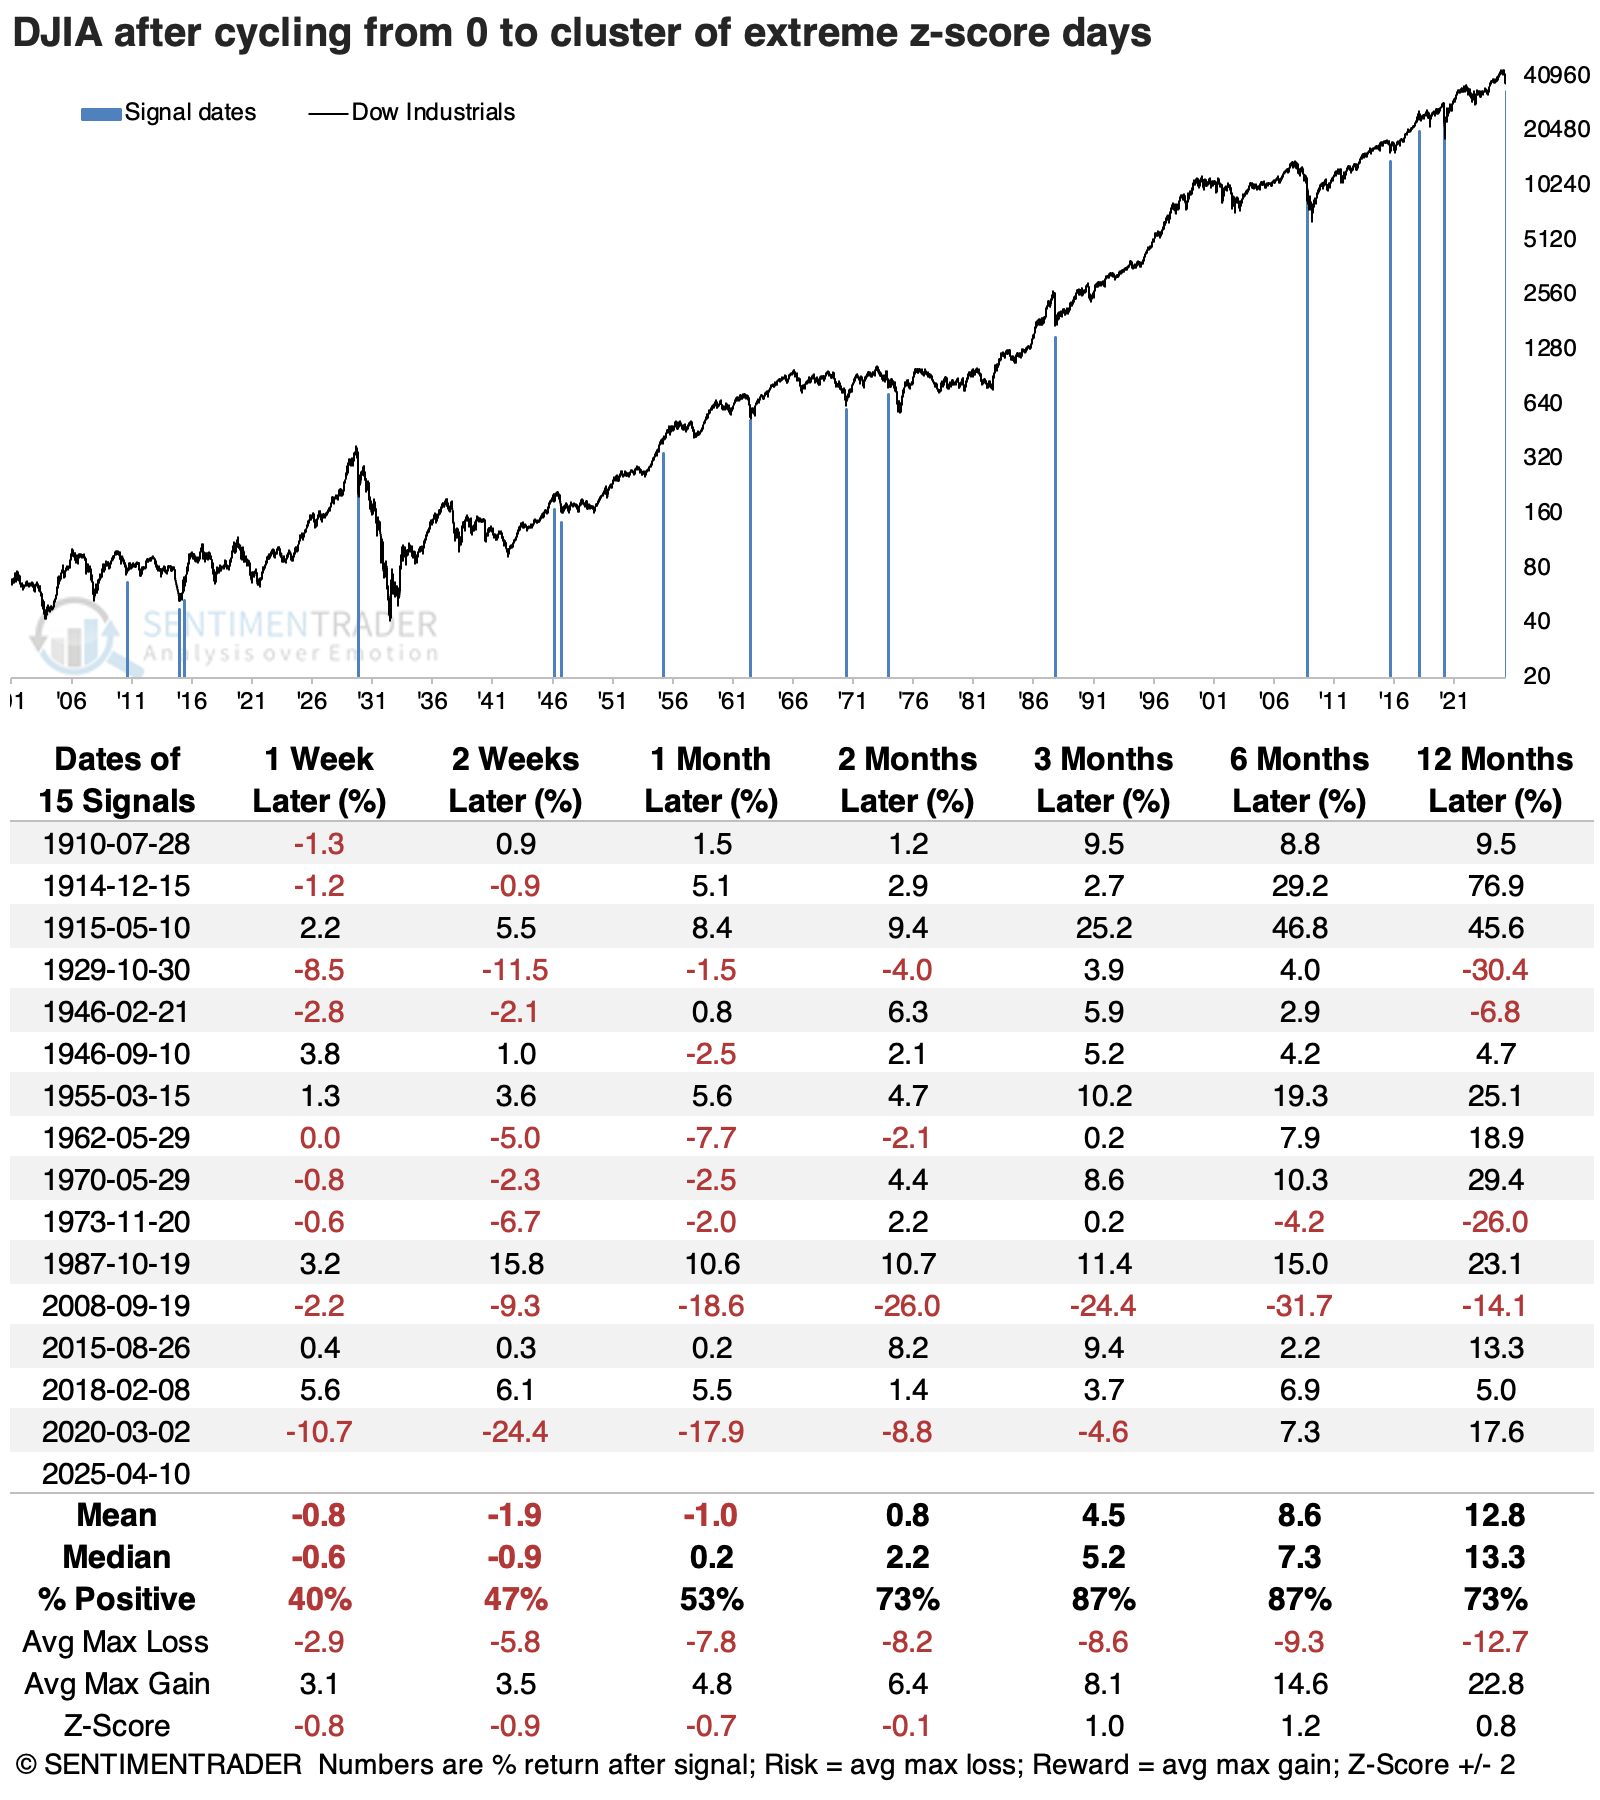
- When other shocking moves hit stocks, short-term returns were volatile, with a high probability of 3-6 months of recovery
A piece of 125 years of history
Investors have suffered through the equivalent of an earthquake. It seemed to come out of nowhere (depending on one's political affiliation), was hugely disruptive, and caused enormous damage to some.
The extreme daily changes in equity indices have been tremendous beyond anything seen for years. The past week has been very similar to the seismograph of an earthquake.
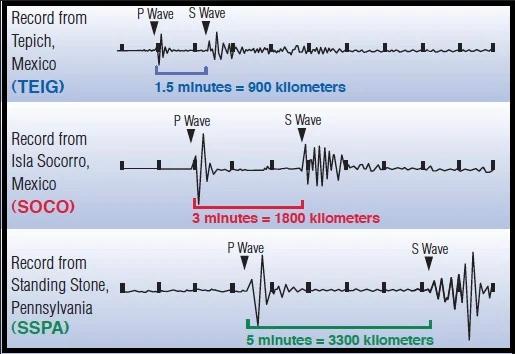
Similar to that approach, we can look at moves in a stock index and compare them to prior days to get a baseline for what's normal and what's not. A good way to do that is to use z-scores, which measure each daily change, compare how far it is from the average over three years, and divide that by the standard deviation.
The result looks just like a seismograph. The past six sessions look like a stock market earthquake, like the pandemic panic, with at least four of six sessions undergoing at least a 2.5 standard deviation move.
We use the Dow Industrials for this exercise since we can go back to the year 1900. With such extreme changes, we need as much history as possible. And we can see that even with 125 years of data, there aren't many precedents of such volatility clusters.
The table below shows how the Dow performed when it cycled from zero days with an extreme move to a cluster of them. Experienced market watchers and academics like to point out that high volatility tends to beget even more volatility and vice-versa. We can see evidence of that here, with some significant moves in the Dow over the next couple of weeks.
There was a negative skew to the short-term returns, which is also typical of high-volatility environments. But at some point, the extreme moves are enough to exhaust the sellers, buyers sense an opportunity, volatility recedes, and prices climb. Over the following three and six months, 13 of the 15 instances sported a positive return. Within six months, all but one of the signals saw the Dow climb at least +5%, while only five of them saw a drawdown larger than -5%.
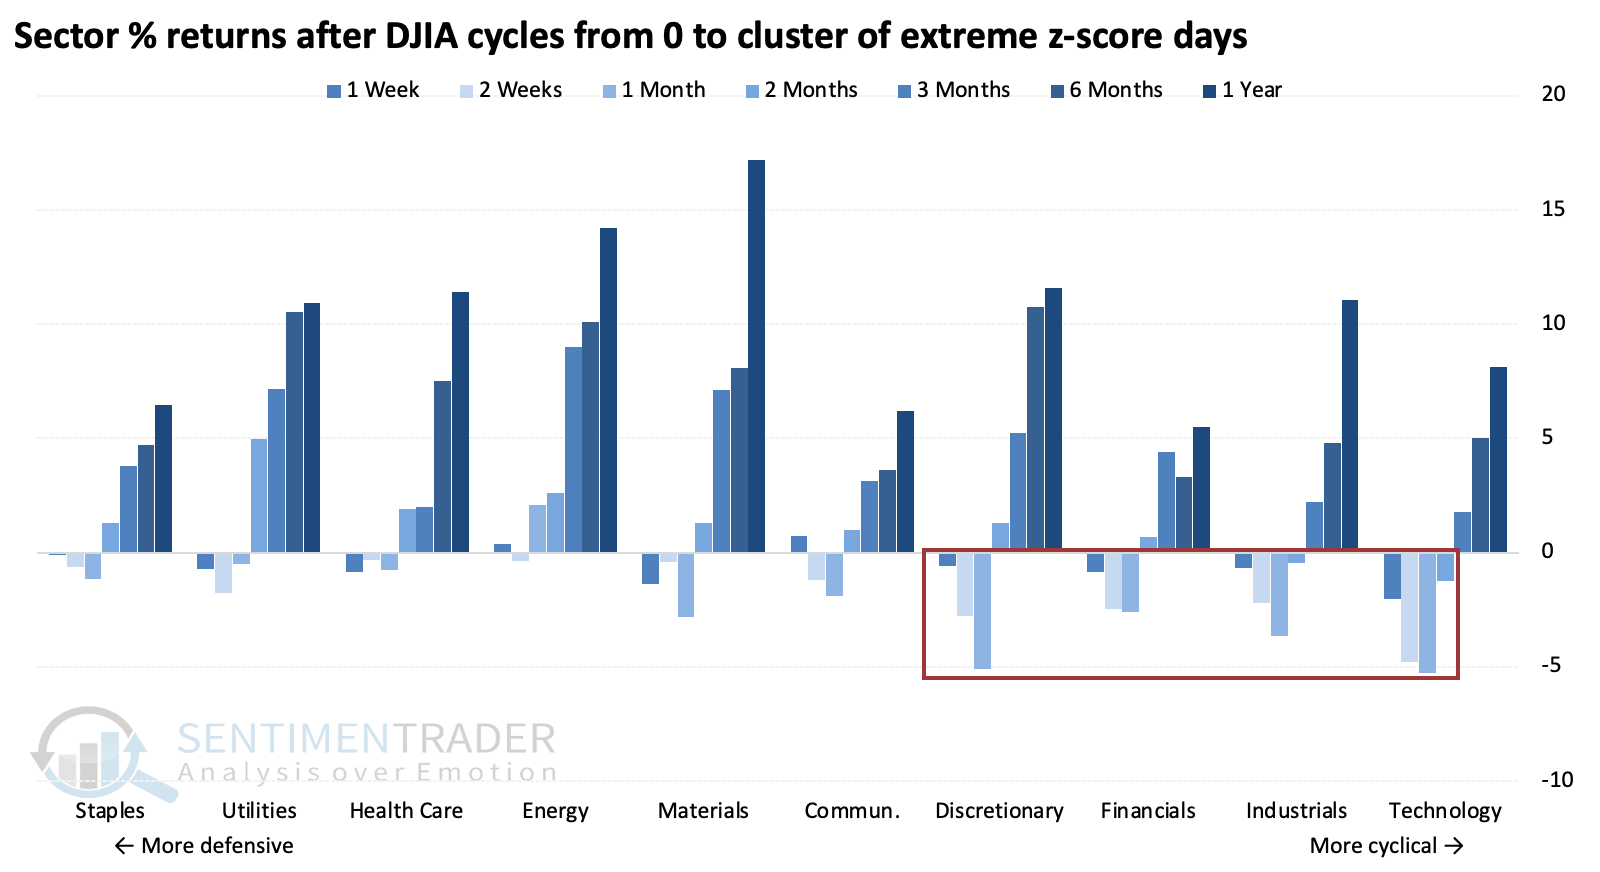
The bouts of truly exceptional volatility dragged on the returns of higher-beta sectors like discretionary and technology stocks. These sectors had poor short-term returns but tended to climb back strongly from their depths over longer time frames.
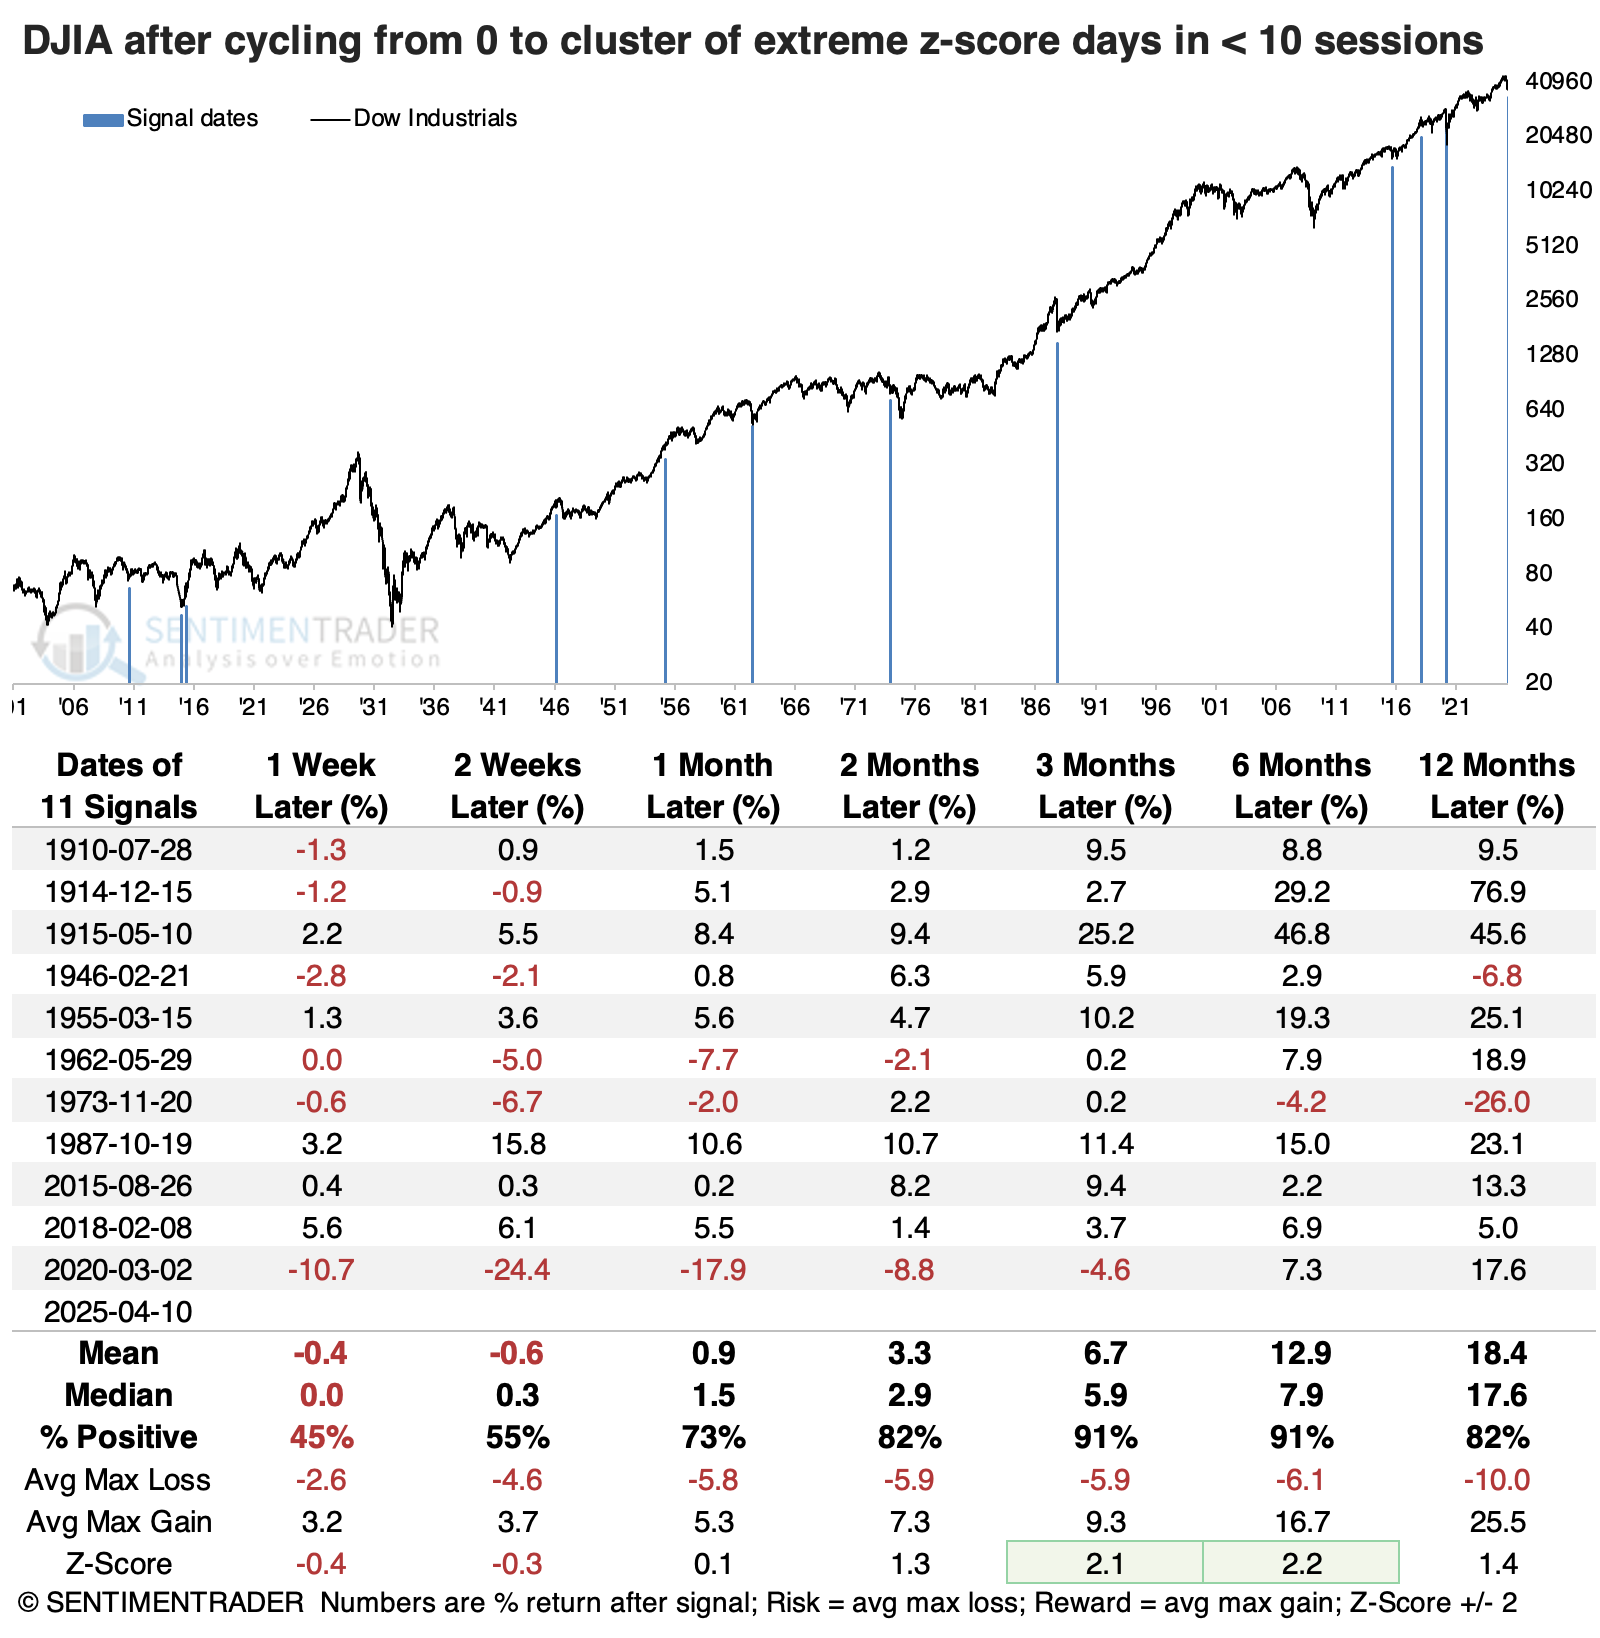
Additional context for the equity earthquake is how suddenly it developed. The Dow went from having zero days with an extreme z-score to a cluster of them, all within ten sessions. The table below filters the signals for the quickest-developing ones, and we can see that three- and six-month returns were further improved. The Dow showed a positive return either three or six months later every time, risk was reduced, and reward was higher.
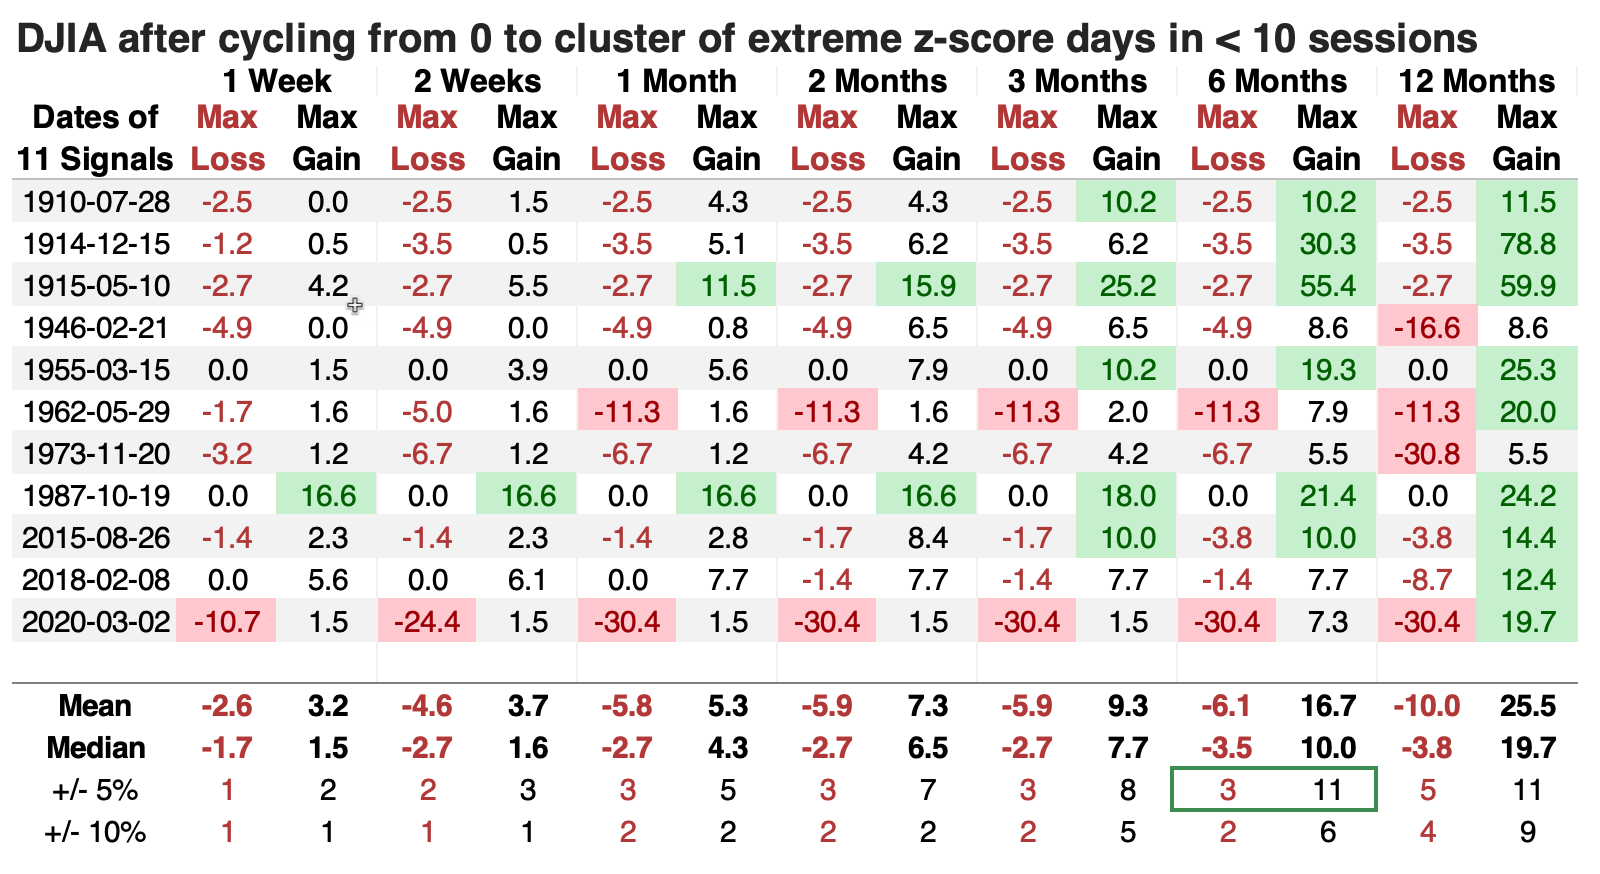
A table of maximum gains and losses across time frames shows that within the next six months, all the signals gained at least +5% at some point, while only about a third of them suffered a drawdown of more than -5%. Larger moves, of +/- 10%, were similarly skewed.
What the research tells us...
If Leo Tolstoy were an active investor, he might have noted that "every bull market is alike; every bear market is bearish in its own way." Bull markets often unfold similarly because volatility tends to be lower. During bear markets, volatility spikes can result in v-shaped bottoms that quickly recover, rebounds that fail and consistently lead to new lows, or choppy affairs that wear investors out.
Whether we're in a bear market is mostly subjective, but by most metrics, we are close-but-not-quite. We know that volatility is extreme, which tends to precede yet more volatility and generally weak short-term price action. Chasing rallies on the fear of missing out on the big rebound is dangerous. The typical pattern after an equity earthquake is a test of the panic lows, volatility subsides, and a buying thrust sustained over several sessions. If that were to unfold in the coming weeks, it would have a bevy of very compelling and bullish historical precedents.