Products
SentimenTrader Trading Tools
‍
Backtest Engine
My Trading Toolkit
Correlation Analysis
Seasonality
Market Prediction
Indicators & Data API
‍
Proprietary Indicators & Charts
Market Data API
Strategies & Scanner
‍
50+ Trading Strategies
Smart Stock Scanner
Smart Option Scanner
Research Reports
‍
Research Solutions
Reports Library
Free Resources
Simple Backtest Calculator
Simple Seasonality Calculator
The Kelly Criterion Calculator
Sentiment Geo Map
Public Research Reports
Education
Sentiment Indicators
Technical Indicators
Pricing
Company
About
In the News
Testimonials
Client Success Stories
Contact
Log inLoginSign up
< BACK TO ALL REPORTS

An Energy Sector Breadth Thrust from Oversold to Overbought

by Sentimentrader
2025-11-10
A rare breadth thrust just triggered in Energy (XLE) as stocks above their 10-day MA went from 0% to >90% in 21 days. Standalone signals are mixed (60% win rates), but adding a rising 200-day MA filter boosts the 6-month win rate from 71% to 82%.

Key points:

  • The number of S&P 500 energy stocks above their 10-day avg cycled from 0% to over 90% in 21 days
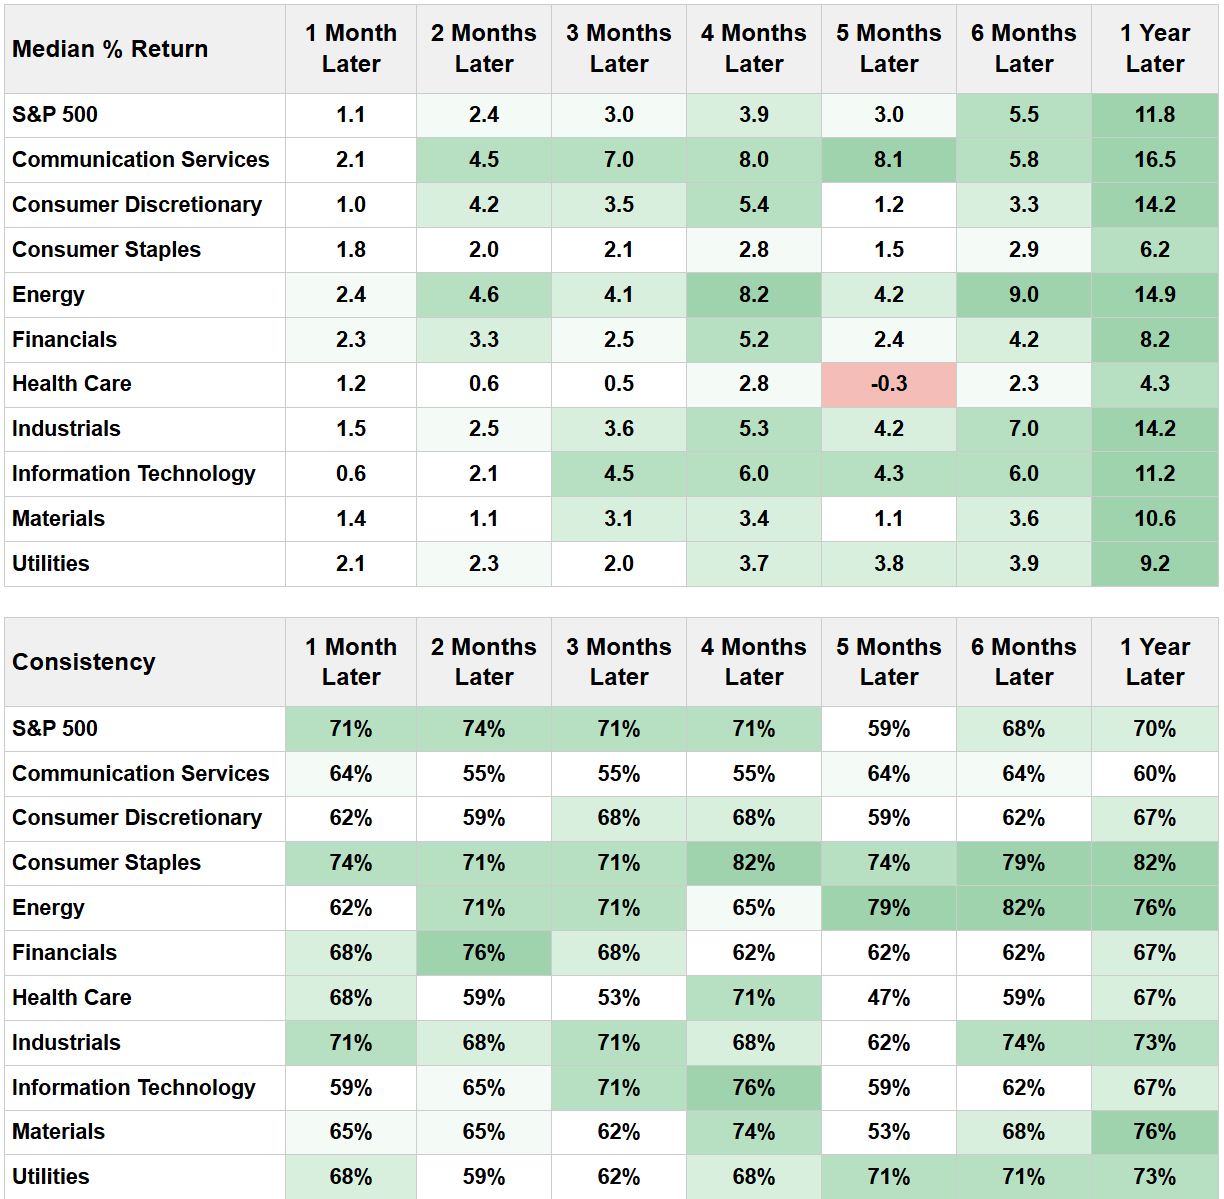
  • After the signals, the energy sector showed inconsistent win rates in the 60% range
  • If we include a trend filter (rising 200-day MA), the 6-month win rate improves to 82%

A trading model that measures a reversal in trend participation

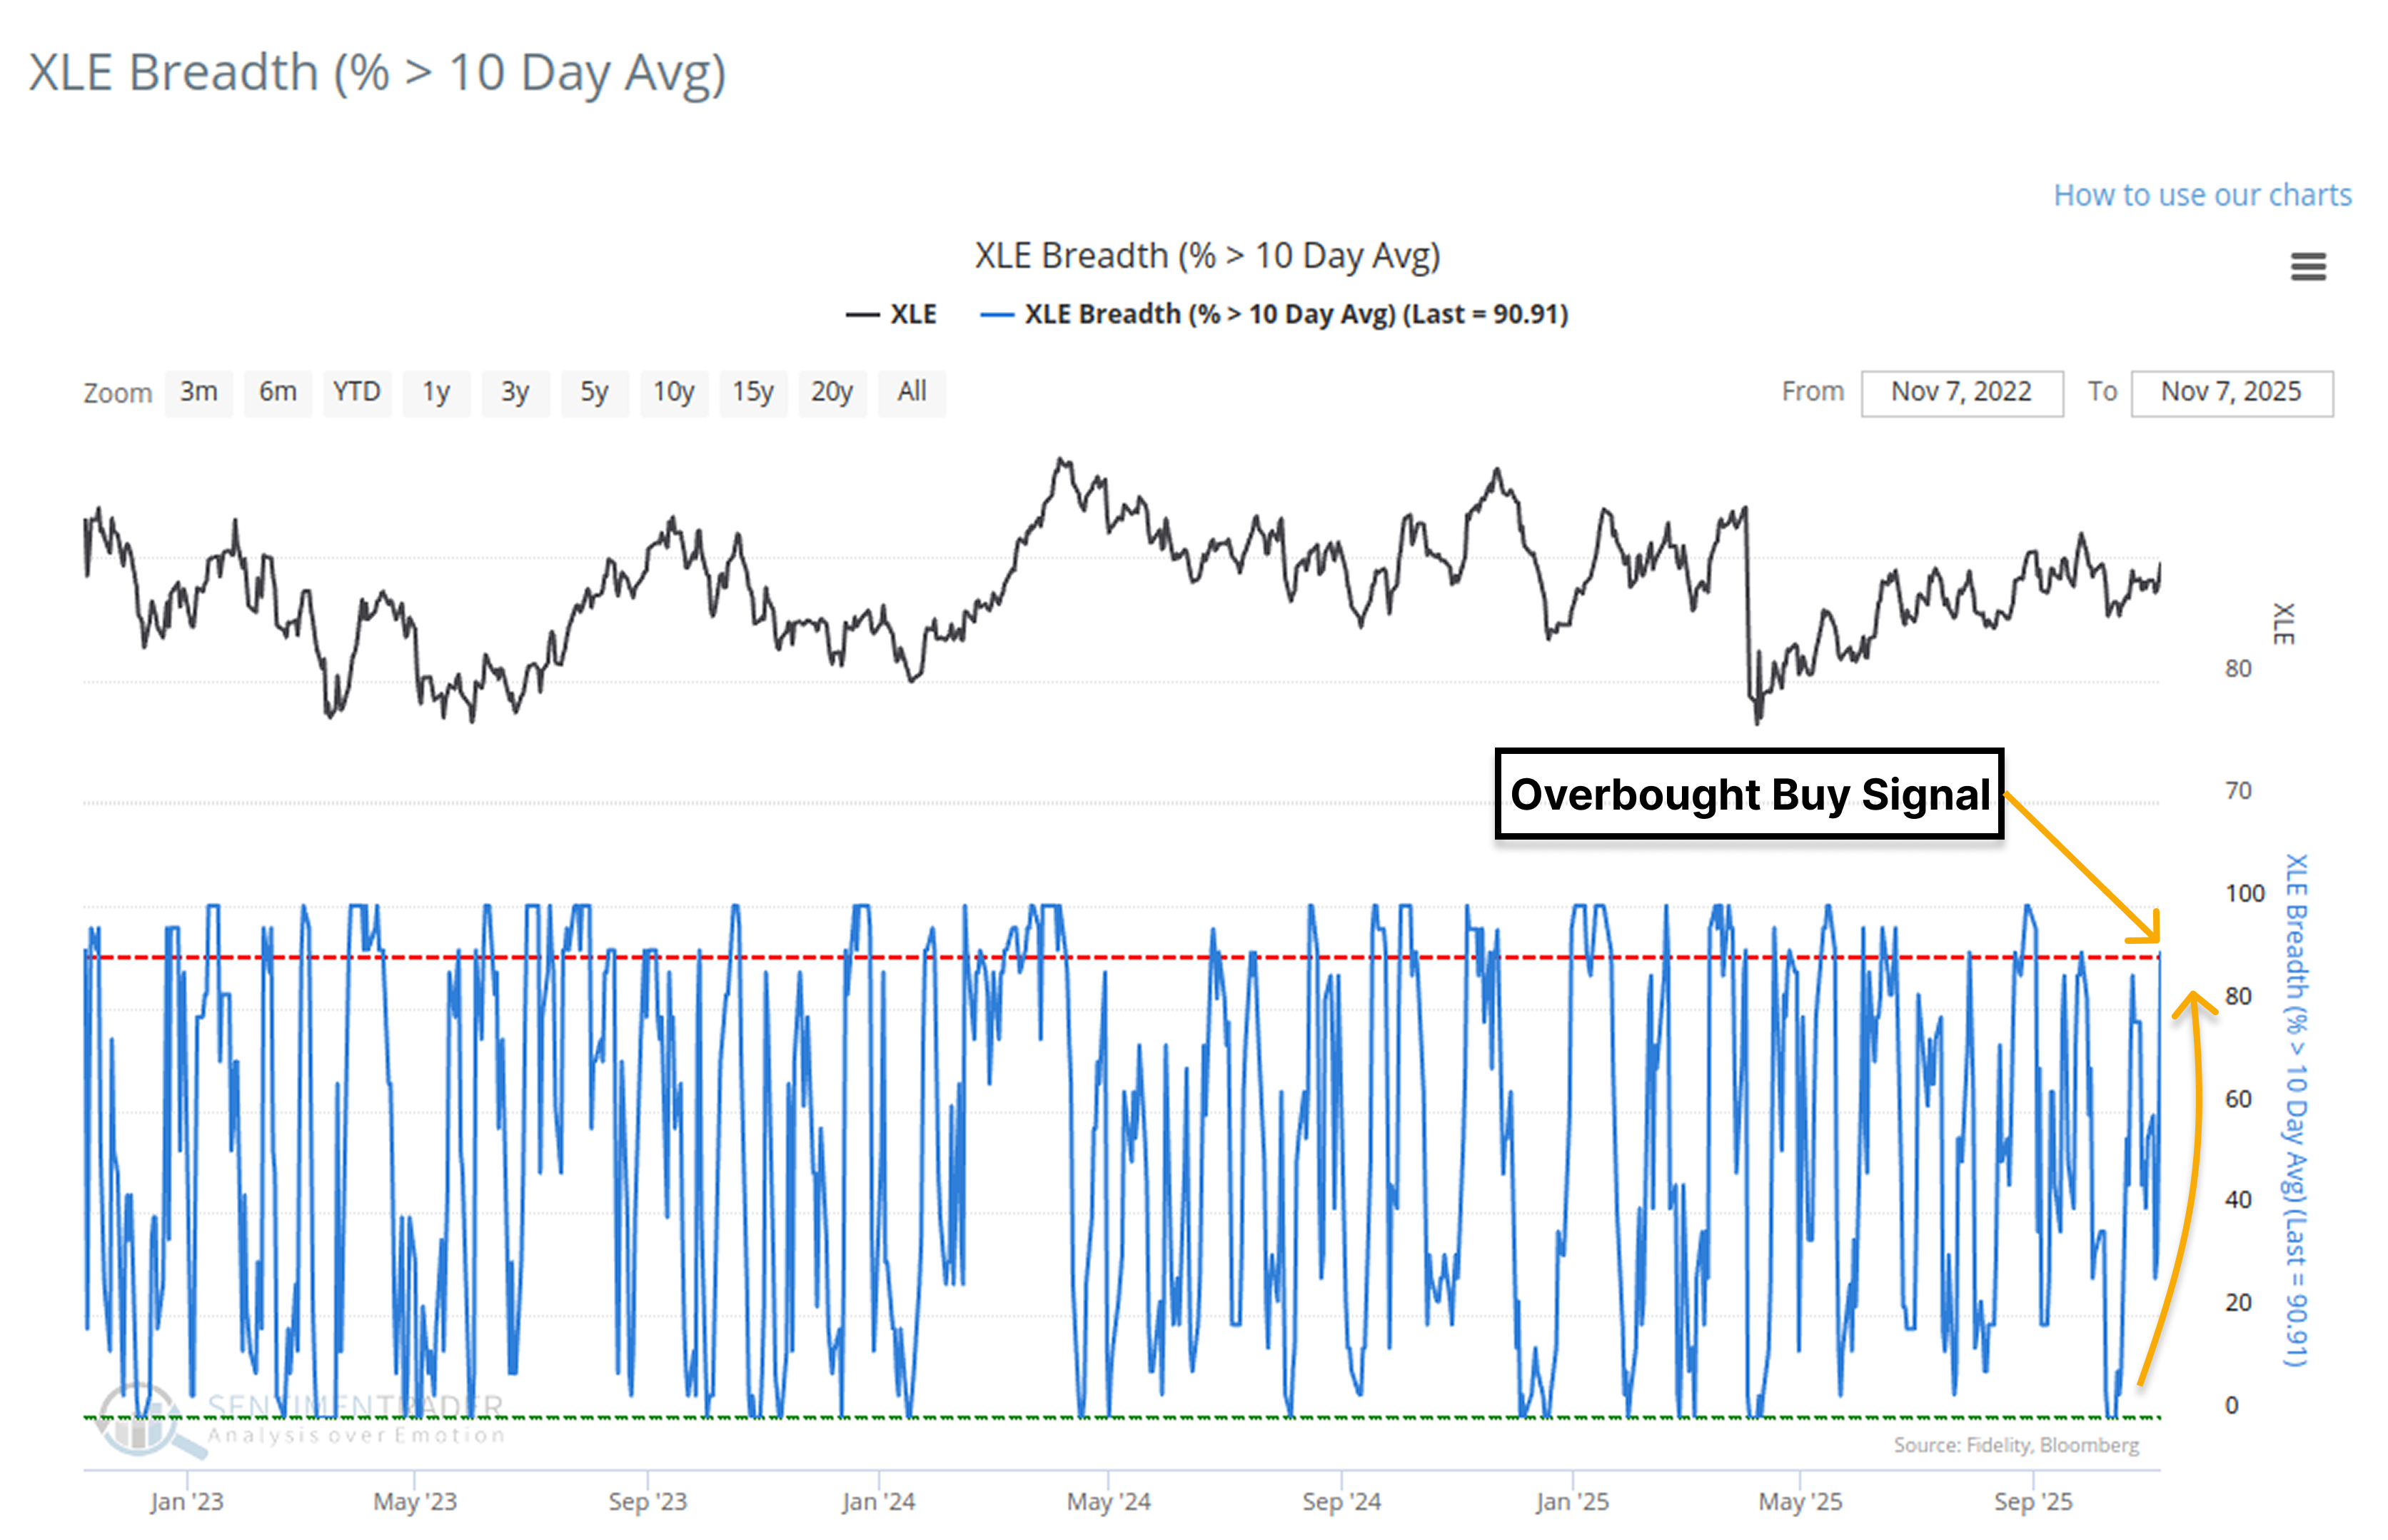
The percentage of S&P 500 energy members trading above their respective 10-day moving average registered an oversold-to-overbought reversal buy signal last week.

The trading signal identifies instances when the number of S&P 500 energy members trading above their respective 10-day moving average reverses from = 0% to > 90% in 21 sessions or fewer.

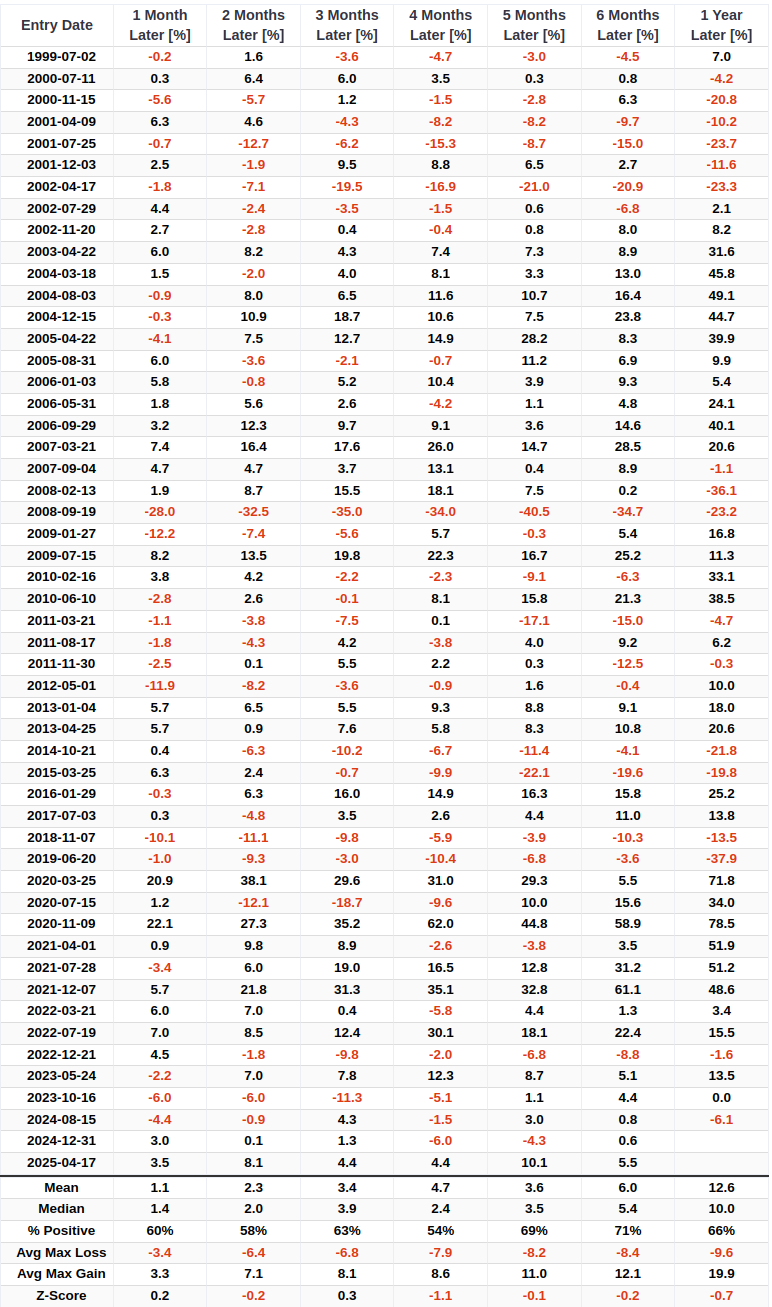
The signal alone shows unstable win rates, hovering around 58% to 69%

This model generated 52 other signals over the past 30 years. After the signal, the energy sector showed a mixed performance. The win rates are not particularly compelling, hovering in a range of 58% to 69% across most time frames. 

If we include a trend filter, the sector rallied 82% of the time 6 months later   

If we include a trend filter that requires the energy sector (XLE) to be in a long-term uptrend (i.e., a rising 200-day moving average) when the reversal occurs, the results improve substantially. After the others, the 6-month win rate jumps from 69% to 82%. This suggests that this powerful breadth thrust is much more reliable when it occurs within the context of an established bull market. 

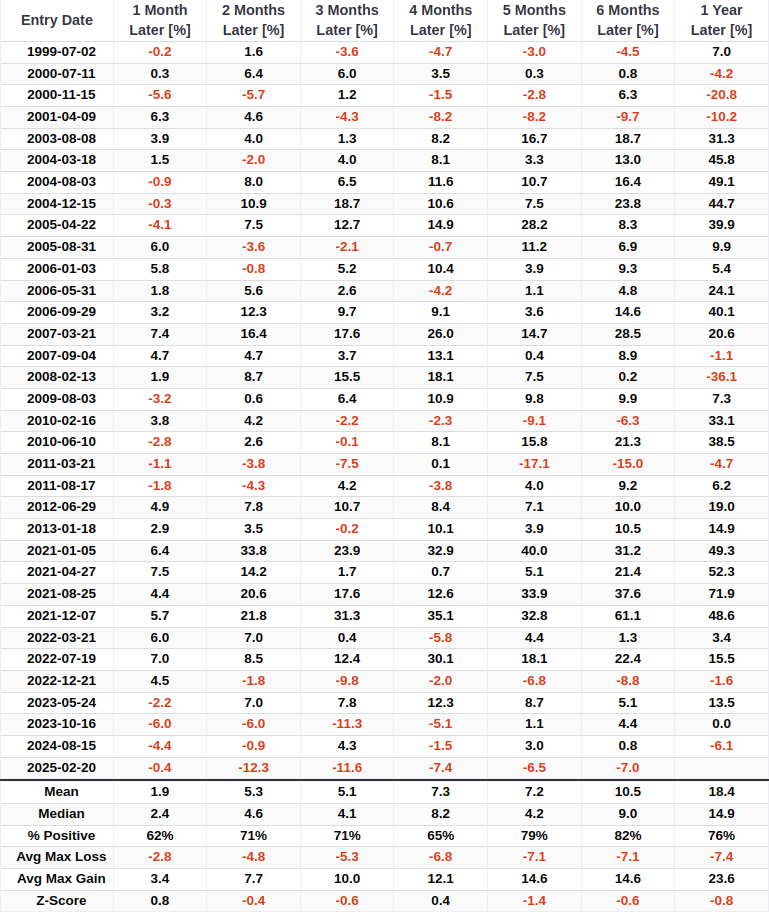
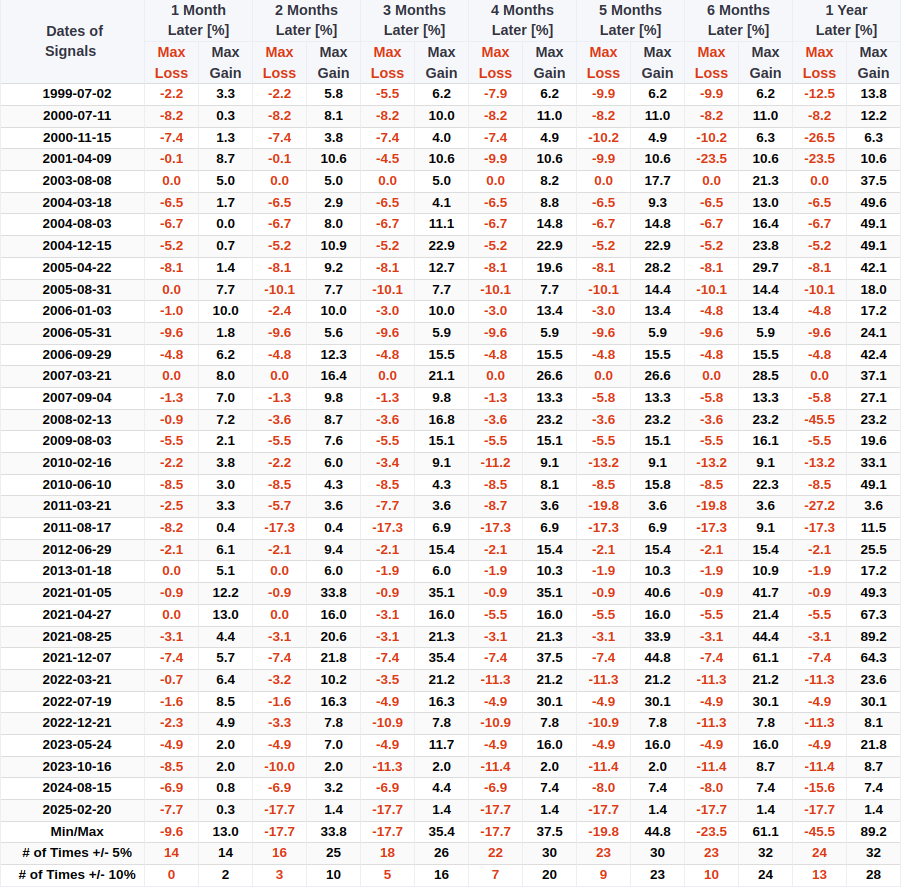
While the upside has been significant (median max gain of +14.9% at 6 months), the median max loss at the 6-month mark was -7.1%.

This filtered signal in the energy sector has also historically been a positive sign for the broader market.

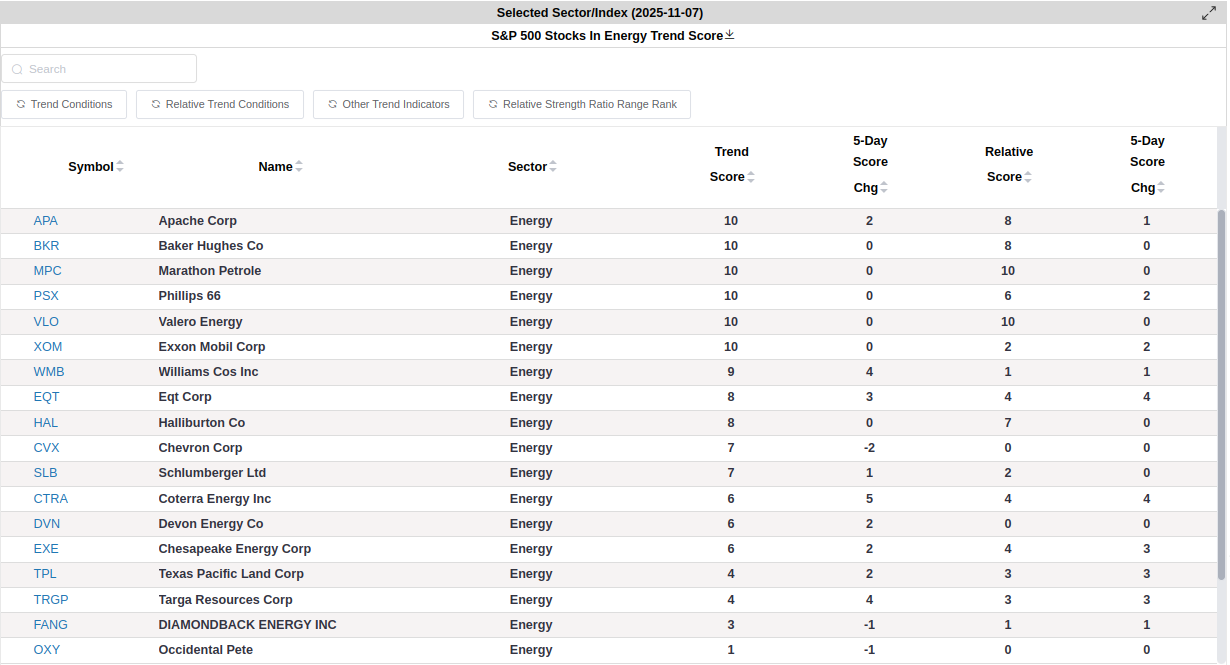
The table below lists stocks in the Energy sector along with their absolute trend scores and relative trend scores.

What the research tells us...

When energy sector members trading above their respective 10-day average reverses from oversold to overbought, the momentum thrust begets more momentum. Similar setups to what we're seeing now have preceded rising energy stock prices, especially in the 6-month window. If we include a trend filter, the signal results look even better. 

PRODUCTS
SentimenTrader
Trading Tools
Indicators & Data API
‍
Strategies & Scanner
‍
Research Reports
FREE
RESOUrCES
Simple Backtest
Calculator
Simple Seasonality
Calculator
The Kelly Criterion
Calculator
Sentiment Geo Map
‍
Public Research Reports
‍
Education
Sentiment Indicators
‍
Technical Indicators
‍
Pricing
Bundle pricing
‍
FAQ
‍
Announcements
‍
COMPANY
‍
About
‍
In the News
‍
Testimonials
‍
Client Success Stories
CONTACT
‍
General Inquiries
‍
Media Inquiries
‍
Financial Professionals Inquiries
‍
© 2026 Sundial Capital Research Inc. All rights reserved.
Setsail Marketing
TermsPrivacyAffiliate Program
Risk Disclosure: The information and tools provided are for research and analytical purposes only and are not intended as investment advice. Market analysis involves uncertainty, and outcomes may differ from expectations. Users should conduct their own due diligence and consider their individual circumstances before making any financial decisions. Past performance is not necessarily indicative of future results.

Hypothetical Performance Disclosure: Hypothetical performance results have many inherent limitations, some of which are described below. No representation is being made that any account will or is likely to achieve profits or losses similar to those shown; in fact, there are frequently sharp differences between hypothetical performance results and the actual results subsequently achieved by any particular trading program. One of the limitations of hypothetical performance results is that they are generally prepared with the benefit of hindsight. In addition, hypothetical trading does not involve financial risk, and no hypothetical trading record can completely account for the impact of financial risk of actual trading. for example, the ability to withstand losses or to adhere to a particular trading program in spite of trading losses are material points which can also adversely affect actual trading results. There are numerous other factors related to the markets in general or to the implementation of any specific trading program which cannot be fully accounted for in the preparation of hypothetical performance results and all which can adversely affect trading results.

Testimonial Disclosure: Testimonials appearing on this website may not be representative of other clients or customers and is not a guarantee of future performance or success.