Products
SentimenTrader Trading Tools
‍
Backtest Engine
My Trading Toolkit
Correlation Analysis
Seasonality
Market Prediction
Indicators & Data API
‍
Proprietary Indicators & Charts
Market Data API
Strategies & Scanner
‍
50+ Trading Strategies
Smart Stock Scanner
Smart Option Scanner
Research Reports
‍
Research Solutions
Reports Library
Free Resources
Simple Backtest Calculator
Simple Seasonality Calculator
The Kelly Criterion Calculator
Sentiment Geo Map
Public Research Reports
Education
Sentiment Indicators
Technical Indicators
Pricing
Company
About
In the News
Testimonials
Client Success Stories
Contact
Log inLoginSign up
< BACK TO ALL REPORTS

An End-of-October Signal for Stock Traders

Jay Kaeppel
2025-10-31
The S&P 500 will close October with a double-digit year-to-date gain. Historically, this bodes well for stocks over the next two months. Details herein.

Key points:

  • As October comes to a close, it can be helpful to look at how the stock market has performed during the first ten months
  • With one day to go, the S&P 500 is up 16% year-to-date
  • Historically, January through October gains in excess of 10% have presaged positive results over the next two months

When the S&P 500 is up 10% or more at the end of October

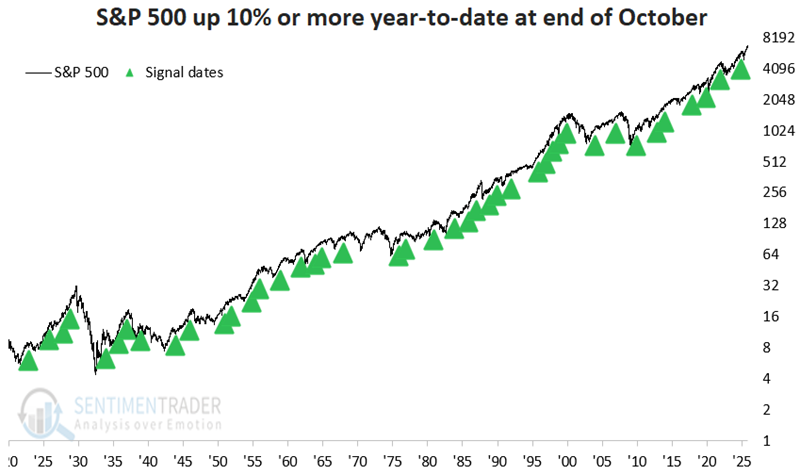
The chart below highlights all years since 1920 when the S&P 500 Index was up 10% or more for the year by the end of October. This has happened 42 times between 1920 and 2024. With the S&P 500 up 16% through the next-to-last trading day of October, 2025 is poised to be number 43.

The table below summarizes S&P 500 performance after October 31st during the years highlighted in the chart above. The key thing to note is the performance over the next two months.
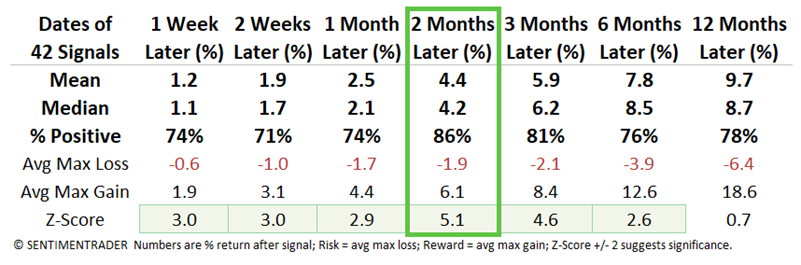
Key things to note:

  • 86% Win Rate
  • 4.2% Median Gain
  • An impressive Z-Score of 5.1

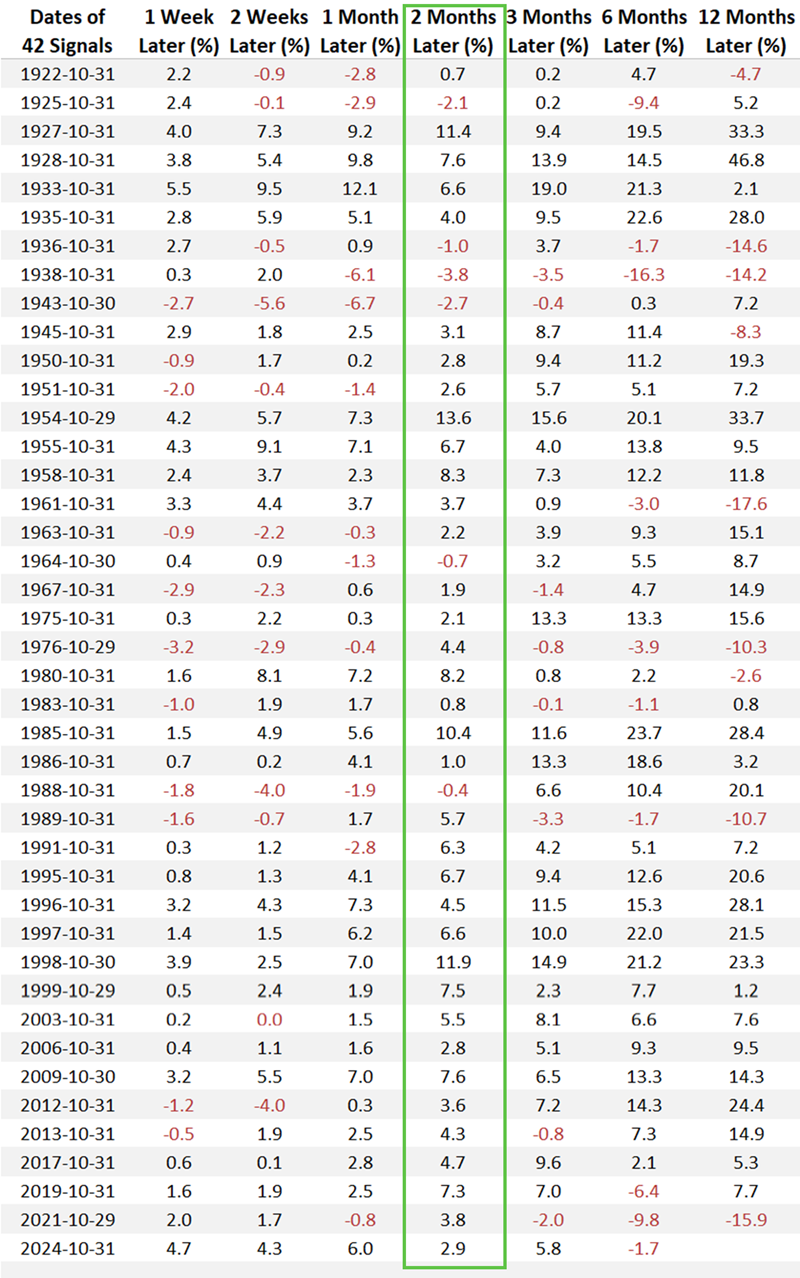
The table below displays all performance results for the S&P 500 after the end of October signals highlighted above.

The chart below displays the hypothetical growth of $1 invested in the S&P 500 only during November and December (using month-end prices) after the S&P 500 showed a 10%+ gain for the year through the end of October.

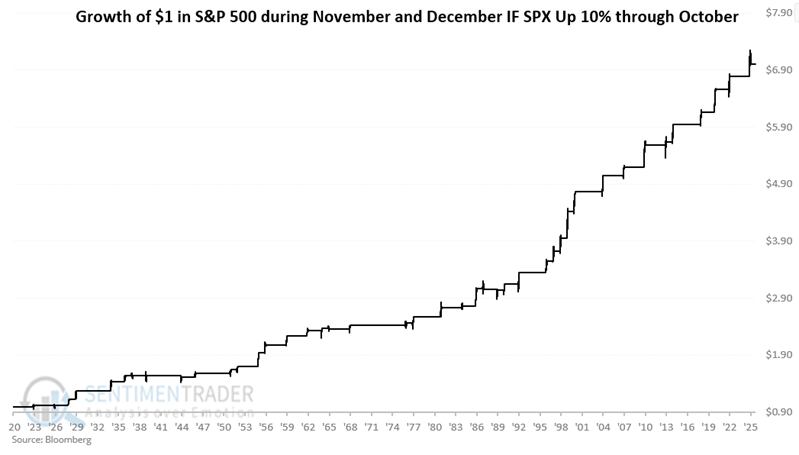
Notice anything about the chart above? The lack of severe declines is hard to miss. The worst performance to date was a manageable -3.8% decline in November and December of 1938. Of course, this doesn't mean the next two months won't show a loss, nor that a decline of more than -3.8% is not possible. In fact, intra-trade drawdowns exceeding -5% are not uncommon. However, the key point is that this setup represents a decent opportunity for a speculator willing to take a moderate risk over a two-month period.

What the research tells us…

Now that October appears poised to close with a year-to-date gain above 10%, is the stock market sure to move higher by year-end? Not at all. However, history strongly suggests that it is the way to bet. An 86% historical Win Rate during a typically seasonally strong time of year suggests favorable odds. Nevertheless, traders are encouraged to allocate capital intelligently and to contemplate what action they might take if things do not go as planned.

PRODUCTS
SentimenTrader
Trading Tools
Indicators & Data API
‍
Strategies & Scanner
‍
Research Reports
FREE
RESOUrCES
Simple Backtest
Calculator
Simple Seasonality
Calculator
The Kelly Criterion
Calculator
Sentiment Geo Map
‍
Public Research Reports
‍
Education
Sentiment Indicators
‍
Technical Indicators
‍
Pricing
Bundle pricing
‍
FAQ
‍
Announcements
‍
COMPANY
‍
About
‍
In the News
‍
Testimonials
‍
Client Success Stories
CONTACT
‍
General Inquiries
‍
Media Inquiries
‍
Financial Professionals Inquiries
‍
© 2026 Sundial Capital Research Inc. All rights reserved.
Setsail Marketing
TermsPrivacyAffiliate Program
Risk Disclosure: The information and tools provided are for research and analytical purposes only and are not intended as investment advice. Market analysis involves uncertainty, and outcomes may differ from expectations. Users should conduct their own due diligence and consider their individual circumstances before making any financial decisions. Past performance is not necessarily indicative of future results.

Hypothetical Performance Disclosure: Hypothetical performance results have many inherent limitations, some of which are described below. No representation is being made that any account will or is likely to achieve profits or losses similar to those shown; in fact, there are frequently sharp differences between hypothetical performance results and the actual results subsequently achieved by any particular trading program. One of the limitations of hypothetical performance results is that they are generally prepared with the benefit of hindsight. In addition, hypothetical trading does not involve financial risk, and no hypothetical trading record can completely account for the impact of financial risk of actual trading. for example, the ability to withstand losses or to adhere to a particular trading program in spite of trading losses are material points which can also adversely affect actual trading results. There are numerous other factors related to the markets in general or to the implementation of any specific trading program which cannot be fully accounted for in the preparation of hypothetical performance results and all which can adversely affect trading results.

Testimonial Disclosure: Testimonials appearing on this website may not be representative of other clients or customers and is not a guarantee of future performance or success.