Products
SentimenTrader Trading Tools
‍
Backtest Engine
My Trading Toolkit
Correlation Analysis
Seasonality
Market Prediction
Indicators & Data API
‍
Proprietary Indicators & Charts
Market Data API
Strategies & Scanner
‍
50+ Trading Strategies
Smart Stock Scanner
Smart Option Scanner
Research Reports
‍
Research Solutions
Reports Library
Free Resources
Simple Backtest Calculator
Simple Seasonality Calculator
The Kelly Criterion Calculator
Sentiment Geo Map
Public Research Reports
Education
Sentiment Indicators
Technical Indicators
Pricing
Company
About
In the News
Testimonials
Client Success Stories
Contact
Log inLoginSign up
< BACK TO ALL REPORTS

An easing in financial conditions triggers a buy signal for stocks

Dean Christians
2023-01-11
A trading system that monitors financial conditions for tightening or easing environments issued a new buy signal for stocks. After an easing in conditions, stocks tend to trend upward and annualize at a higher rate when compared to periods when conditions are tightening.

Key points:

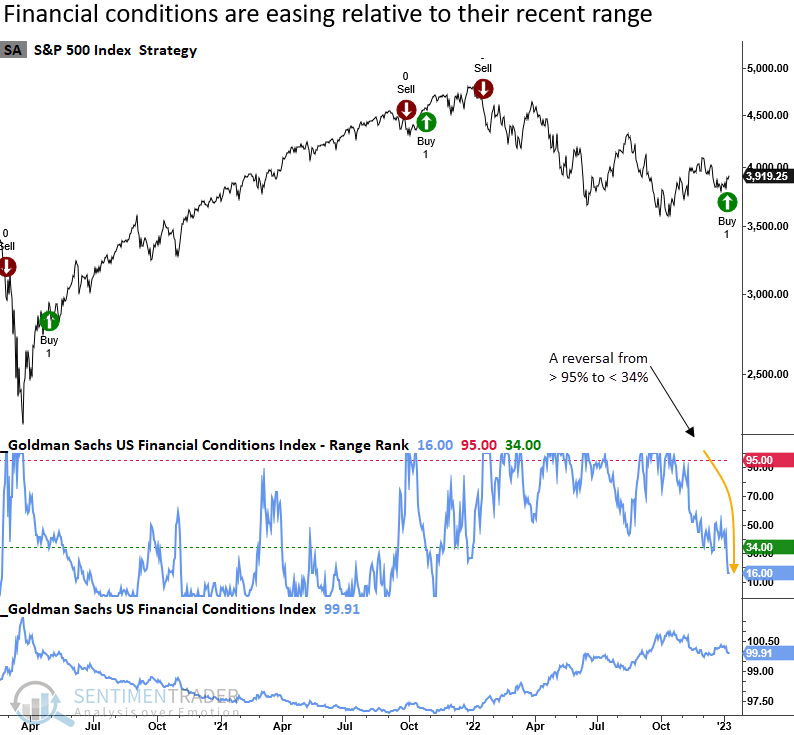
  • The Goldman Sachs Financial Conditions Index reversed lower relative to its recent range
  • A trading system based on the GS Financial Conditions Index triggered a buy signal
  • After similar alerts, annualized returns for the S&P 500 were higher when compared to sell signals

Financial conditions are easing, which is good news for stocks

The Federal Reserve and other central banks around the globe increased interest rates in 2022 at one of the fastest paces in history. The goal was to tighten financial conditions so economies would slow and inflation would recede from one of the highest levels in more than four decades.  

Generally, stock markets thrive when financial conditions are easing, not tightening, as was the case for most of 2022. 

A trading system that measures when financial conditions are tightening or easing triggered the first buy signal in almost a year.

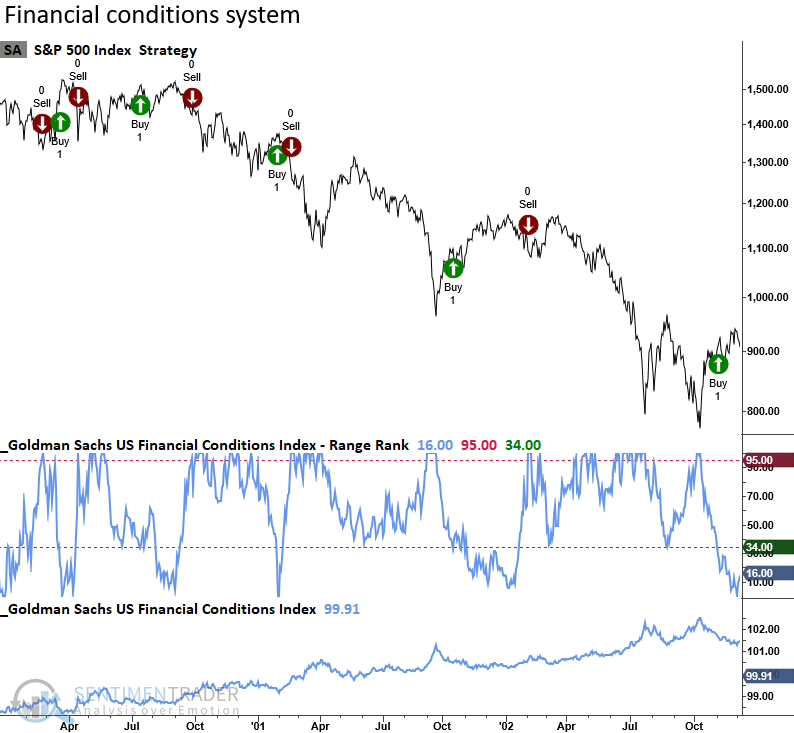
The model applies an 84-day range rank to the Goldman Sachs Financial Conditions Index. When the range rank declines below the 34th percentile and S&P 500 price momentum is positive, the system goes long. Conversely, the model issues a sell signal when the range rank increases above the 95th percentile and the S&P 500 exhibits negative price momentum.

Similar reversals in financial conditions preceded positive returns

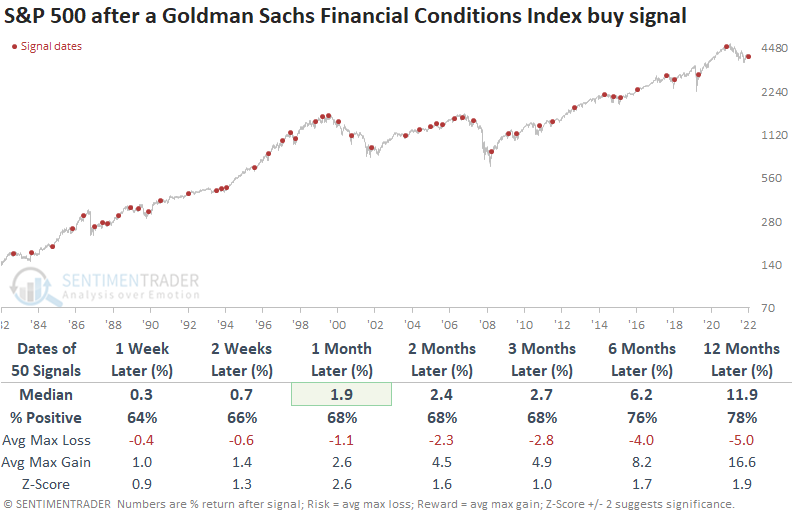
When the range rank for the Goldman Sachs Financial Conditions Index reverses from a period of tightening to easing conditions, the S&P 500 shows a positive upward bias with solid z-scores across most time frames. However, measuring results with an outlook table for a binary trading system has limitations. 

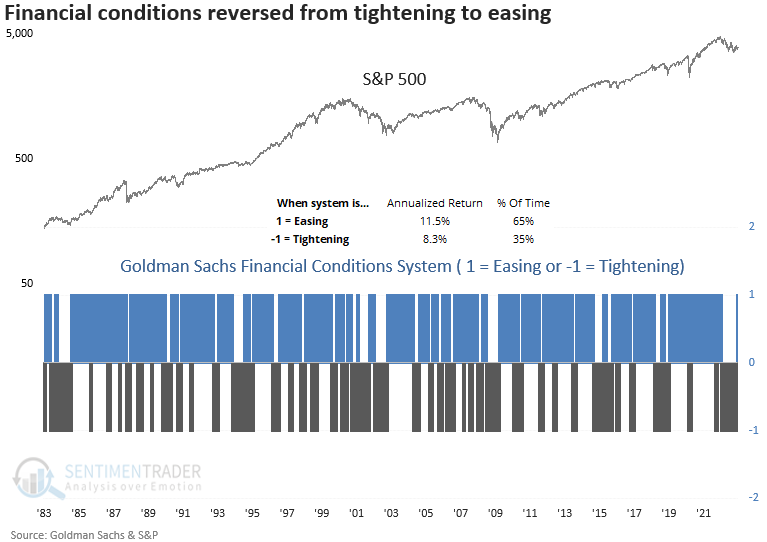
Because the system is either all in or out, annualizing returns for the buy or sell periods is a better performance measure. For instance, when the system issues a buy signal, the S&P 500 annualized at 11.5%, which is 3% more than when the model triggered a sell signal.

If the 8.3% annualized return for sell signals seems high, please remember that the system is not timely around drawdown lows. Significant gains occur between the time the equity market bottoms and a new buy signal, which influences the overall annualized return upward. 

Historical bear market examples

One of the benefits of the financial conditions trading system is that if the model gives a false signal on a countertrend rally in a bear market, it will reverse course, which it did on two occasions in the 2007-09 bear market.

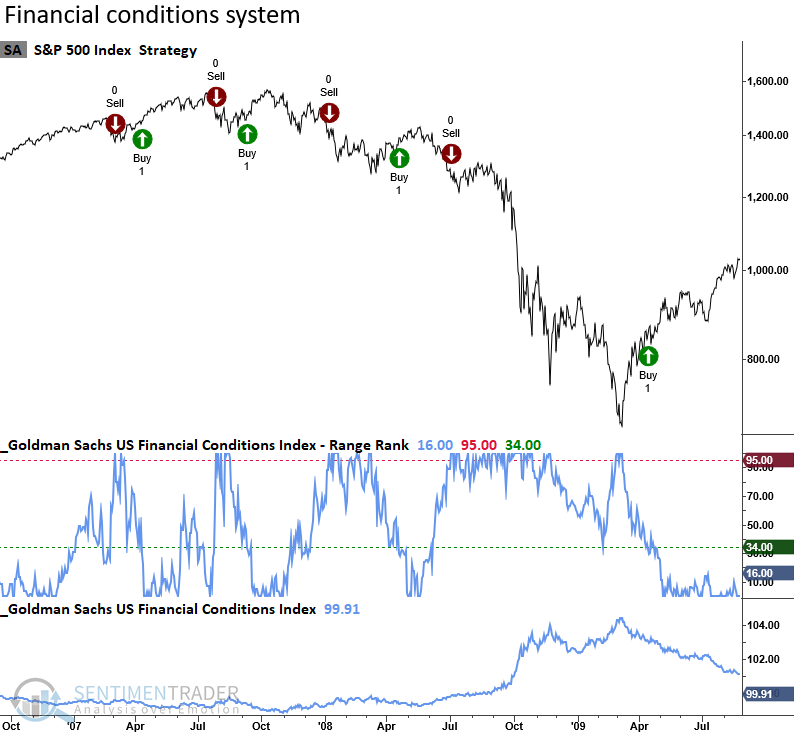
During the 2000-02 bear market, the system generated three buy signals, which the model reversed to avoid the bulk of the notable drawdown.

What the research tells us...

Financial conditions are easing, and that's typically a bullish development for stocks. When the Goldman Sachs Financial Conditions Index declines relative to its current range and price momentum is positive, the S&P 500 trends upward. An assessment of returns under easing conditions shows that the S&P 500 annualizes at 11.5% versus only 8.3% when conditions tighten. As with most binary systems, one should use the outcome as an additional input in a broader model.

PRODUCTS
SentimenTrader
Trading Tools
Indicators & Data API
‍
Strategies & Scanner
‍
Research Reports
FREE
RESOUrCES
Simple Backtest
Calculator
Simple Seasonality
Calculator
The Kelly Criterion
Calculator
Sentiment Geo Map
‍
Public Research Reports
‍
Education
Sentiment Indicators
‍
Technical Indicators
‍
Pricing
Bundle pricing
‍
FAQ
‍
Announcements
‍
COMPANY
‍
About
‍
In the News
‍
Testimonials
‍
Client Success Stories
CONTACT
‍
General Inquiries
‍
Media Inquiries
‍
Financial Professionals Inquiries
‍
© 2026 Sundial Capital Research Inc. All rights reserved.
Setsail Marketing
TermsPrivacyAffiliate Program
Risk Disclosure: The information and tools provided are for research and analytical purposes only and are not intended as investment advice. Market analysis involves uncertainty, and outcomes may differ from expectations. Users should conduct their own due diligence and consider their individual circumstances before making any financial decisions. Past performance is not necessarily indicative of future results.

Hypothetical Performance Disclosure: Hypothetical performance results have many inherent limitations, some of which are described below. No representation is being made that any account will or is likely to achieve profits or losses similar to those shown; in fact, there are frequently sharp differences between hypothetical performance results and the actual results subsequently achieved by any particular trading program. One of the limitations of hypothetical performance results is that they are generally prepared with the benefit of hindsight. In addition, hypothetical trading does not involve financial risk, and no hypothetical trading record can completely account for the impact of financial risk of actual trading. for example, the ability to withstand losses or to adhere to a particular trading program in spite of trading losses are material points which can also adversely affect actual trading results. There are numerous other factors related to the markets in general or to the implementation of any specific trading program which cannot be fully accounted for in the preparation of hypothetical performance results and all which can adversely affect trading results.

Testimonial Disclosure: Testimonials appearing on this website may not be representative of other clients or customers and is not a guarantee of future performance or success.