Products
SentimenTrader Trading Tools
‍
Backtest Engine
My Trading Toolkit
Correlation Analysis
Seasonality
Market Prediction
Indicators & Data API
‍
Proprietary Indicators & Charts
Market Data API
Strategies & Scanner
‍
50+ Trading Strategies
Smart Stock Scanner
Smart Option Scanner
Research Reports
‍
Research Solutions
Reports Library
Free Resources
Simple Backtest Calculator
Simple Seasonality Calculator
The Kelly Criterion Calculator
Sentiment Geo Map
Public Research Reports
Education
Sentiment Indicators
Technical Indicators
Pricing
Company
About
In the News
Testimonials
Client Success Stories
Contact
Log inLoginSign up
< BACK TO ALL REPORTS

An easing in financial conditions bodes well for stocks

Dean Christians
2025-06-05
For only the 13th time since 1984, the Goldman Sachs Financial Conditions Index has cycled from a one-year high to a three-month low, indicating that macroeconomic factors are less burdensome. Similar shifts saw the S&P 500 rise 92% of the time over the subsequent year.

Key points:

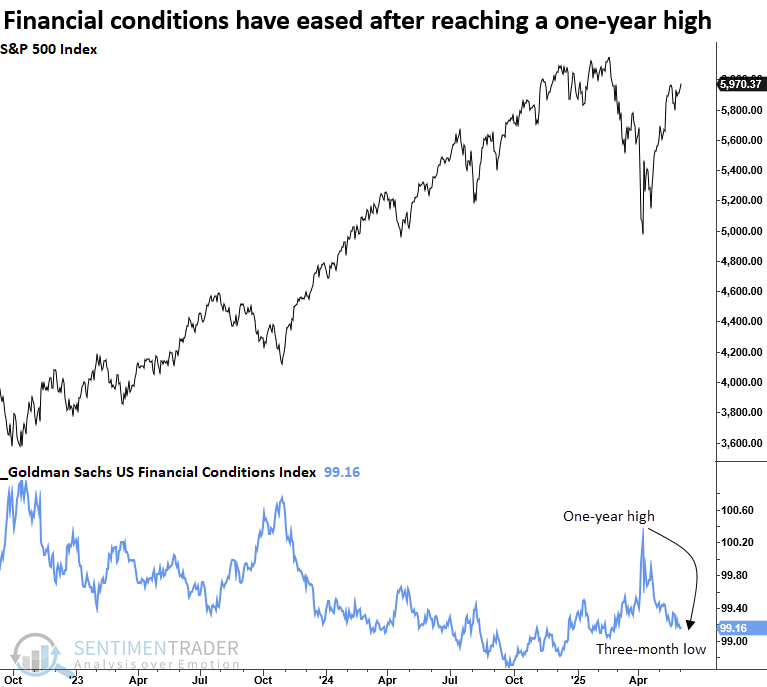
  • The Goldman Sachs Financial Conditions Index cycled from a one-year high to a three-month low
  • Comparable shifts with stocks in an uptrend saw the S&P 500 rise 92% of the time over the next year
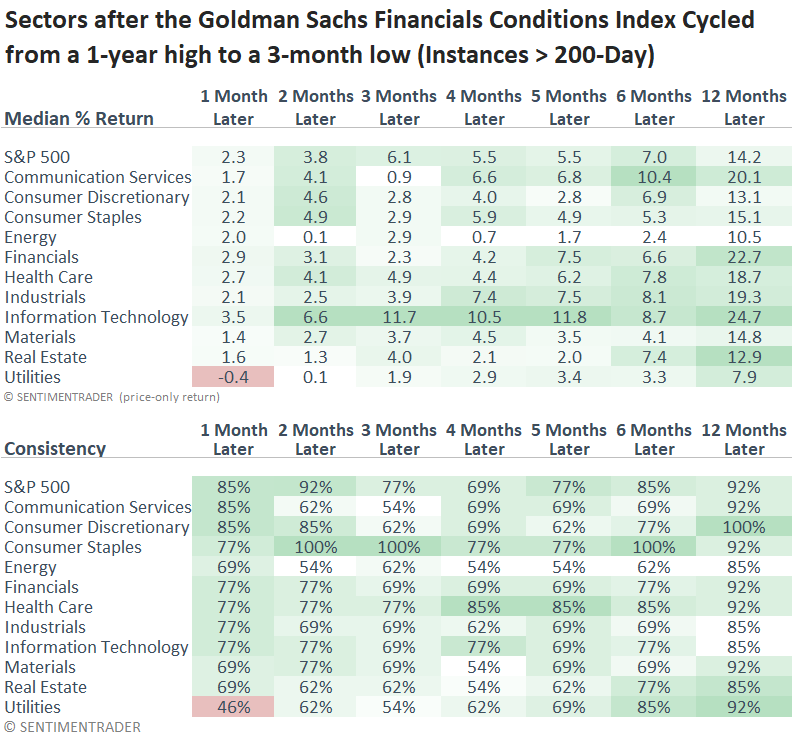
  • Cyclical sectors led, with technology outperforming the S&P 500 across all time frames

One measure of macroeconomic factors suggests a more favorable environment for stocks

The Goldman Sachs Financial Conditions index, which incorporates a policy rate, a long-term bond yield, a credit spread, a valuation metric, and the dollar, surged to a one-year high during the April stock selloff before reversing to a three-month low, signaling less burdensome macro pressures that are generally more supportive for equities.

This easing in financial conditions reinforces the trends we've been highlighting, namely, improved stock participation and a rebound in investor risk appetite, as seen in sentiment data, which strengthens the argument for a sustainable cyclical advance in stocks. 

Similar reversals in financial conditions preceded positive gains for stocks

Each time the Goldman Sachs Financial Conditions Index cycled from a one-year high to a three-month low, with the broad market in a long-term uptrend, the S&P 500 rose in all but one case over the subsequent year, with a median gain of 14%. 

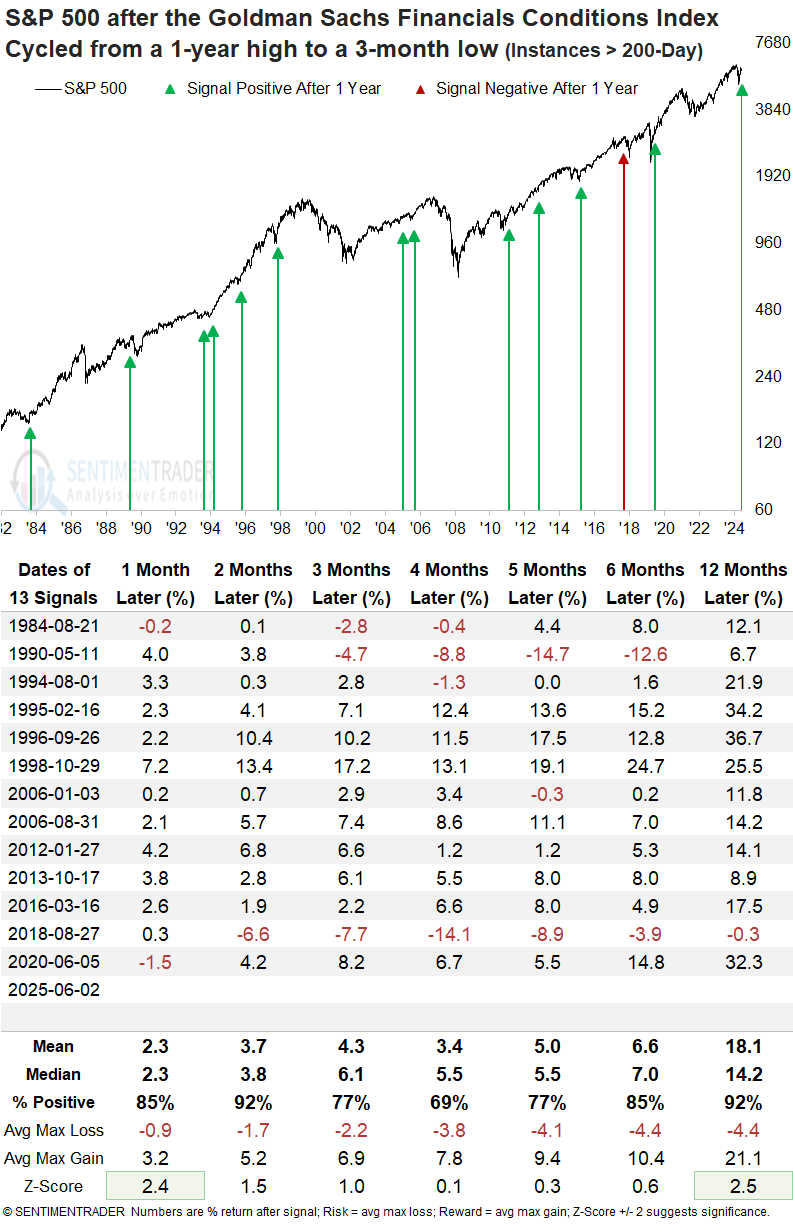
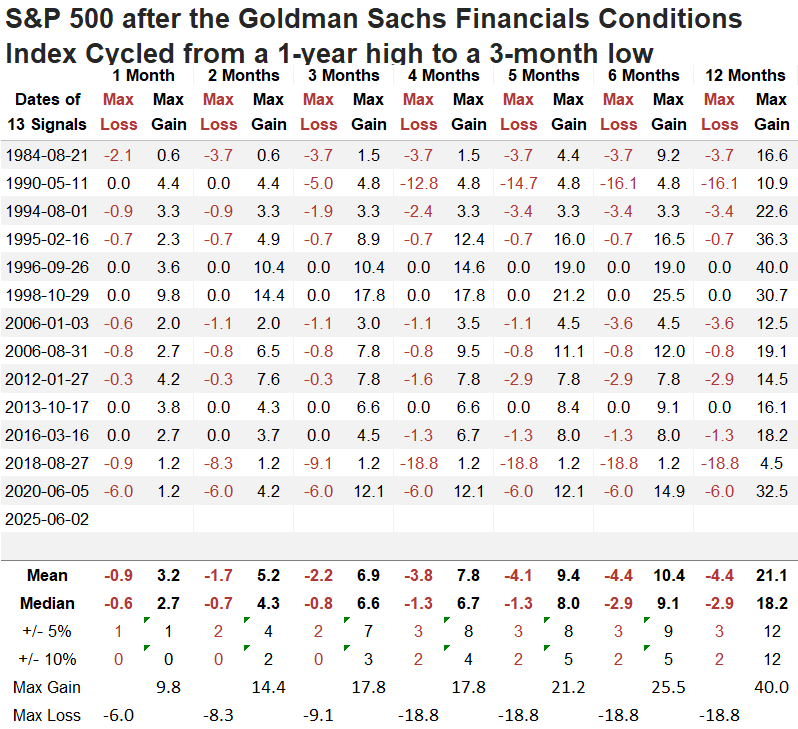
A year later, the S&P 500 declined more than 10% only two times. In contrast, it posted rallies of over 10% in 12 cases, suggesting a favorable risk/reward scenario.

When signals experienced a significant drawdown, such as in 1990 and 2018, the Fed's interest policy couldn't have been more different. In 1990, it had already cut rates five times; in 2018, it hiked them seven times. So, if you're looking for historical analogs, 2018 isn't the best baseline.

Over the next 12 months, the top-performing sectors were technology and financials, with technology posting gains that exceeded the S&P 500 across all periods.  

What does the aggregated evidence indicate? 

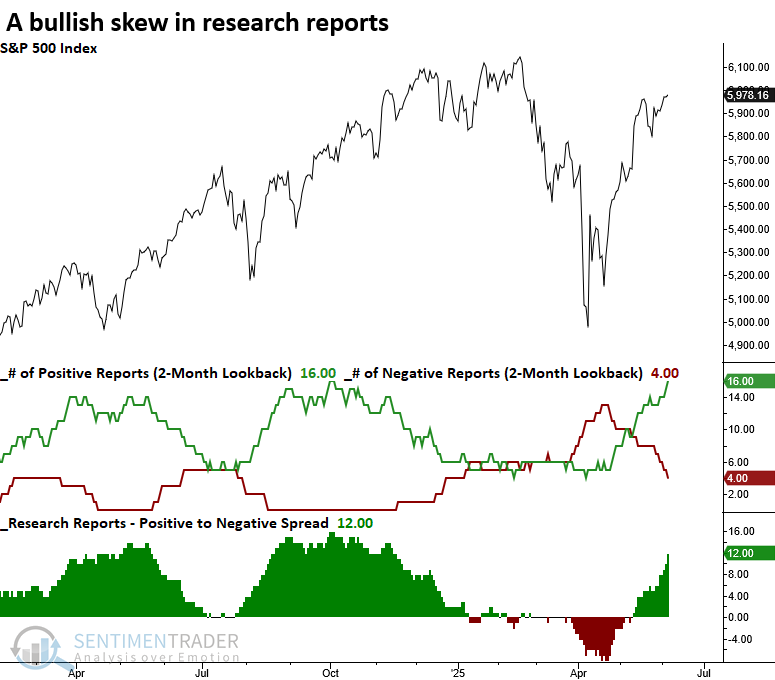
The growing dominance of positive research reports over negative ones is consistent with the behavior of a market in a sustainable uptrend. 

What the research tells us...

The Goldman Sachs Financial Conditions Index declined to a three-month low after reaching a one-year high during the February-April market drawdown. This reversal signals a favorable shift in macroeconomic factors, as tighter conditions had previously weighed on risk assets.  With financial conditions now less burdensome, the environment is turning more favorable for stocks, potentially providing fuel for further gains.  

PRODUCTS
SentimenTrader
Trading Tools
Indicators & Data API
‍
Strategies & Scanner
‍
Research Reports
FREE
RESOUrCES
Simple Backtest
Calculator
Simple Seasonality
Calculator
The Kelly Criterion
Calculator
Sentiment Geo Map
‍
Public Research Reports
‍
Education
Sentiment Indicators
‍
Technical Indicators
‍
Pricing
Bundle pricing
‍
FAQ
‍
Announcements
‍
COMPANY
‍
About
‍
In the News
‍
Testimonials
‍
Client Success Stories
CONTACT
‍
General Inquiries
‍
Media Inquiries
‍
Financial Professionals Inquiries
‍
© 2026 Sundial Capital Research Inc. All rights reserved.
Setsail Marketing
TermsPrivacyAffiliate Program
Risk Disclosure: The information and tools provided are for research and analytical purposes only and are not intended as investment advice. Market analysis involves uncertainty, and outcomes may differ from expectations. Users should conduct their own due diligence and consider their individual circumstances before making any financial decisions. Past performance is not necessarily indicative of future results.

Hypothetical Performance Disclosure: Hypothetical performance results have many inherent limitations, some of which are described below. No representation is being made that any account will or is likely to achieve profits or losses similar to those shown; in fact, there are frequently sharp differences between hypothetical performance results and the actual results subsequently achieved by any particular trading program. One of the limitations of hypothetical performance results is that they are generally prepared with the benefit of hindsight. In addition, hypothetical trading does not involve financial risk, and no hypothetical trading record can completely account for the impact of financial risk of actual trading. for example, the ability to withstand losses or to adhere to a particular trading program in spite of trading losses are material points which can also adversely affect actual trading results. There are numerous other factors related to the markets in general or to the implementation of any specific trading program which cannot be fully accounted for in the preparation of hypothetical performance results and all which can adversely affect trading results.

Testimonial Disclosure: Testimonials appearing on this website may not be representative of other clients or customers and is not a guarantee of future performance or success.