
Amidst all the angst comes the Summer Rally Period

Key Points
- The stock market has shown a long-term tendency to perform less well during the summer months of June/July/August than during the rest of the year
- Results can and do vary significantly from year to year
- However, one summer month period tends to shine (and makes the rest of the summer look that much worse by comparison)
The S&P 500 during June, July, and August
The chart below displays the Annual Seasonal Trend for the S&P 500 Index. Note that the "average" performance during the June/July/August period is a sideways affair. 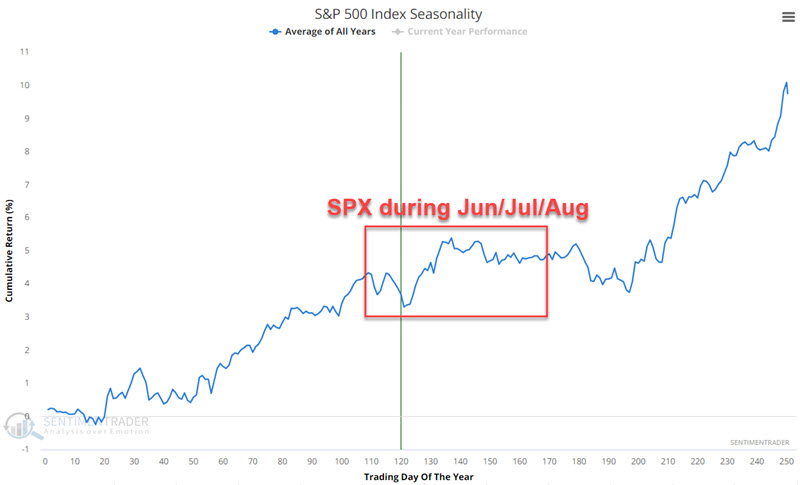 It is important to note that year-to-year performance can vary greatly - with some years showing exceptional gains, others with severe declines, and others still with something resembling the "going nowhere" action shown below. But the bottom line is that investors may be wise to temper their expectations and practice patience during the summer months.
The chart below displays the growth of $1, assuming an investor held a long position in the S&P 500 Index every year ONLY during June, July, and August, starting in 1940 (through 6/24/2024). As you can see, most of the last decade has seen good strength throughout the summer months. However, that is not always the case.
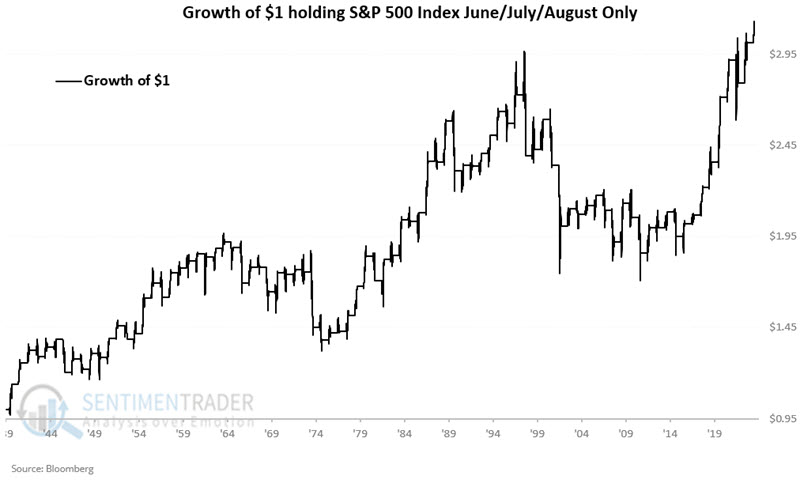
At a glance, the overall results seem OK, if a bit choppy. $1 invested in the S&P 500 only June through August every year since 1940 grew to $3.11, for a cumulative % gain of +211%. Before looking more closely for a "summer rally," let's first put this summer month's performance in perspective versus the rest of the year.
S&P 500 during All Other Months
To put the June/July/August returns from the chart above into perspective, the chart below displays:
- Black line: Growth of $1 for an investor who held a long position in the S&P 500 Index every year ONLY during June, July, and August, starting in 1940
- Blue line: Growth of $1 for an investor who held a long position in the S&P 500 Index every year ONLY during ALL MONTHS OTHER THAN June, July, and August, starting in 1940
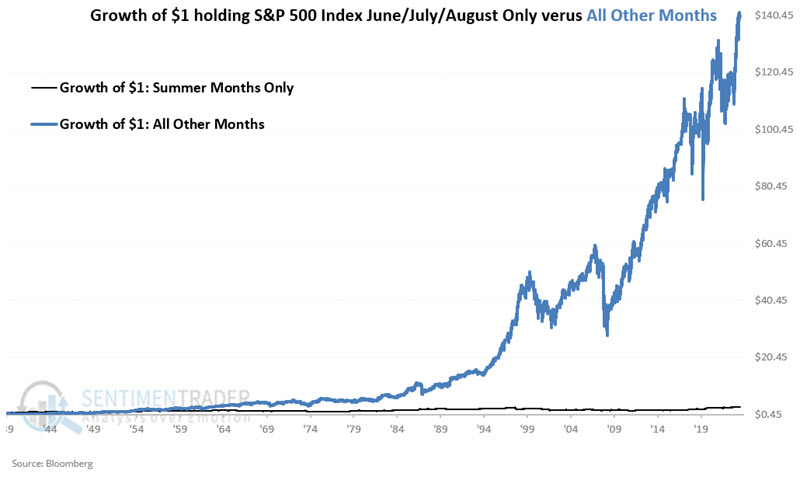
The bottom line:
- June/July/August combined have gained +211% since 1940
- All other months combined have gained +13,931% since 1940
- The annualized compounded rate of return for June/July/August is +5.5%
- The annualized compounded rate of return for all other months is +8.1%
Suddenly, summer month returns don't look so great.
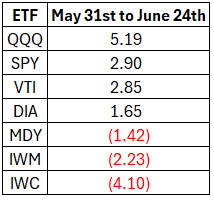
So far, during the summer of 2024, your perception of stock market performance during June depends entirely on where you look. The table below displays the percentage gain or loss of various stock index ETFs so far during the month of June.
Several valid concerns are being raised about the current state of momentum, breadth divergence, and sentiment indicators. Despite these concerns, there is at least one reason for investors to consider holding tight just a little longer.
The Summer Rally Period
The period we will focus on incorporates 12 trading days by combining the following:
- The last three trading days of June
- The first nine trading days of July
We will refer to this as the "Summer Rally Period." For 2024, this period extends from the close on 2024-06-25 through the closing on 2024-07-12.
We will refer to all other trading days during June, July, and August as "All Other Summer Days."
In the chart below:
- The black line displays the growth of $1 for SPX during the "Summer Rally Days"
- The blue line shows the growth of $1 for SPX during "All Other Summer Days"
The test period extends from 1940 through 2024-06-24.
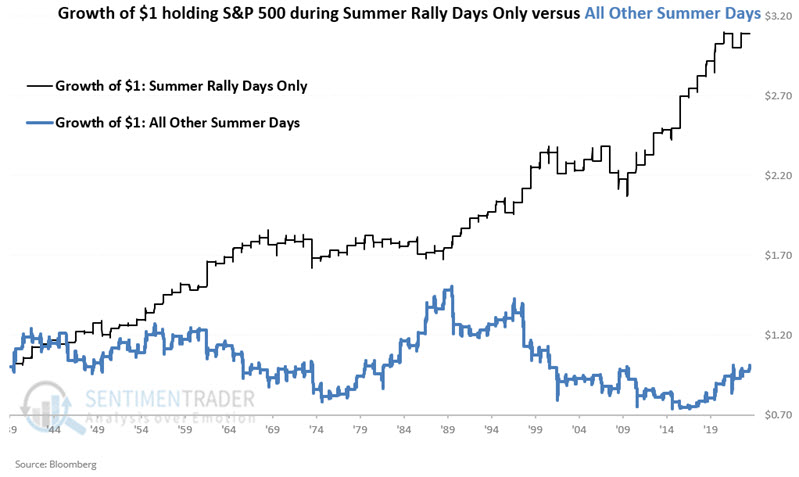
The bottom line:
- During summer rally periods, the S&P 500 has gained +209.2%
- During all other summer days combined, the S&P 500 has gained just +0.5%
For the past 84 years, the S&P 500 Index has essentially broken even during "All Other Summer Days." Of course, results can vary widely from year to year.
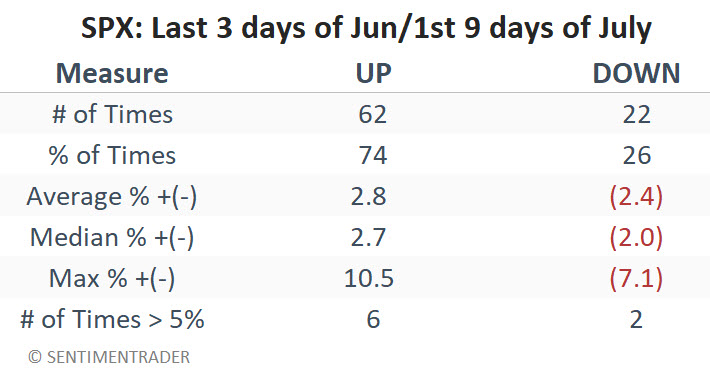
Summary of Results
The table below summarizes results solely for the Summer Rally Periods.
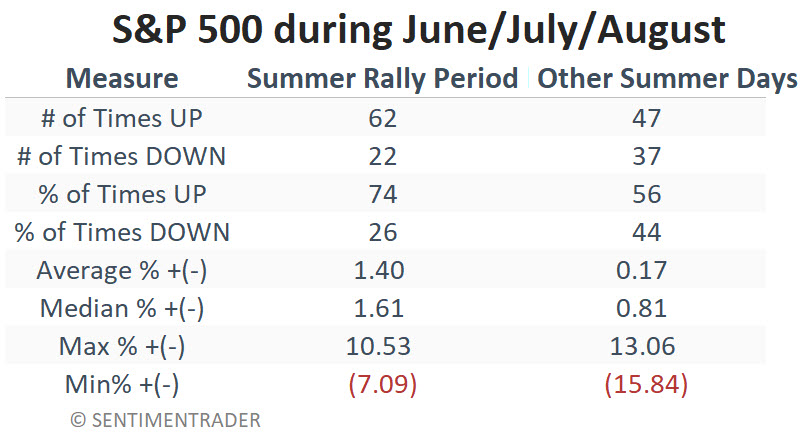
The table below summarizes results for Summer Rally Periods versus All Other Summer Days.
What the research tells us…
As with any seasonal trend, results can vary widely from year to year. That said, traders looking to avoid the "Summertime Blues" might be best advised to give the market the benefit of the doubt from late June into early July and exercise patience and/or caution during other days.