
AMD Stock Surges:A Look at the Historical Precedent

Key points:
- Advanced Micro Devices (AMD) surged 23.7% on October 6th after announcing a strategic partnership with OpenAI, which includes deploying 6 GW of AMD GPU power and an equity tie-up.
- A historical backtest of similar momentum surges in AMD reveals a highly volatile precedent for a simple buy-and-hold strategy, with a median drawdown of -19% over the subsequent year.
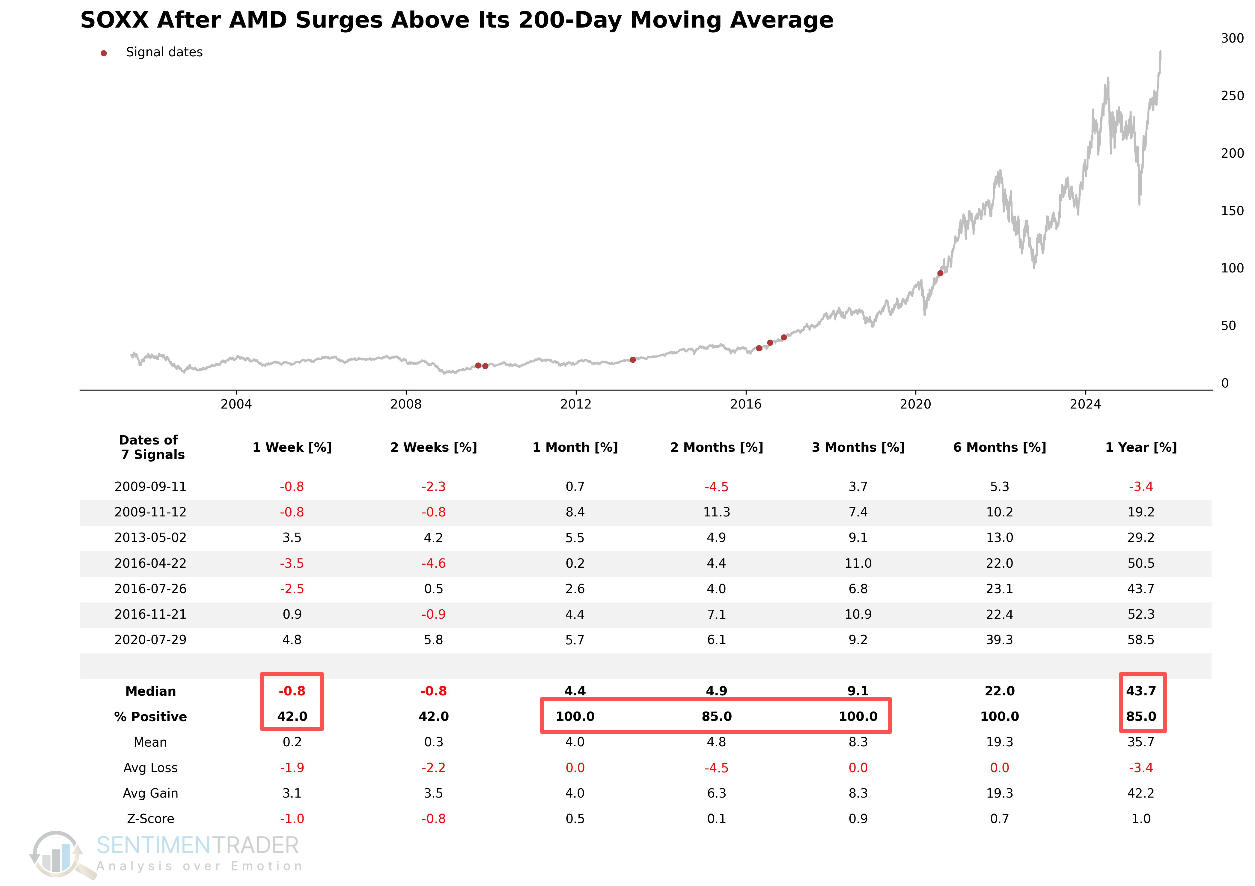
- The momentum signal in AMD has been a powerful bullish indicator for the broader semiconductor sector (SOXX), which has historically shown a 100% win rate one and three months after the signal.
Assessing the Outlook for a Volatile Stock with the Backtest Engine
AMD's price rally on October 6 was fueled by the announcement of a landmark strategic partnership with OpenAI on the same day. The multi-year agreement involves OpenAI deploying 6 gigawatts (GW) of AMD GPU computing power, a scale equivalent to powering millions of AI servers. The first 1 GW of AMD's latest MI450 series GPUs is scheduled to launch in the second half of 2026.
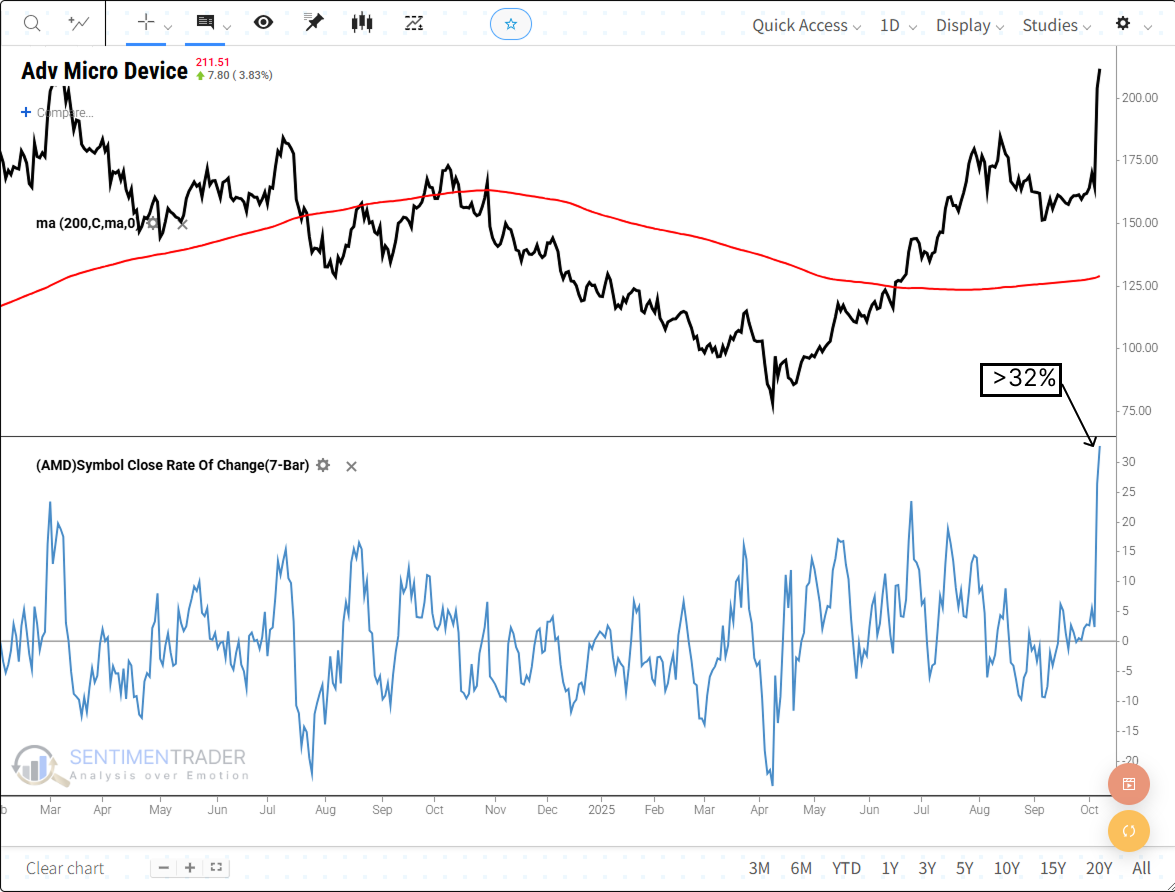
Notably, the deal includes an equity tie-up: AMD granted OpenAI warrants to purchase up to 160 million common shares (approximately 10% of AMD's outstanding stock), with vesting tied to milestones such as computing power deployment progress. This "hardware + equity" binding model, described by analysts as "unprecedented in the semiconductor industry," is expected to generate tens of billions of dollars in revenue for AMD over the next decade and solidify its position as a top AI chip supplier alongside Nvidia. The news sent AMD's stock soaring 23.7% on October 6, contributing to a 7-day gain exceeding 32%-a rare move for a mega-cap stock already in a long-term uptrend above its 200-day moving average.
Following a significant price surge in Advanced Micro Devices (AMD) on Monday, October 6th, a powerful momentum signal has triggered. For a mega-cap semiconductor leader, a 7-day price gain exceeding 32% is a notable event, occurring while the stock is in a long-term uptrend above its 200-day moving average. Such explosive moves often create a dilemma for investors: Do they represent the powerful start of a new leg up, or are they a sign of climactic buying and short-term exhaustion?
To move beyond speculation, let's use historical data to guide our investigation into this rare signal.
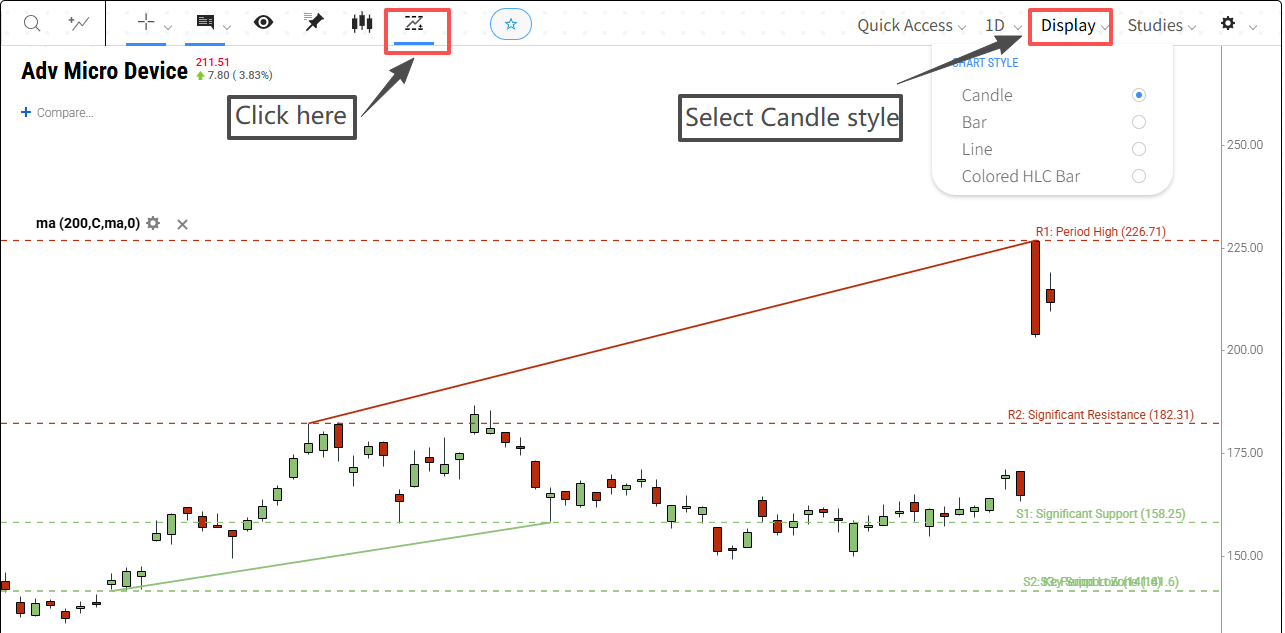
Before diving into the backtest, we're excited to highlight a new, cutting-edge feature on Sentimentrader: AI Trend Insight. This innovative tool automatically identifies and draws significant trendlines, as well as key support and resistance levels on your charts, providing instant technical insights. As you can see in the chart below, AI has already pinpointed important resistance and support zones for AMD, offering valuable context for the recent price action.
Let's first conduct a study to assess the outlook for AMD using a standard buy-and-hold approach for various time frames after the signal has triggered. For related backtest, click here.
A Buy-and-Hold Approach Reveals a Volatile Precedent
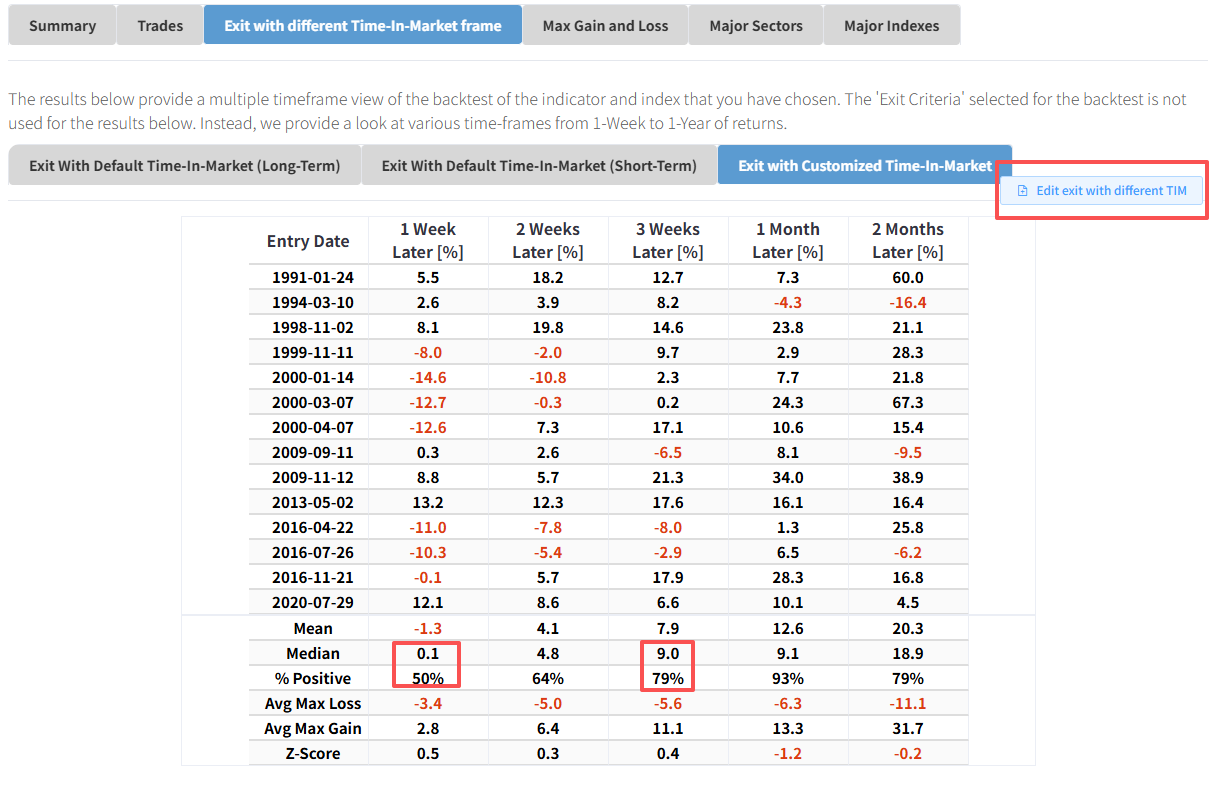
An analysis of the historical performance using a simple buy-and-hold strategy presents a complex and inconsistent picture, particularly in the short term. The median return after one week is near zero (0.1%) with a win rate of only 50%. This suggests that the initial explosive move often generates a period of indecision and consolidation, with neither buyers nor sellers having a clear upper hand in the immediate aftermath. Performance data shows a tendency to improve over the medium term, with the 3-month median return reaching +9.0% with a 79% win rate.
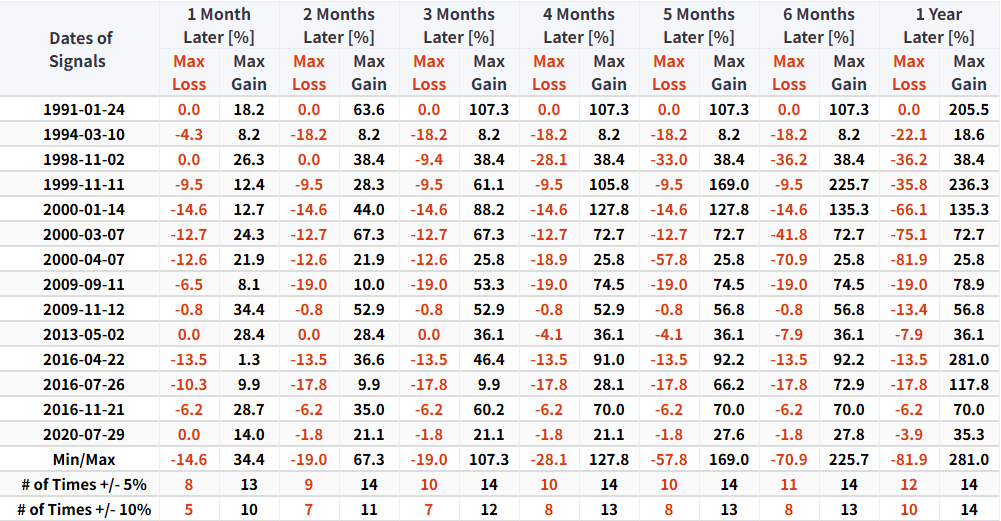
However, an analysis of the maximum drawdowns reveals a history of extreme volatility that cannot be ignored. These are not minor pullbacks; they represent severe, portfolio-altering drawdowns. The median maximum loss over the subsequent year was a substantial -19.0%. Several past signals, especially those around the tech bubble peak in 2000-2001, were followed by drawdowns of more than -50%. This data underscores the inherent volatility of a high-beta stock like AMD, even when the initial signal appears bullish consistent with AMD's historical price swings amid industry competition (e.g., against Intel in CPUs) and technological shifts (e.g., the rise of AI accelerators).
Given the high volatility of the simple buy-and-hold approach, a logical next step in our investigation is to explore whether a different exit strategy could yield more consistent results. The summary table below shows the results for this same entry signal but with a different, unspecified exit condition applied.
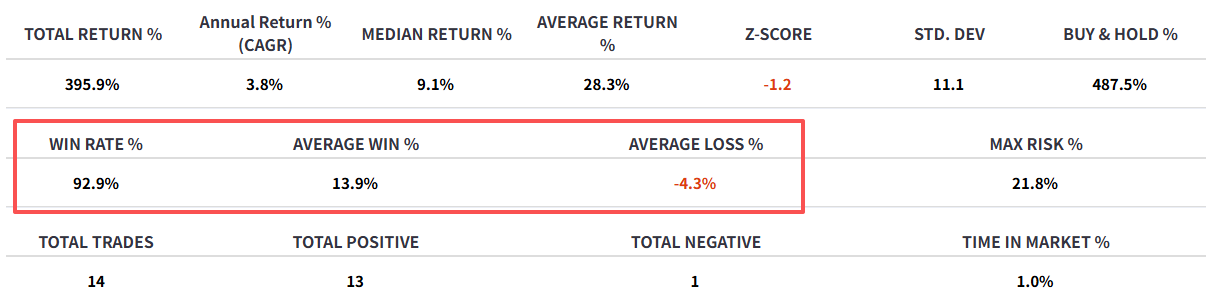
Controlling Risk by Defining a Time Horizon: A 21-Day Exit Strategy
The buy-and-hold backtest revealed a critical challenge: while the initial momentum signal is strong, holding the position indefinitely exposes investors to severe, portfolio-altering drawdowns. This suggests the signal's predictive power may have a limited shelf-life. What if we treat this not as a long-term investment signal, but as a tactical, short-to-medium-term momentum trade? To test this hypothesis, we applied a simple but powerful rule: exit the position exactly 21 trading days (approximately one calendar month) after entry, regardless of profit or loss. This disciplined, time-based exit is designed to capture the initial thrust of the rally while avoiding the subsequent consolidation and potential reversals. The results are striking. As the table below shows, this disciplined approach dramatically improves consistency. The win rate soars to 92.9%, and the average loss is contained to just -4.3%.
An explosive move in a bellwether stock like AMD often has implications for its entire industry. So, a third step is to see how the semiconductor sector ETF (SOXX) has historically performed after one of its key components triggers this powerful momentum signal.
A Bullish Read-Through for the Semiconductor Sector
The historical data for SOXX shows a fascinating pattern of a short-term lag followed by exceptional medium-to-long-term strength. This pattern is logical: the initial spike in AMD might cause some traders to take profits across the sector, leading to brief consolidation. However, as the strength in a leader like AMD is confirmed, capital tends to rotate back into the broader industry especially relevant now, as AMD's OpenAI deal signals growing demand for AI semiconductors, a key growth driver for the sector. In the one and two weeks following the AMD signal, the ETF's performance was inconsistent, with a median return of -0.8% and a win rate of only 42% in the first week.
However, the outlook improves dramatically thereafter. The win rate reaches a perfect 100% at the one-month and three-month marks. One year later, the SOXX ETF showed a powerful median return of +43.7% with an 85% win rate aligning with analysts' forecasts that the global AI semiconductor market will grow at a 28% CAGR through 2030, benefiting companies like Intel, Taiwan Semiconductor (TSMC), and Micron alongside AMD.
What the research tells us...
This investigation into a powerful momentum surge in AMD presents a multi-layered picture. For AMD stock itself, a simple buy-and-hold strategy following the signal has been historically volatile and subject to severe drawdowns, although alternative exit strategies appear to improve consistency especially as investors weigh the long-term upside of the OpenAI partnership against near-term risks (e.g., potential profit-taking after the October rally or delays in computing power deployment).
Perhaps the most significant finding is the signal's read-through for the broader industry. The data shows that the signal in AMD has historically served as a powerful positive indicator for the entire semiconductor sector (SOXX), albeit with a short-term lag. This is particularly meaningful today, as AMD's deal with OpenAI is not just a company-specific win but a sign of robust demand for AI semiconductors a theme that is expected to drive sector growth for years. In summary, the historical data suggests that while directly trading AMD after this signal is a complex and high-risk proposition, the signal itself has been a reliable indicator of underlying strength in the broader semiconductor industry.