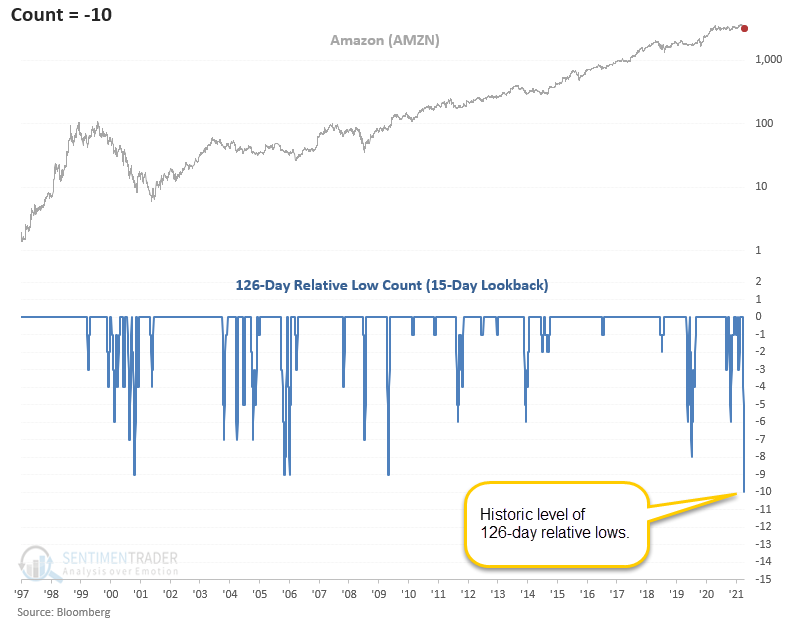
Amazon (AMZN) - Historic Number of Relative Lows

Amazon (AMZN) has registered ten 126-day relative lows versus the S&P 500 in a 15-day trading period. That condition has never occurred since its public debut in 1997.
Let's conduct a study to assess the forward return outlook for amazon when the relative low count reaches six in a 15-day lookback period. I lowered the relative low count to six days so we could assess a larger sample size.
CHART EXAMPLE
I plot the relative low count as a negative value in case I ever want to plot the relative high count in the same chart.
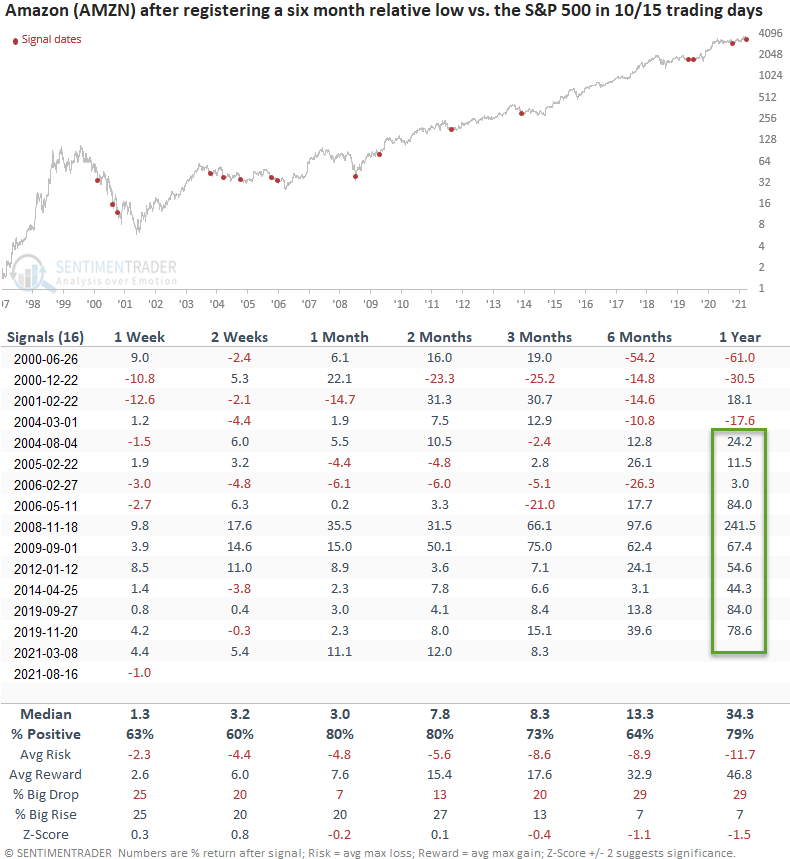
HOW THE SIGNALS PERFORMED
The results look pretty good except for the 2000-02 bear market instances.
Please remember this is a study based on observation and not a trading signal.
Let's apply the same signals to the broad market as measured by the S&P 500 index.
HOW THE SIGNALS PERFORMED - S&P 500
Interestingly, the broad market tended to perform somewhat in line with historical results, except for the 1-week timeframe. I would also note that several timeframes showed a solid risk/reward profile.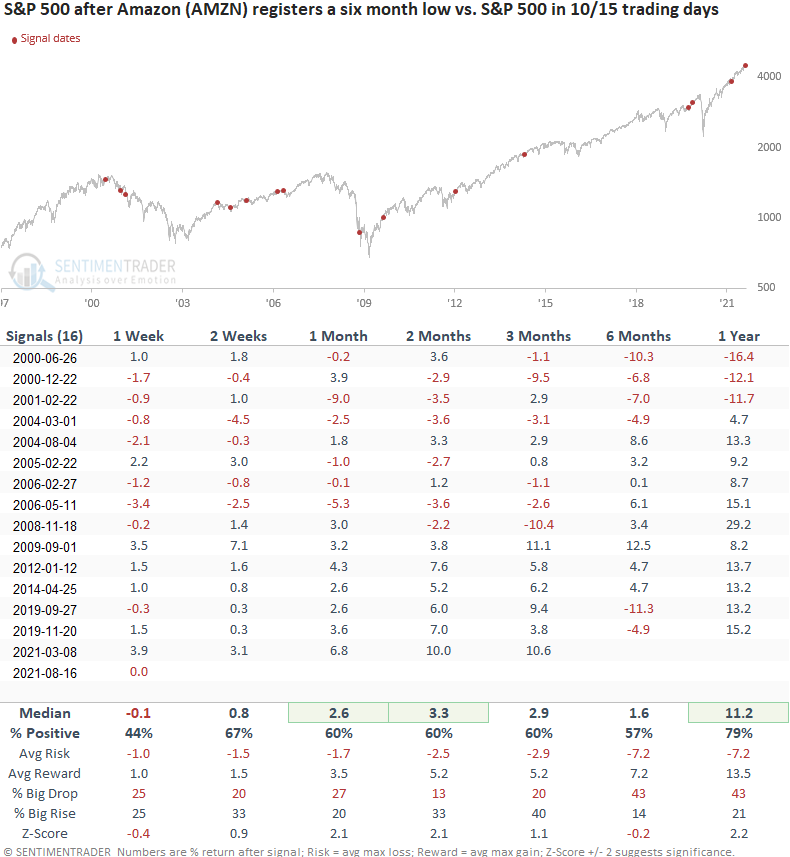
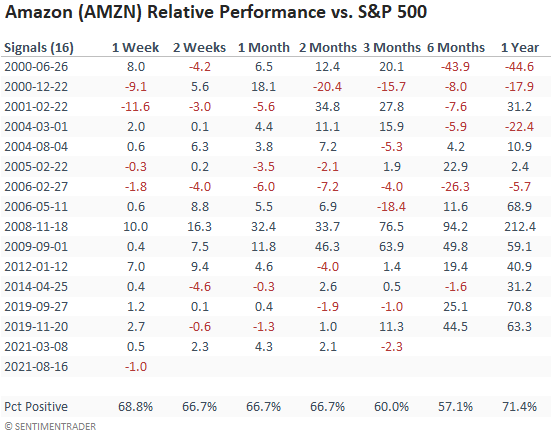
RELATIVE PERFORMANCE
While all of the timeframes show fairly consistent results, I'm a bit surprised it's not better.
The values in the table represent the net difference between the two securities.