
Almost every S&P 500 Financial sector stock is in an uptrend

Key points:
- Almost every S&P 500 Financial sector stock maintains a bullish moving average crossover profile
- Similar trend conditions suggest the uptrend in Financials and the S&P 500 will continue over the next year
- An analysis of financial sector stocks and ETFs highlights ample opportunities for investors
A healthy financial sector usually corresponds to a thriving broader market
Amid the artificial intelligence craze, financial stocks are flying under the radar, benefiting from positive internal and external price trends that position the industry as a compelling investment alternative.
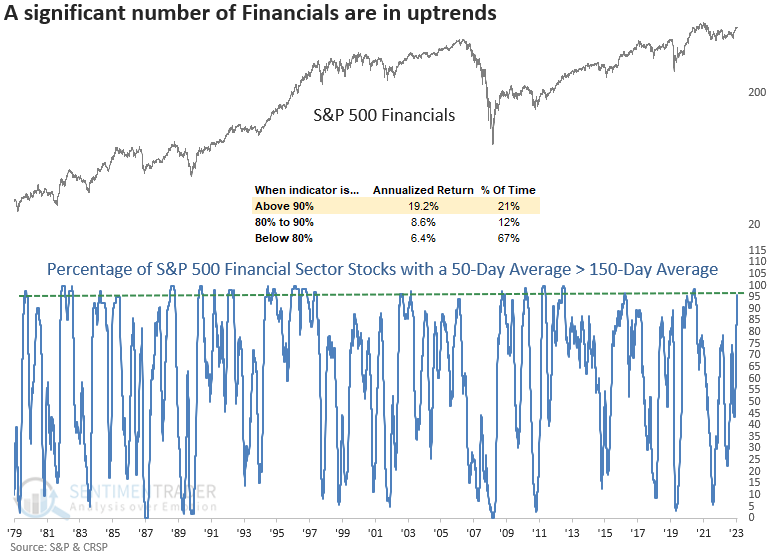
On Wednesday, a trend-following indicator measuring the number of S&P 500 Financial sector stocks with a 50-day average above the 150-day average increased to 95%, recording the highest level in over two years.
The S&P 500 Financials sector shows an annualized return of 19.2% when more than 90% of its members are in uptrends like now.
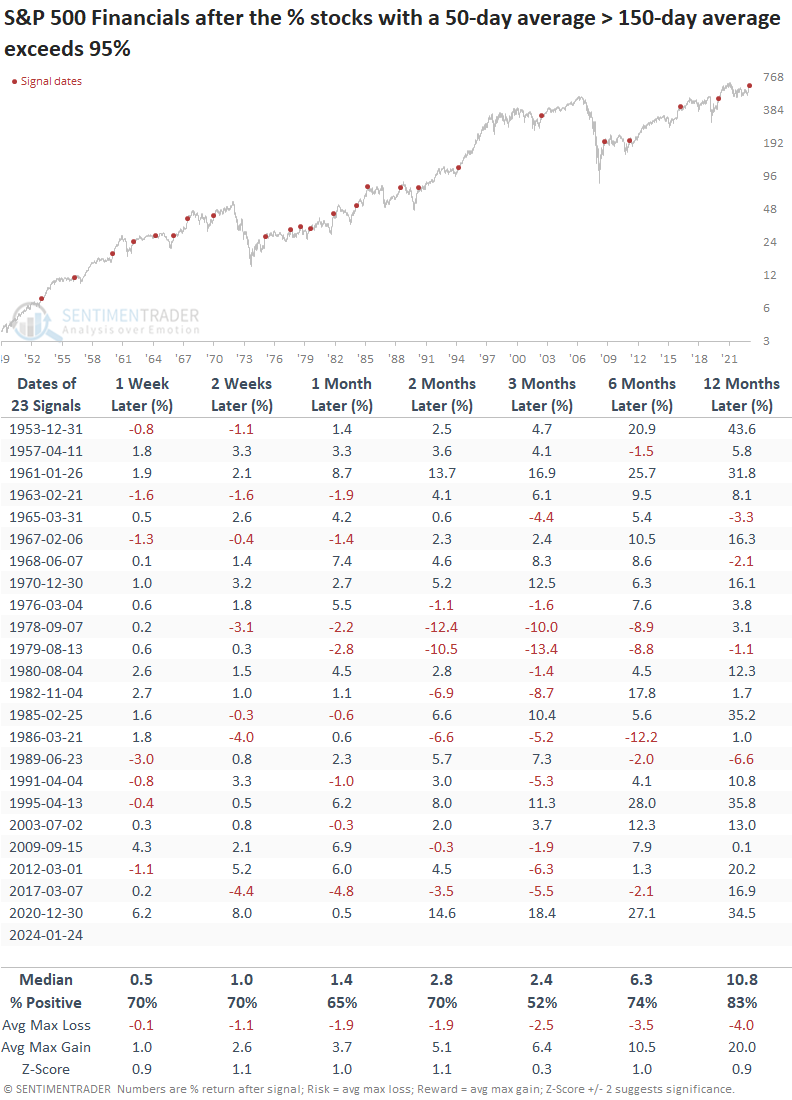
Similar trend conditions preceded a positive outlook
Whenever the percentage of S&P 500 Financial sector stocks with a 50-day average above the 150-day average surpasses 95%, the systematically important sector tended to rise over the subsequent year, with above-average returns compared to any random time.
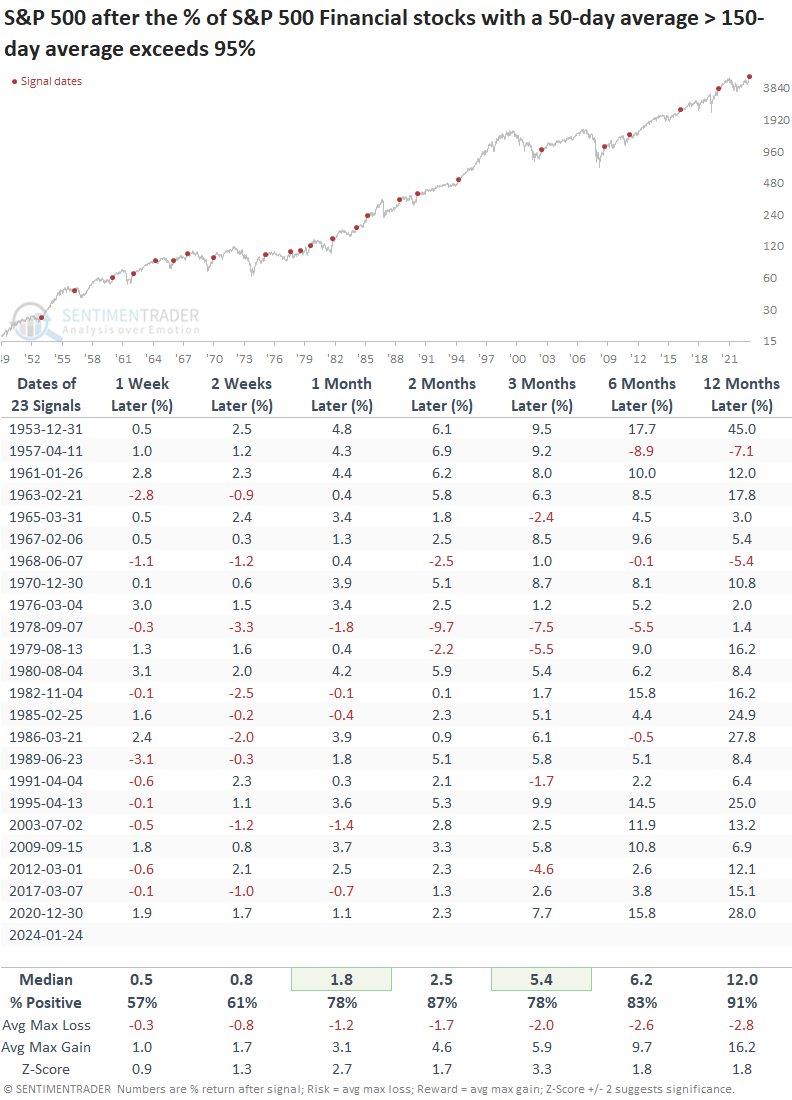
The more critical read-through is for the broad market. When Financials are in gear, the overall market environment is typically favorable.
When a considerable number of Financial stocks are in an uptrend like now, returns and win rates for the S&P 500 were excellent across all time frames, with several horizons showing significance relative to any random time. At some point over the following year, the world's most benchmarked index showed a gain every time.
Absolute and relative trend scores
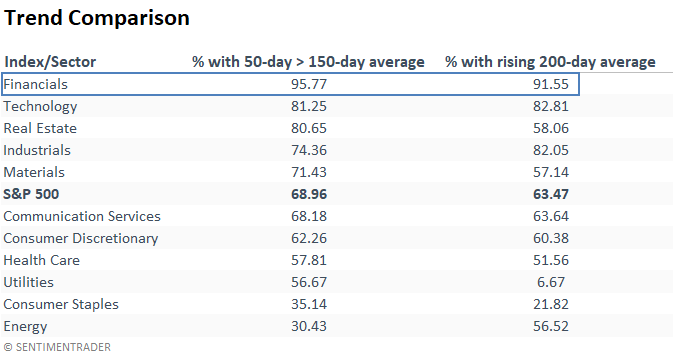
The S&P 500 Financials sector holds the highest percentage of stocks with a positive absolute trend score and the highest level of members with a perfect score of ten. Stocks with positive relative trend scores also look favorable, slightly trailing the leader, Technology. 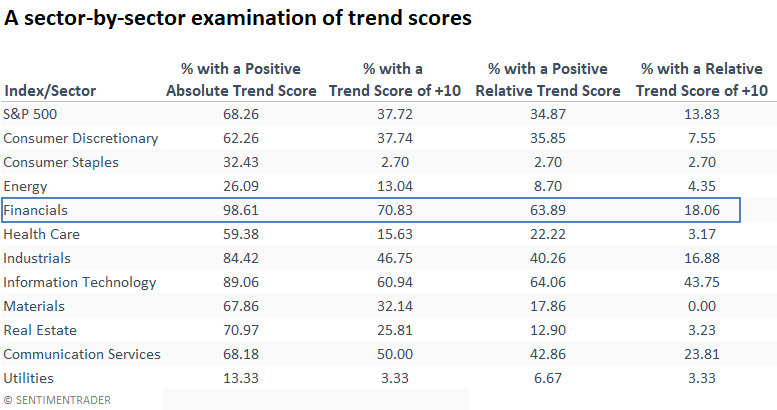
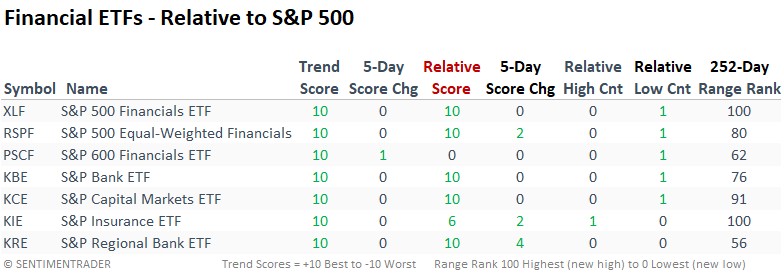
Every financial ETF in the table below maintains a perfect absolute trend score of ten. Therefore, prioritizing the relative trend score is crucial. From a relative perspective, plenty of options are available, as five out of seven ETFs have a score of ten.
The S&P 600 Financials ETF contains REITs, so it's not a pure play on Financials.
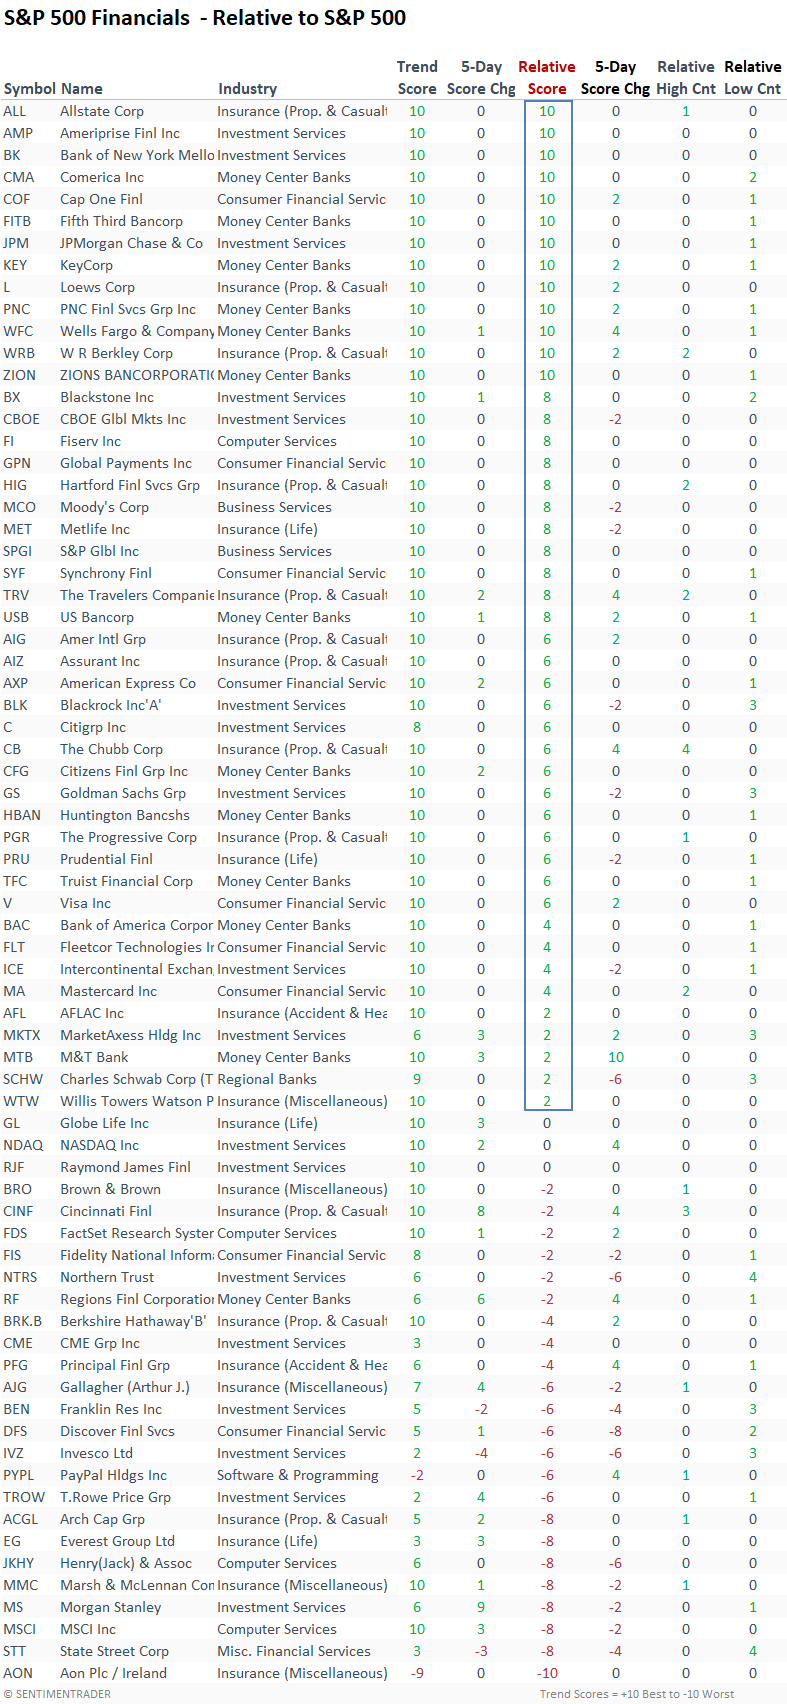
Suppose you're more inclined to examine individual stocks. In that case, positive relative trend scores show a diverse group of industries within financials to choose from. Property and casualty insurance stocks have registered the highest number of 1-month relative highs over the previous week.
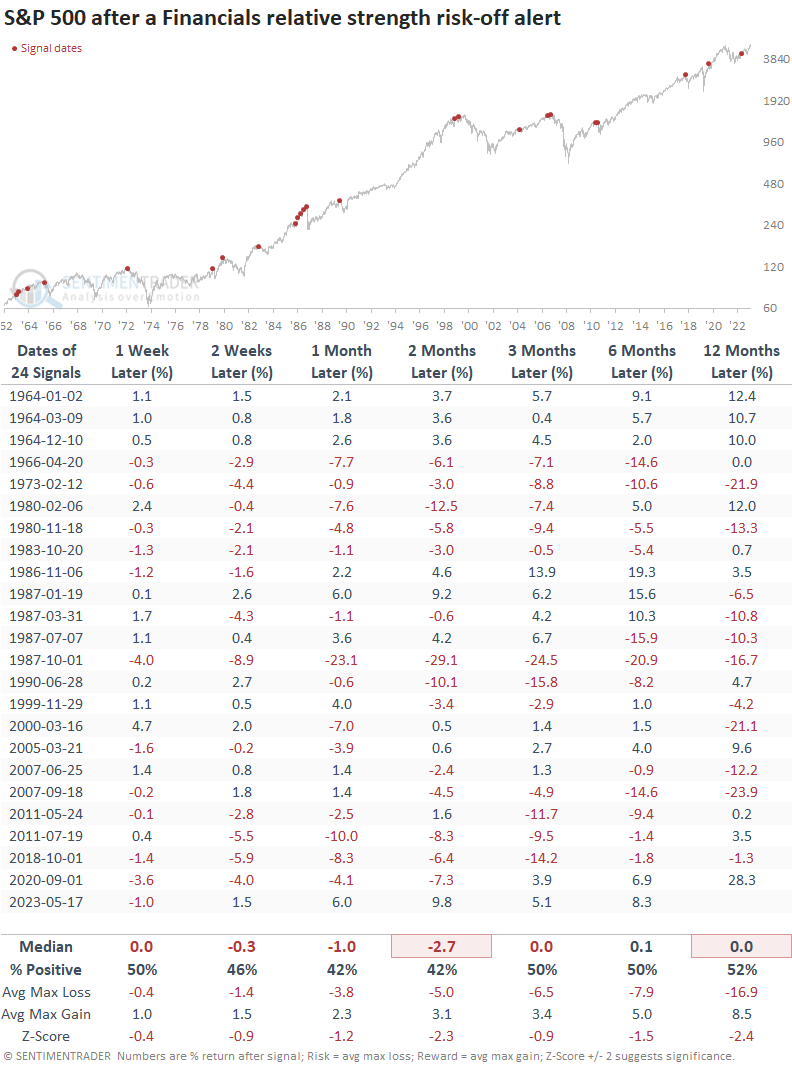
The importance of keeping a close eye on Financials
I occasionally mention Financials as a systematically important sector and with good reason. Severe underperformance by Financials typically precedes broad market peaks, which is why the TCTM Risk Warning Model contains two components with Financials as a data input.
For example, here is how the broad market performs when the financial relative strength risk-off model triggers a warning.
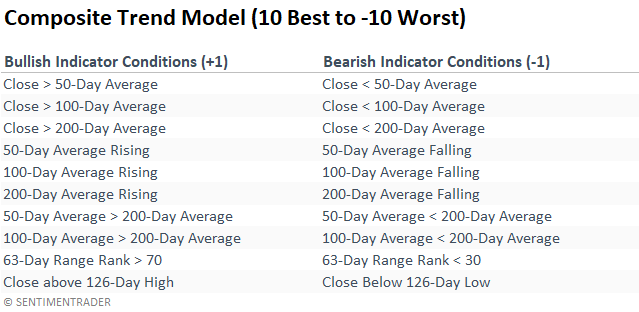
How I calculate the trend score for both absolute and relative composites
What the research tells us...
Almost all S&P 500 Financial sector stocks are in a bullish uptrend as measured by the percentage of members with a 50-day average above the 150-day average. Similar trend conditions tended to foreshadow positive outcomes for the financials sector over the following year, with even more bullish conditions extending to the S&P 500. In broad market uptrends like now, it becomes crucial to leverage relative strength indicators. These tools help identify stocks or ETFs with the highest potential, offering you optimal opportunities to outperform benchmark indices like the S&P 500.