Products
SentimenTrader Trading Tools
‍
Backtest Engine
My Trading Toolkit
Correlation Analysis
Seasonality
Market Prediction
Indicators & Data API
‍
Proprietary Indicators & Charts
Market Data API
Strategies & Scanner
‍
50+ Trading Strategies
Smart Stock Scanner
Smart Option Scanner
Research Reports
‍
Research Solutions
Reports Library
Free Resources
Simple Backtest Calculator
Simple Seasonality Calculator
The Kelly Criterion Calculator
Sentiment Geo Map
Public Research Reports
Education
Sentiment Indicators
Technical Indicators
Pricing
Company
About
In the News
Testimonials
Client Success Stories
Contact
Log inLoginSign up
< BACK TO ALL REPORTS

Almost every risk-on/off indicator shifts to risk-on status

Dean Christians
2024-01-31
The Risk-On/Off indicator, a composite encompassing 21 diverse sentiment and breadth-based measures, increased to 90%, the highest reading since July 2023. Similar conditions led to a temporary pause within a bullish backdrop for the S&P 500.

Key points:

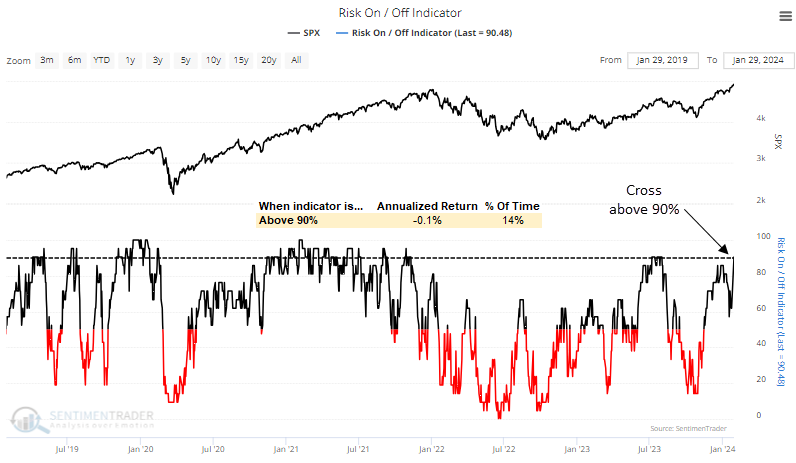
  • The Sentimentrader Risk On/Off Indicator increased above 90% for the first since July 2023
  • Similar readings suggest some short-term digestion within the context of an uptrend

More and more indicators move to a risk-on status 

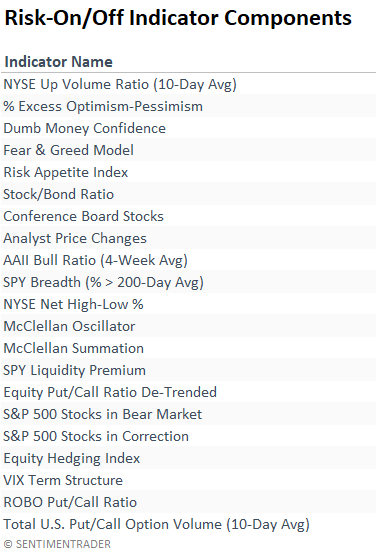
The Risk-On/Off Indicator, a composite encompassing 21 diverse sentiment and breadth-based measures, increased to the highest level since July 2023, with 90% of its components in a bullish status. 

As I noted in my recent report on the Technology sector, sometimes, when everything is in agreement, which is certainly the case now with the members in the Risk-On/Off indicator, the market hits the pause button. Usually, this buyer's exhaustion refreshes a bullish trend backdrop.

This pause scenario is evident in the annualized returns, which are slightly negative when the composite shows a reading above 90%.

The previous signal from July 2023 registered a max gain of 4.3% before the S&P 500 peaked at the end of the month. 

A wide range of sentiment and breadth-based indicators 

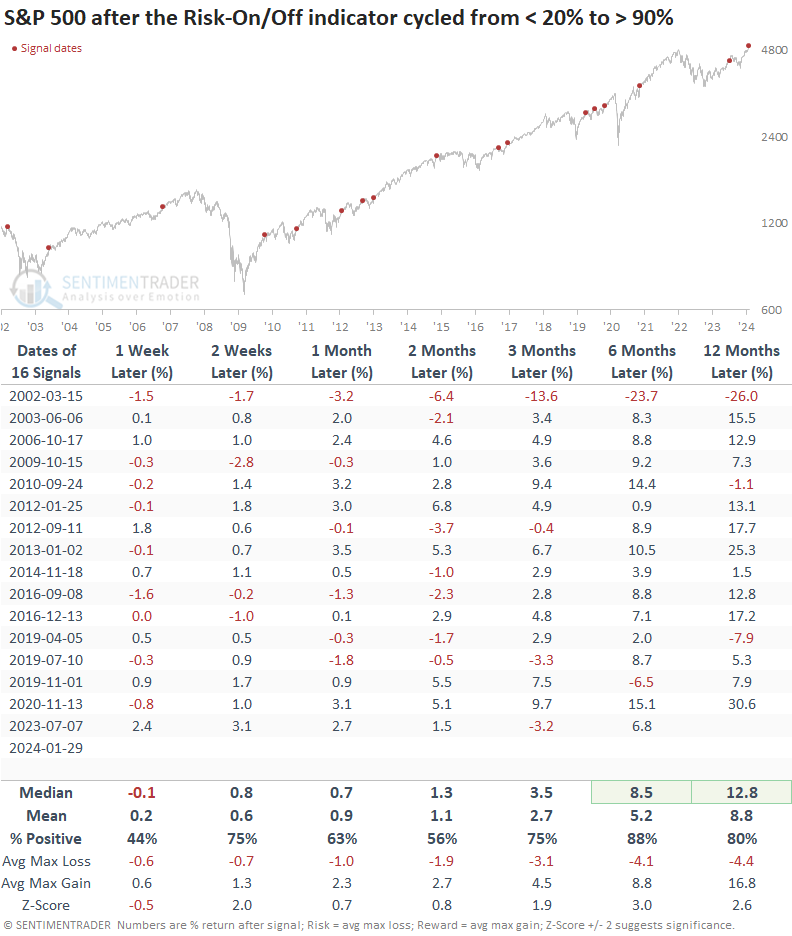
Similar Risk-On/Off indicator conditions occurred during uptrends

Except for 2002, whenever the Risk-On/Off indicator registered a reading of 90% or higher, it consistently signaled a bullish backdrop for the S&P 500. However, this almost near agreement by the components in the composite tended to mark some near-term exhaustion, especially over the following week. And over the subsequent few months, win rates fell short of historical instances in three out of four time periods.

Any digestion of the rapid ascent from last fall will most likely represent a pause, with the world's most benchmarked index showing an 89% win rate over the ensuing six months.
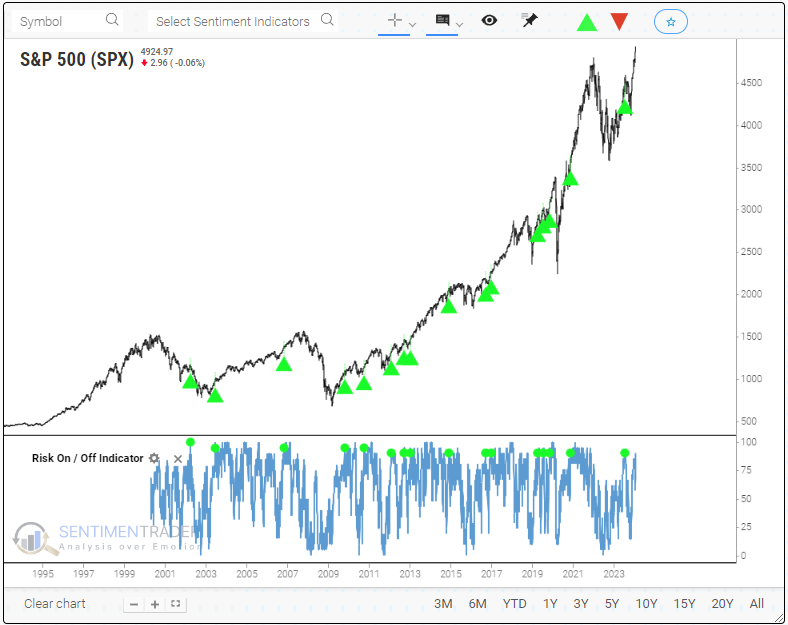
The Backtest Engine

Leverage our advanced backtest engine to construct a multi-condition trading signal, similar to the strategy featured in my recent research note. 

The technology team is actively enhancing the system, with the latest improvement focused on refining the charting experience. Notably, you can assess all historical signals in a single view, eliminating the need to scroll through time.

What the research tells us...

With almost every indicator in the Risk-On/Off composite reflecting a shift to a risk-on status, market conditions are in solid shape, a fairly common trait in uptrends. However, when breadth and sentiment are in near agreement, like now, it can sometimes lead to a pause or buyer's strike. After similar readings in the Risk-On/off indicator, the S&P 500 was higher 89% of the time over the ensuing six months. So, any interruption in momentum is likely to represent a customary consolidation phase, which is entirely normal during a bullish market.

PRODUCTS
SentimenTrader
Trading Tools
Indicators & Data API
‍
Strategies & Scanner
‍
Research Reports
FREE
RESOUrCES
Simple Backtest
Calculator
Simple Seasonality
Calculator
The Kelly Criterion
Calculator
Sentiment Geo Map
‍
Public Research Reports
‍
Education
Sentiment Indicators
‍
Technical Indicators
‍
Pricing
Bundle pricing
‍
FAQ
‍
Announcements
‍
COMPANY
‍
About
‍
In the News
‍
Testimonials
‍
Client Success Stories
CONTACT
‍
General Inquiries
‍
Media Inquiries
‍
Financial Professionals Inquiries
‍
© 2026 Sundial Capital Research Inc. All rights reserved.
Setsail Marketing
TermsPrivacyAffiliate Program
Risk Disclosure: The information and tools provided are for research and analytical purposes only and are not intended as investment advice. Market analysis involves uncertainty, and outcomes may differ from expectations. Users should conduct their own due diligence and consider their individual circumstances before making any financial decisions. Past performance is not necessarily indicative of future results.

Hypothetical Performance Disclosure: Hypothetical performance results have many inherent limitations, some of which are described below. No representation is being made that any account will or is likely to achieve profits or losses similar to those shown; in fact, there are frequently sharp differences between hypothetical performance results and the actual results subsequently achieved by any particular trading program. One of the limitations of hypothetical performance results is that they are generally prepared with the benefit of hindsight. In addition, hypothetical trading does not involve financial risk, and no hypothetical trading record can completely account for the impact of financial risk of actual trading. for example, the ability to withstand losses or to adhere to a particular trading program in spite of trading losses are material points which can also adversely affect actual trading results. There are numerous other factors related to the markets in general or to the implementation of any specific trading program which cannot be fully accounted for in the preparation of hypothetical performance results and all which can adversely affect trading results.

Testimonial Disclosure: Testimonials appearing on this website may not be representative of other clients or customers and is not a guarantee of future performance or success.