Products
SentimenTrader Trading Tools
‍
Backtest Engine
My Trading Toolkit
Correlation Analysis
Seasonality
Indicators & Data API
‍
Proprietary Indicators & Charts
Market Data API
Strategies & Scanner
‍
50+ Trading Strategies
Smart Stock Scanner
Research Reports
‍
Research Solutions
Reports Library
Free Resources
Simple Backtest Calculator
Simple Seasonality Calculator
The Kelly Criterion Calculator
Sentiment Geo Map
Public Research Reports
Pricing
Company
About
In the News
Testimonials
Client Success Stories
Contact
Log inLoginSign up
< BACK TO ALL REPORTS

Almost all Tech stocks are now in uptrends

Jason Goepfert
2023-07-19
In recent days, more than 93% of stocks in the Technology sector have recovered above their 50- and 200-day moving averages, the most in years. When so many stocks in the sector are in medium- and long-term uptrends, the sector tends to keep rising. That is especially the case when these conditions trigger for the first time in over a year.

Key points:

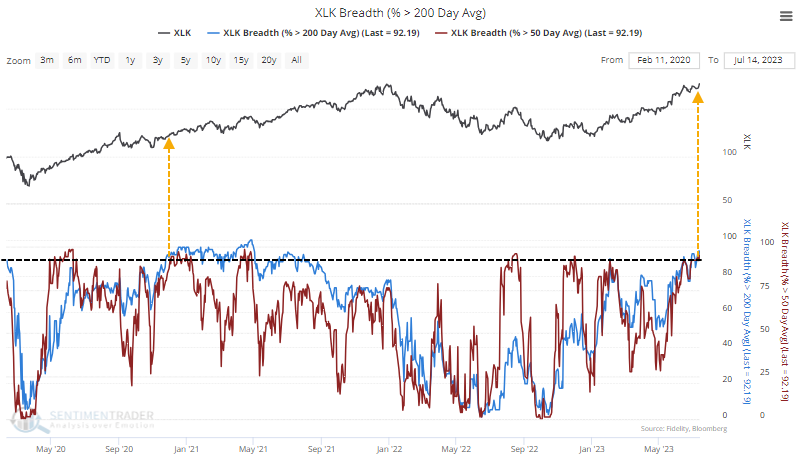
  • More than 93% of Technology stocks were recently above their 50- and 200-day moving averages
  • This is the most in years and ranks among the best trends in 70 years
  • When this many stocks are in uptrends, the sector has a strong record of showing more gains

Almost all Technology stocks are now in uptrends

It's no secret that Technology stocks have roared higher this year, though many seem to attribute it solely to the Magnificent Seven. Those stocks have been a large part of the gains in major indexes but also steal the limelight from what has been good performance under the surface.

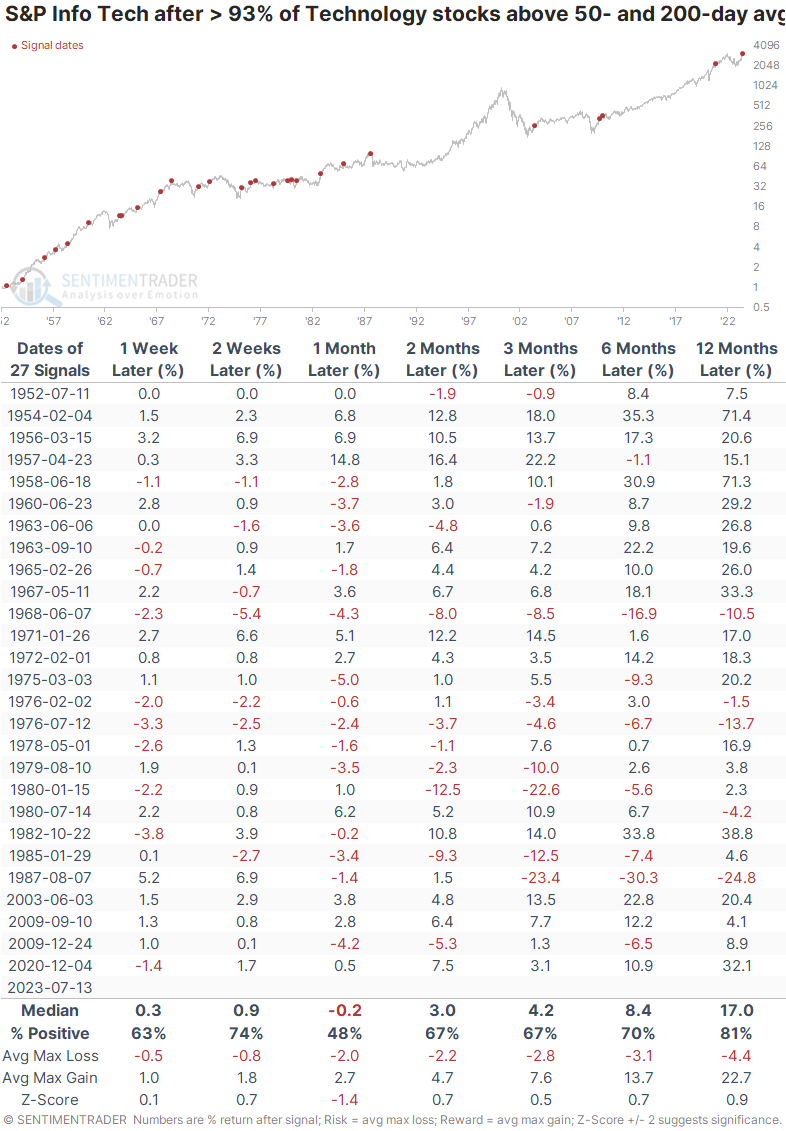
More than 93% of these stocks have climbed above their 50-day- and 200-day moving averages for the first time in years. The last time it occurred after a long dry stretch was in late 2020, as we emerged from the pandemic panic.

When this many Technology stocks climbed above both moving averages for the first time in at least three months, it preceded mostly positive returns across time frames, but nothing compelling. The last three signals showed that bear markets were over, even if those forward returns weren't inspiring.

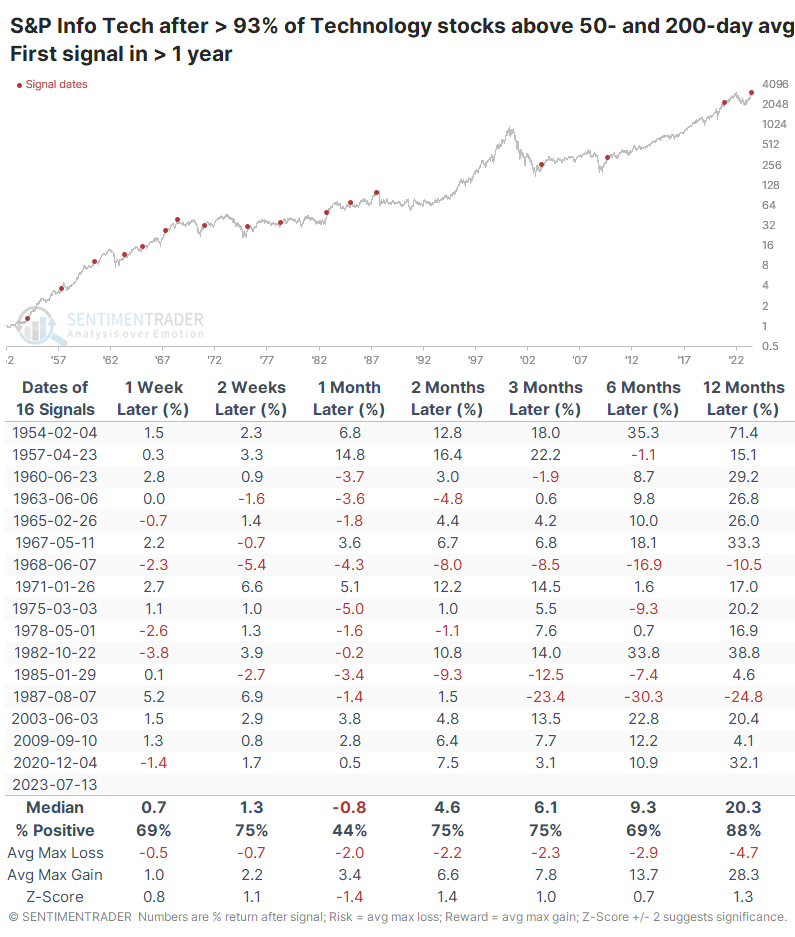
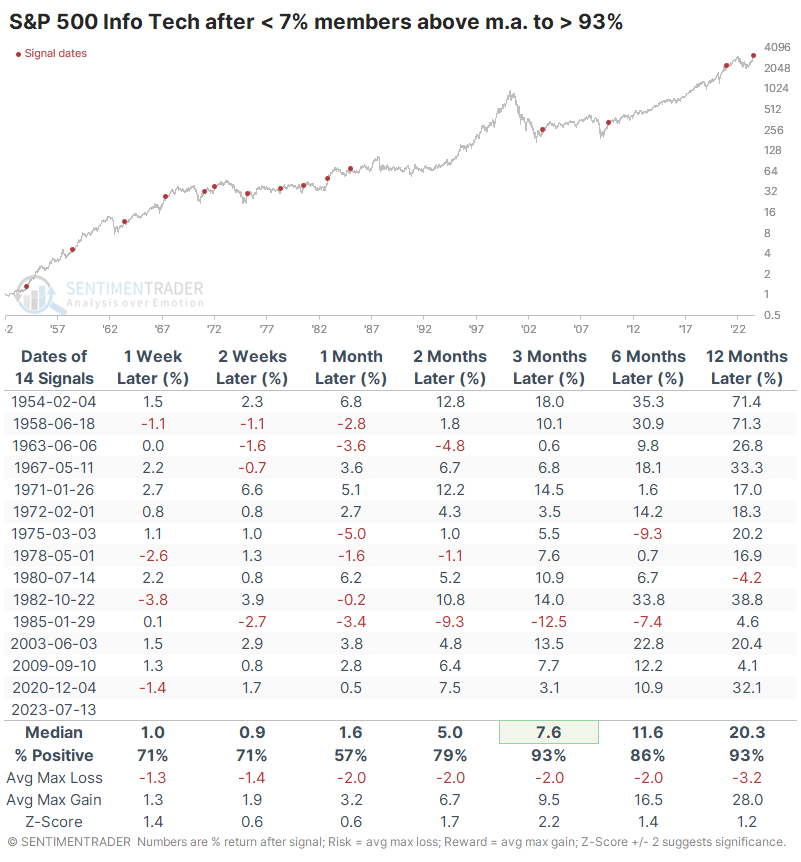
The current signal is more interesting because it has been so long since so many stocks were simultaneously in medium- and long-term uptrends. When we stretch the period between signals from three months to one year, future returns in the sector tend to improve. The following month was sketchy, with only a 44% win rate, but over the next year, the sector showed a median gain of 20.3% and a phenomenal risk/reward ratio.

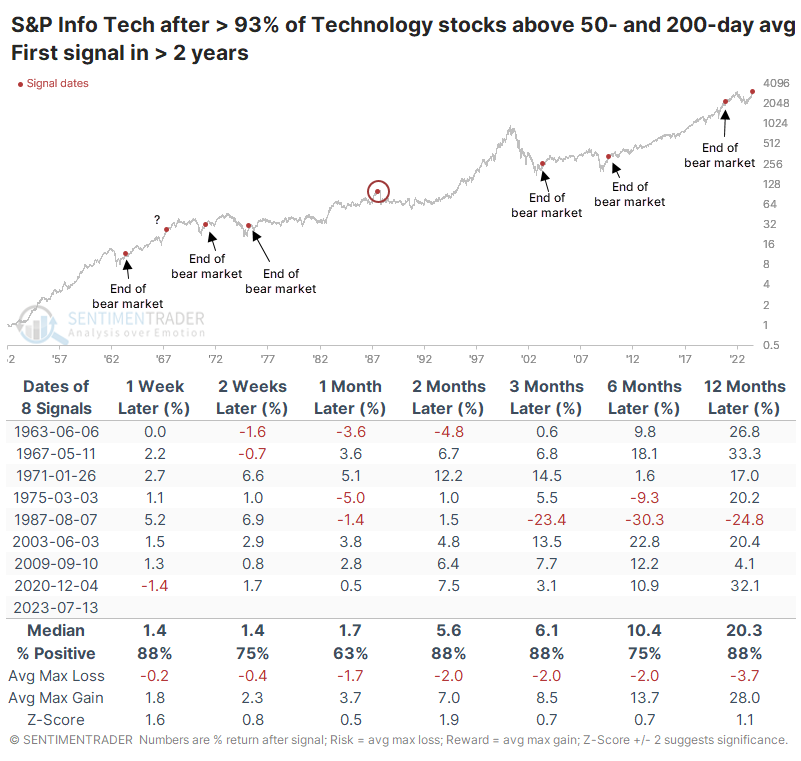
If we look at even more significant signals, those that were at least two years between instances, the win rate improves even more. There was only one that was indeed a false signal - in 1987, this triggered right before the Black Monday crash. But that was also one of the few signals that didn't occur after a prolonged bear market. The ones that did all led to excellent long-term gains.

A preferred way of looking at data like this is through cycles. More than 93% of Technology stocks are above their 50- and 200-day averages for the first time since fewer than 7% of the stocks were above those averages. Similar cycles preceded even better medium-term returns for the sector.

It was a fantastic sign for the broader S&P 500 index as well. Over the next three and twelve months, the index rose every time.

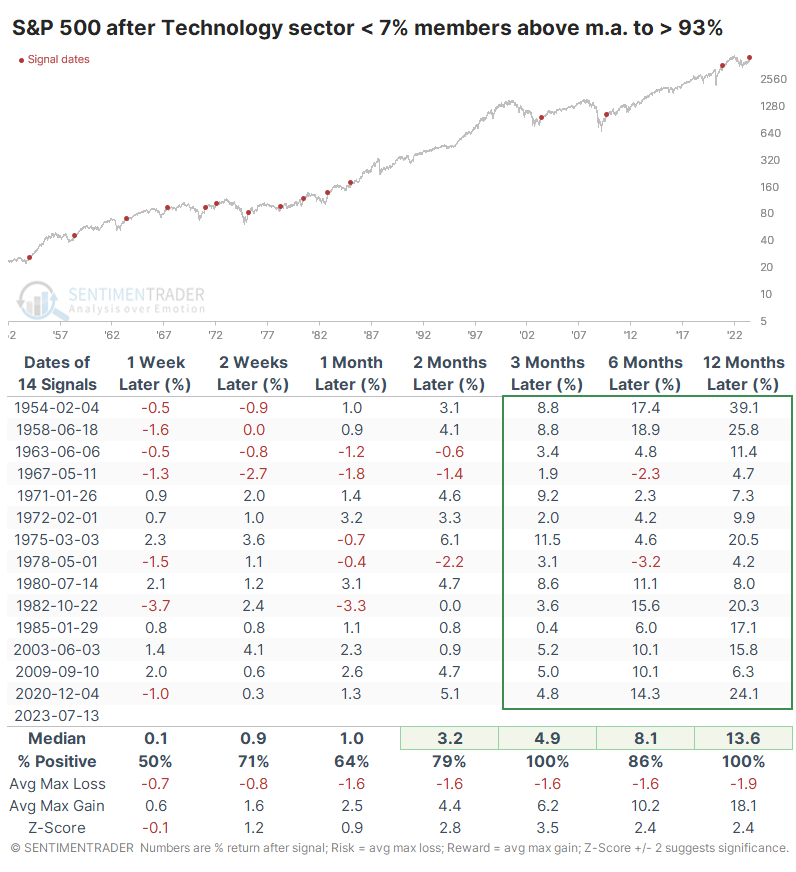
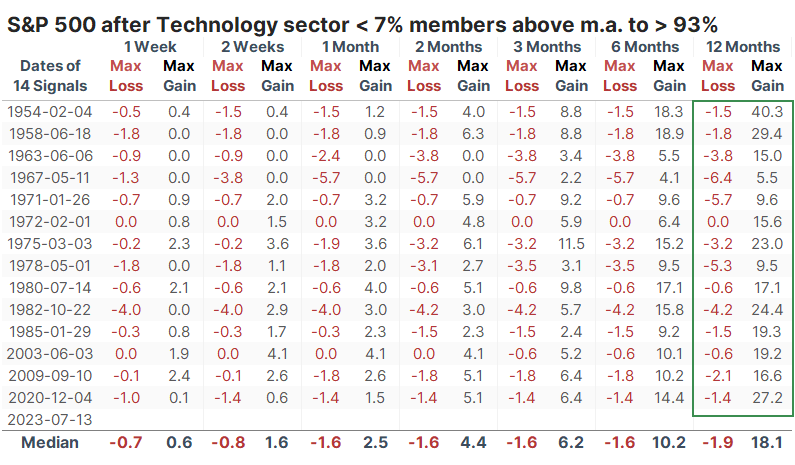
The most impressive aspect of these signals was the minimal drawdown over the next year. At no point within the following year did the S&P decline more than -6.4% across any of the signals.

What the research tells us...

It's always difficult for investors - especially those with a contrarian bent - to buy into a market that has rallied strongly and is at or near 52-week highs. We've seen with many studies in recent weeks, even months, that the type of internal momentum we've witnessed in the broader market and across sectors tends to continue. Even the excessive optimism we're seeing now isn't necessarily a bad sign since it's coming off a prolonged period of depression. The recovery of so many Technology stocks is further evidence that momentum this broad has a strong track record of continuing.

Sorry, you don't have access to this report

Upgrade your subscription plan to get access
Go to Dasboard
PRODUCTS
SentimenTrader
Trading Tools
Indicators & Data API
‍
Strategies & Scanner
‍
Research Reports
FREE
RESOUrCES
Simple Backtest
Calculator
Simple Seasonality
Calculator
The Kelly Criterion
Calculator
Sentiment Geo Map
‍
Public Research Reports
‍
Pricing
Bundle pricing
‍
Announcements
‍
FAQ
COMPANY
‍
About
‍
In the News
‍
Testimonials
‍
Client Success Stories
CONTACT
‍
General Inquiries
‍
Media Inquiries
‍
Financial Professionals Inquiries
‍
© 2025 Sundial Capital Research Inc. All rights reserved.
Setsail Marketing
TermsPrivacyAffiliate Program
Risk Disclosure: Futures and forex trading contains substantial risk and is not for every investor. An investor could potentially lose all or more than the initial investment. Risk capital is money that can be lost without jeopardizing ones’ financial security or life style. Only risk capital should be used for trading and only those with sufficient risk capital should consider trading. Past performance is not necessarily indicative of future results.

Hypothetical Performance Disclosure: Hypothetical performance results have many inherent limitations, some of which are described below. No representation is being made that any account will or is likely to achieve profits or losses similar to those shown; in fact, there are frequently sharp differences between hypothetical performance results and the actual results subsequently achieved by any particular trading program. One of the limitations of hypothetical performance results is that they are generally prepared with the benefit of hindsight. In addition, hypothetical trading does not involve financial risk, and no hypothetical trading record can completely account for the impact of financial risk of actual trading. for example, the ability to withstand losses or to adhere to a particular trading program in spite of trading losses are material points which can also adversely affect actual trading results. There are numerous other factors related to the markets in general or to the implementation of any specific trading program which cannot be fully accounted for in the preparation of hypothetical performance results and all which can adversely affect trading results.

Testimonial Disclosure: Testimonials appearing on this website may not be representative of other clients or customers and is not a guarantee of future performance or success.