
Almost a year and a half with nothing to show for it

Key points:
- Over a 600-day stretch, the S&P 500 gained more than 80% and then gave it (almost) all back
- Similar cycles showed a solid tendency to rebound over the next couple of months
- Over the long-term, these cycles triggered during the mid-point of bear markets three times
It's been 600 days, and all I got was this stupid T-shirt
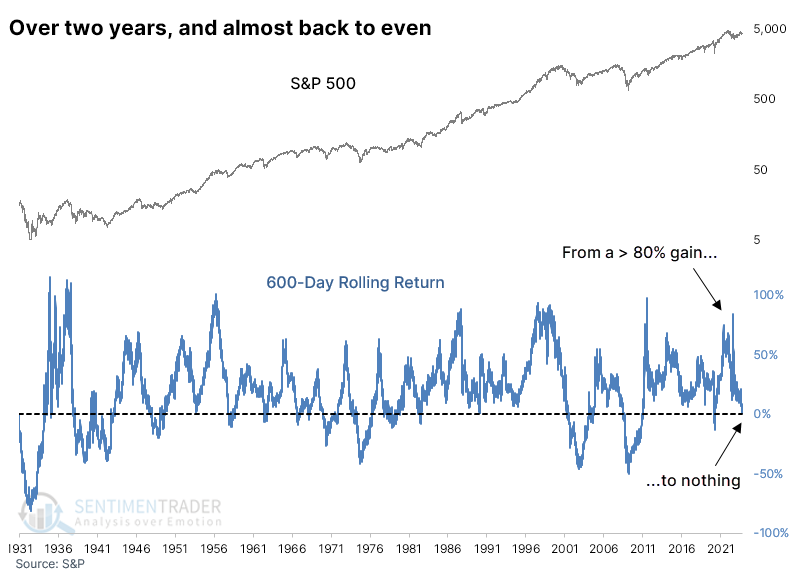
Investors have been through a lot over the past two-and-something years. The big run-up to the bear market peak pushed the S&P 500's return over the prior 600 sessions to more than 80%.
All that has been given back.
Before the most recent stabilization in stocks, the S&P's 600-day return had come almost all the way back to earth. Its 600-day rolling return eroded from nearly 85% to less than 1%.
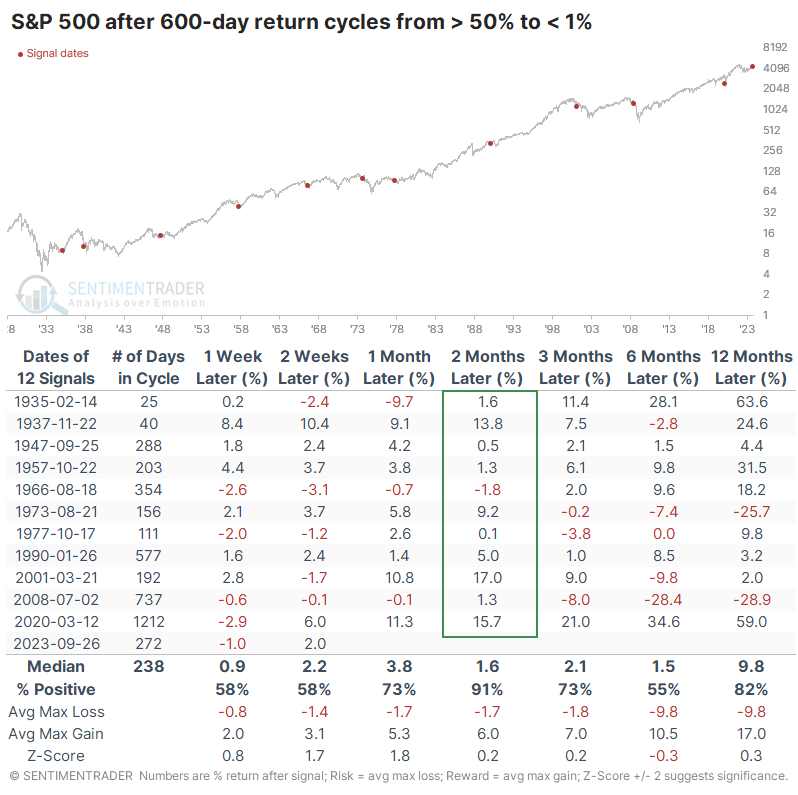
Giving back gains hurts. But, investors tended to show some reflexive buying after similar cycles. The table below shows every time since 1928 when the index's 600-day rolling return cycled from above 50% to less than 1%.
Surprisingly, if it did dip into negative territory, it didn't stay there for long, at least for a while. Over the following two months, the S&P rebounded after 11 of the 12 signals, with the sole loss being small and soon erased. That's the good news.
The bad news is that two of the last three signals were triggered about halfway through an ongoing bear market. That was the case in 1973-74 as well.
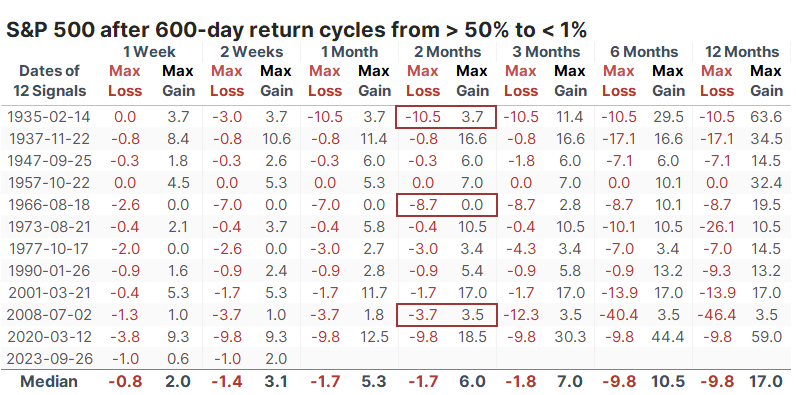
The table of maximum gains and losses across time frames shows that only 3 of the 12 signals suffered larger losses than enjoyed max gains over the next couple of months.
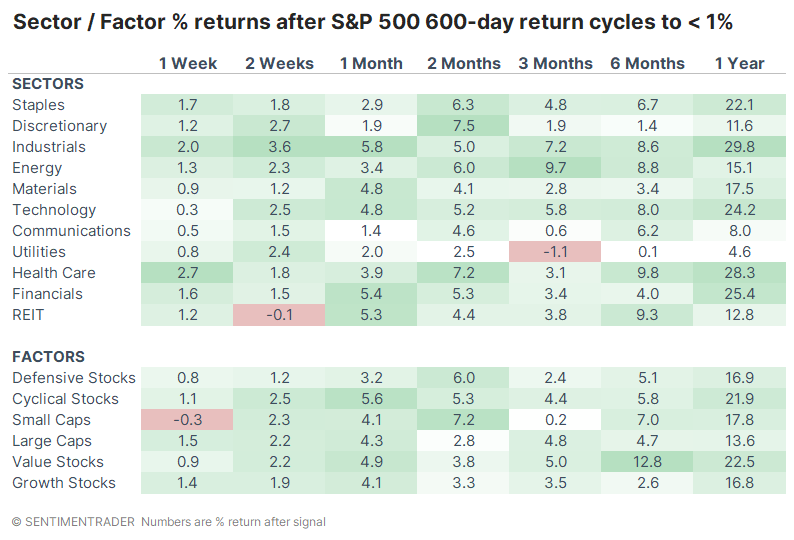
Defensive sectors like Staples and Health Care enjoyed some of the most consistent and robust positive returns after these cycles in the S&P. Financials, Energy, and Industrials also held up quite well, so it was an interesting hodge-podge.
Shameless plug intermission
Over the past 23 years and approximately ten million words written, I can't recall ever doing a shameless plug. I'm going to do one now.
My son recently graduated with a degree in Political Science and Psychology. During the four years, he was disappointed (and I was aghast) at the biases of his professors and teaching assistants and the news sources they demanded the students use.
He was also distraught by how uninformed his friends were, though they were all college students and now grads. If it didn't show up on TikTok's "for you" page, they didn't know about it. The entirety of their news consumption was 30-second soundbites from a foreign-owned social media app.
So, he did something about it.
He created a twice-weekly newsletter that aggregates what he feels are the most important news developments from recent days and presents them in an objective and balanced way. It' 's meant for a Gen Z/Millennial audience so they can speak at least somewhat intelligently when they're with co-workers or family, though I personally learn something new or interesting each time.
I'm proud of what he's creating, and would greatly appreciate it if you check out NextGen News Media, or especially if you're willing to forward it on to anyone in your circle that you feel might benefit from a digestible and trustworthy source of notable recent events.
It's completely free - he's trying to build an audience and will work out monetization later if possible. Thank you!
What the research tells us...
Whenever markets give back impressive gains, bears will suggest it's just the start. They'll pull out a quote from George Soros or Bob Farrell saying that if a market overshoots in one direction, it's likely to overshoot in the opposite direction. Supporting evidence for that pithy heuristic is scant.
If we look at about a year and a half of returns, with the S&P shooting higher during that period and then giving it all back, it tended to rebound rather than overshoot to the downside. While it did do that three times, most of the time, it did not. A year after the signals, the S&P 500 traded higher 10 out of 12 times, so we'd have to give more weight to the exceptions rather than the rule to consider it a negative for stocks.