
All eyes on the price of gas

Key points
- Unleaded Gas demonstrated a seasonal tendency to rise in price during late winter into spring
- 2024 is following the script - the trend is favorable, but price is somewhat overbought
- Unleaded gas futures are the purest play - but entail a great deal of dollar risk
- ETF ticker UGA offers non-futures traders the potential to participate in the fluctuations of the price of gasoline
Applying seasonality to real-world trading
Here are a few things to remember about seasonal trends:
- They are NOT a roadmap of what will happen going forward. They are merely an average of what has happened in the past
- There is no guarantee that a given market, index, stock, or commodity will act as a given seasonal trend suggests "the next time around"
As a result, Michael Santoli's adage that seasonality is "climate, not weather" is entirely valid. For these reasons, I rarely enter a trade based solely on the date on the calendar, i.e., solely on the basis of a seasonal trend.
The real key to using seasonal trends usefully is to:
- Use seasonal trends to tell you "When to look where and in which direction"
- Look for price confirmation before jumping in
In other words, look for the market to be doing what it is "supposed" to do, and don't follow a given seasonal trend unthinkingly.
"Price confirmation" can mean different things to different traders. But in the broadest stroke possible, the goal is to:
- Identify a typically reliable seasonal trend
- Look for the price to either a) be trending in the seasonally anticipated direction OR b) be highly overdone in the other direction, followed by a significant reversal.
In other words, if we identify a favorable seasonal trend, then we would look for:
- Price to already be trending higher (however one defines "trending higher") or to begin trending higher within the favorable seasonal window;
- OR, for the price to reach an extremely oversold level (again, however, one chooses to define "oversold") and then reverse higher
Conversely, if we identify an unfavorable seasonal trend, then we would look for:
- Price to already be trending lower (however one defines "trending lower") or to begin trending lower within the unfavorable seasonal window;
- OR, for the price to reach an extremely overbought level and then reverse lower
Unleaded Gas is in a favorable seasonal period
The chart below displays the annual seasonal trend for Unleaded Gas futures.
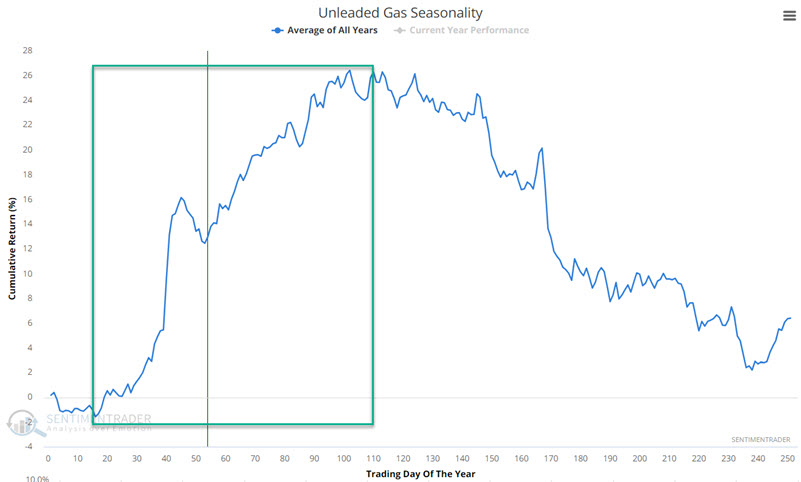
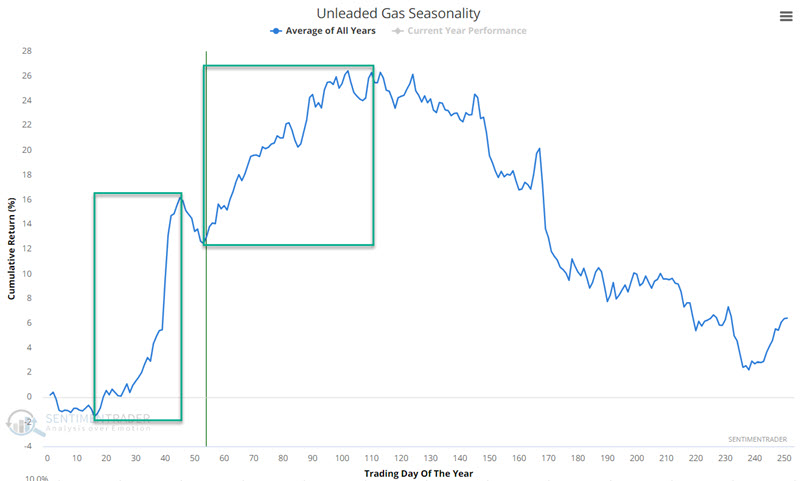
One trader might deem the period from Trading Day of the Year (TDY) #16 through TDY #110 shown in the chart above as "favorable." Another trade might split this into two favorable periods - one from TDY #16 through TDY #45 and then from TDY #53 through TDY #105. That is essentially what we did in this article dated 2024-01-23.
The bottom line is that unleaded Gas has historically tended to advance in price from late winter into spring. The problem, of course, is that there are no guarantees in any given year. Still, as we see in the chart below, unleaded Gas has been pretty cooperative so far. In the chart below, we note three things:
- Price has been trending higher
- Price action has been "confirmed" by holding above a rising 70-day EMA
- Unleaded Gas is presently somewhat "overbought" (based on a 4-day RSI reading above 80%)
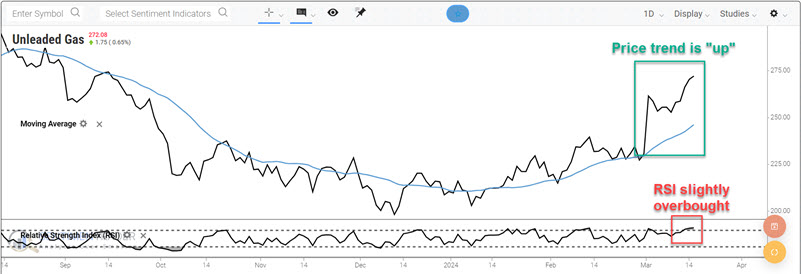
One more potential reason for pause is that unleaded Gas has already exceeded the "typical" performance for the first six months of the year according to the historical seasonal average.
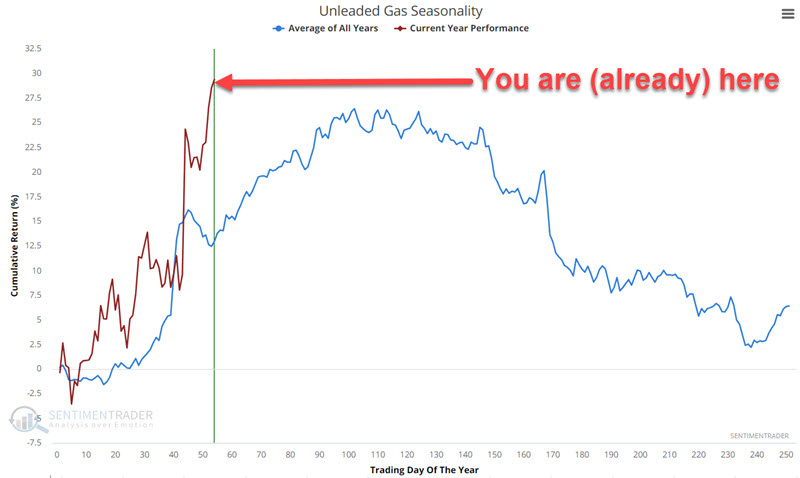
The current favorable seasonal period
As we saw in the annual seasonal trend charts above, the current "seasonally favorable period" extends to TDY #103 (2023-05-23). With the seasonal trend favorable and price action also favorable, the implication is that traders should continue to give the bullish case the benefit of the doubt. That said, a trader who has yet to jump in on the long side of unleaded Gas might consider waiting for the market to work off its present overbought RSI status before doing so.
The chart below displays the hypothetical cumulative gain from holding a long position in unleaded gas futures only during the TDY #53 through TDY #102 period every year since 2006.
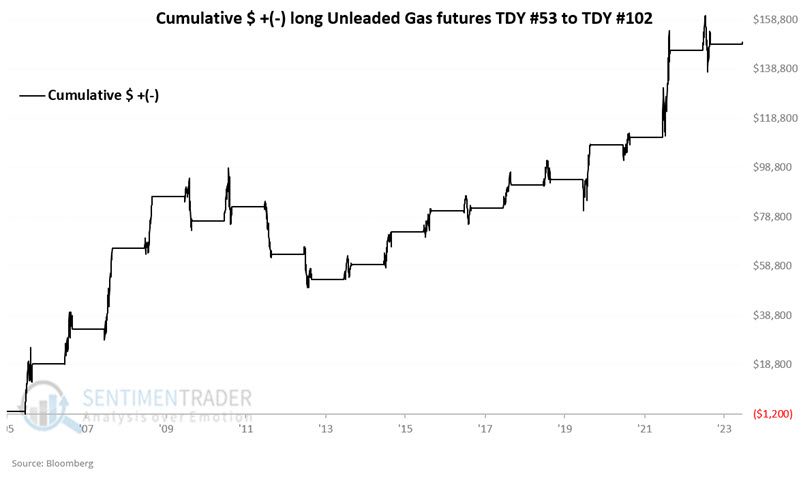
The table below summarizes unleaded gas performance results during this period.
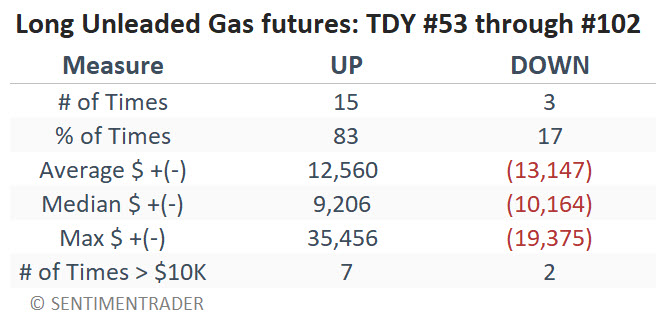
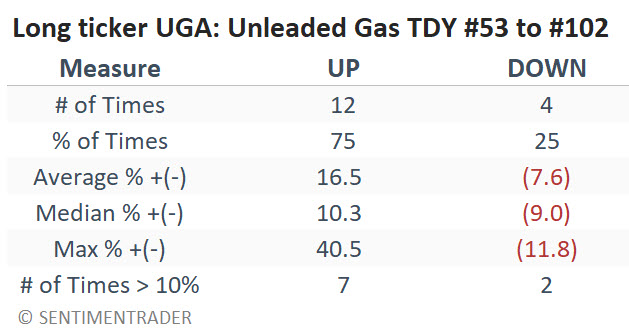
The good news is the high Win Rate and the fact that moves more than $10K in contract value skew 7 to 2 to the winning side. The bad news is that 2010, 2012, and 2013 saw significant losses (-$9,904, -$19,375 and -$10,164, respectively).
Unleaded gas futures trading is not for the faint of heart or the undercapitalized. Likewise, traders must also consider placing a stop-loss order in case things go south - and if and when to get back in if they do get stopped out, and then the trend resumes.
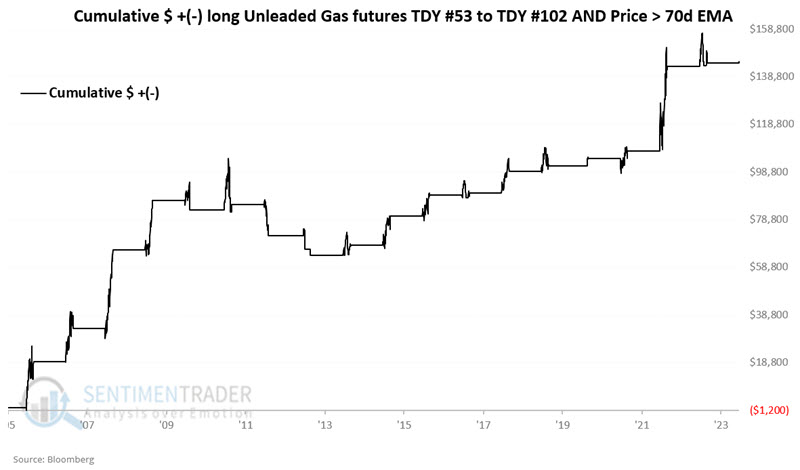
Filtering for trend
To highlight the potential importance of incorporating price trends into any seasonal drive trading, the chart below displays the hypothetical cumulative $ +(-) for a long position in unleaded gas futures only when a) TDY is between 53 and 102 and b) unleaded gas futures were trading above the 70-day EMA.
Conversely, the chart below displays the hypothetical cumulative $ +(-) for a long position in unleaded gas futures when a) TDY is between 53 and 102, and b) unleaded gas futures were trading below the 70-day EMA.
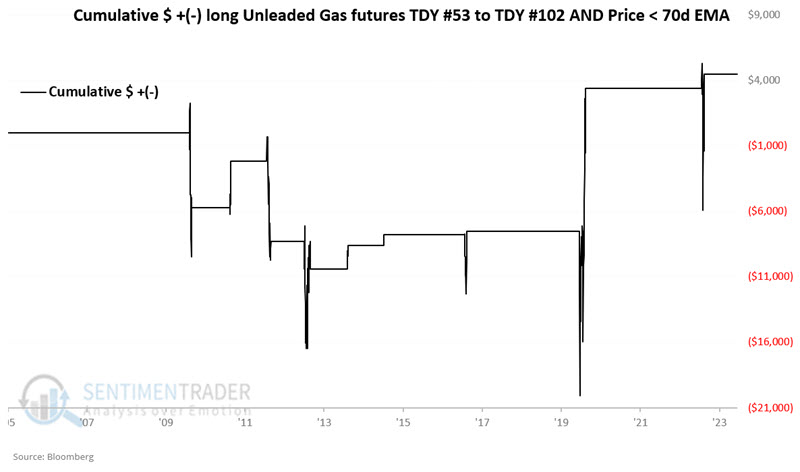
As the saying goes, the trend is your friend.
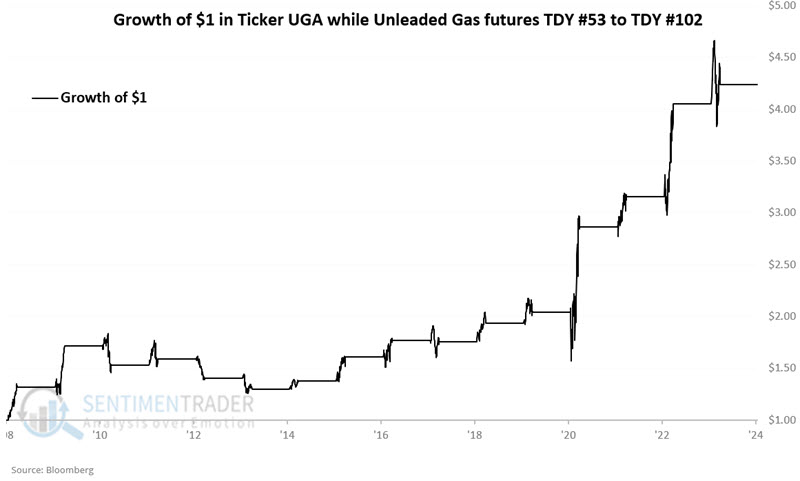
An ETF alternative for non-futures traders
The United States Gasoline Fund, LP (ticker UGA) is an ETF designed to track the price of gasoline futures. The Benchmark Futures Contract is the futures contract on gasoline as traded on the New York Mercantile Exchange that is the near-month contract to expire, except when the near-month contract is within two weeks of expiration, in which case it will be measured by the futures contract that is the next month contract to expire.
A trader who wants to gain exposure to the gasoline market but who does not want to trade unleaded gas futures can do so by buying shares of UGA just as they would buy shares of stock.
The chart below displays the hypothetical growth of $1 invested in UGA only during the TDY #53 through TDY #102 period for unleaded gas futures since UGA started trading in 2008.
The table below summarizes UGA's performance during this period.
What the research tells us…
Now is the time of year when unleaded gas prices would generally be expected to rise. A look at a price chart of unleaded Gas or ticker UGA suggests, "So far, so good." But has it been a little too good? With unleaded gas futures already with a larger-than-average gain and with unleaded gas futures and ticker UGA presently with 4-day RSI values in overbought territory, the potential for a short-term pullback appears elevated. That said, the combination of seasonal and price trends suggests that traders continue to look for opportunities to trade the long side of unleaded Gas.