Airlines - Mean Reversion

The Airline sub-industry group has now traded below its 10-day moving average for 32 consecutive days. If you recall, I published a note on 7/2/21 calling into question the re-opening trade as the airlines had traded below their 10-day average for 21 consecutive days. While the study suggested that the group could mean revert higher based on the 1-month timeframe, the longer-dated results looked unfavorable. The airlines have now gone from bad to worse.
Let's conduct a study to assess the forward return outlook for airlines when they have traded below their 10-day average for 32 consecutive days.
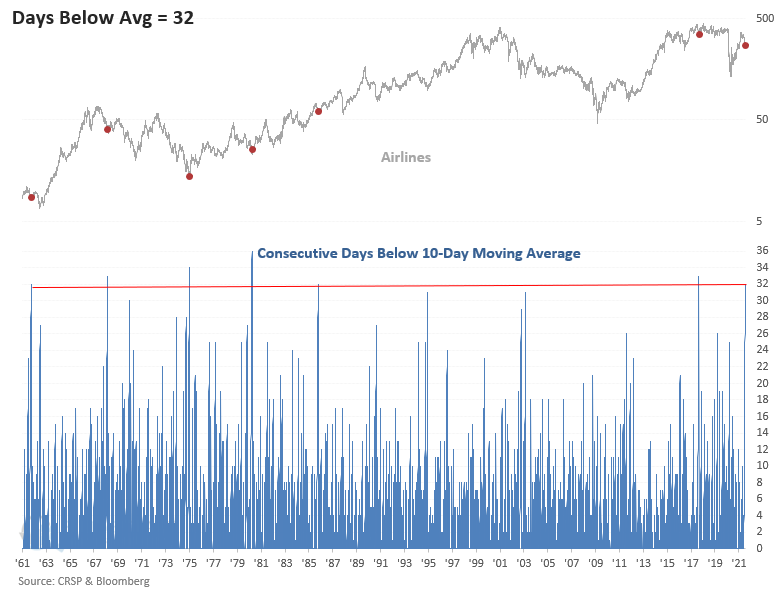
HISTORICAL CHART
As the chart shows, for only the 7th time in history, the consecutive days below the moving average count reached a level of 32. If you were wondering, the highest reading in history occurred in March 1980, when the count hit 37 days.
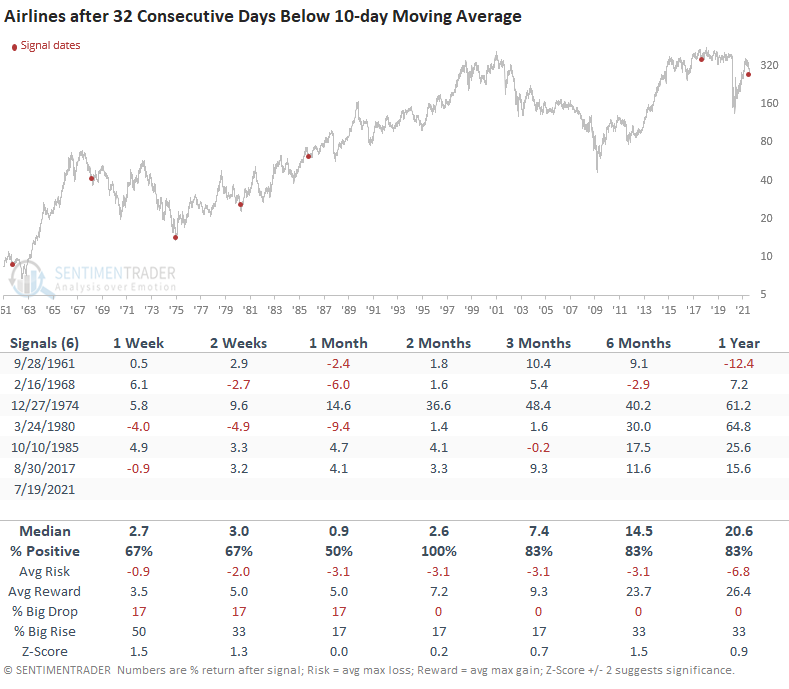
HOW THE SIGNALS PERFORMED
While the sample size is small, the results look favorable across almost all timeframes.
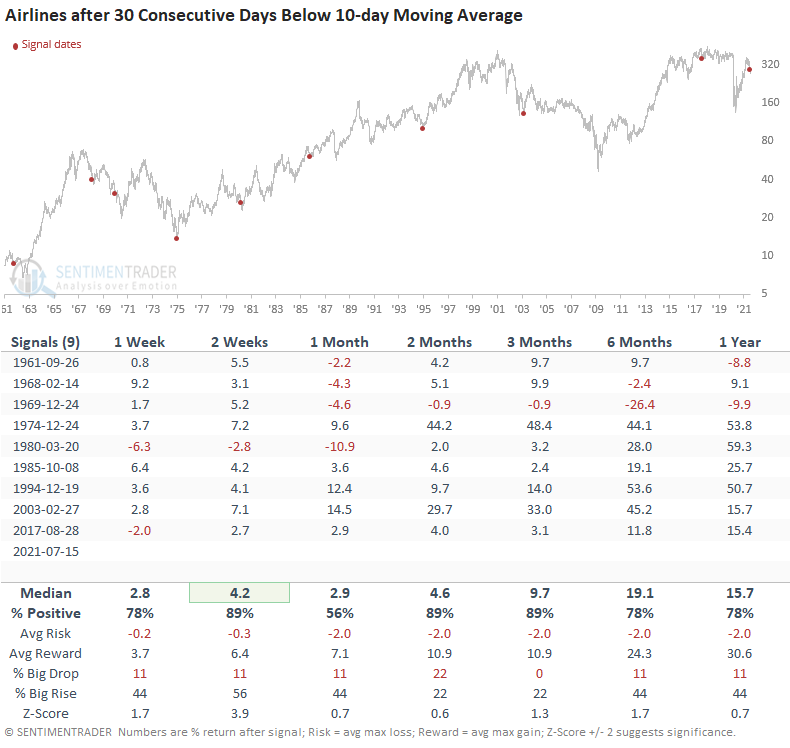
Let's relax the count to 30 days so we can examine a few more instances.
HOW THE SIGNALS PERFORMED
By relaxing the count to 30 days, we pick up three more signals, and the results look better.