Products
SentimenTrader Trading Tools
‍
Backtest Engine
My Trading Toolkit
Correlation Analysis
Seasonality
Indicators & Data API
‍
Proprietary Indicators & Charts
Market Data API
Strategies & Scanner
‍
50+ Trading Strategies
Smart Stock Scanner
Research Reports
‍
Research Solutions
Reports Library
Free Resources
Simple Backtest Calculator
Simple Seasonality Calculator
The Kelly Criterion Calculator
Sentiment Geo Map
Public Research Reports
Pricing
Company
About
In the News
Testimonials
Client Success Stories
Contact
Log inLoginSign up
< BACK TO ALL REPORTS

After These Signals, Gold Usually Couldn't Hold

Jason Goepfert
2021-05-19
For the first time in more than 3 months, gold has crossed above its 200-day moving average.

For the first time in months, gold is back in an uptrend.

Using intraday prices, gold finally punched above its 200-day average for the first time since the start of February. That ends the longest stretch below the 200-day since late 2018. After it regained its average then, it rallied for another couple of months before giving almost all of those gains back, and then finally managed to roar ahead.

The several months below its 200-day wasn't gold's longest stretch in a downtrend by any means, but it was one of the longer trends in the past 20 years. 

Gold crosses above 200 day average

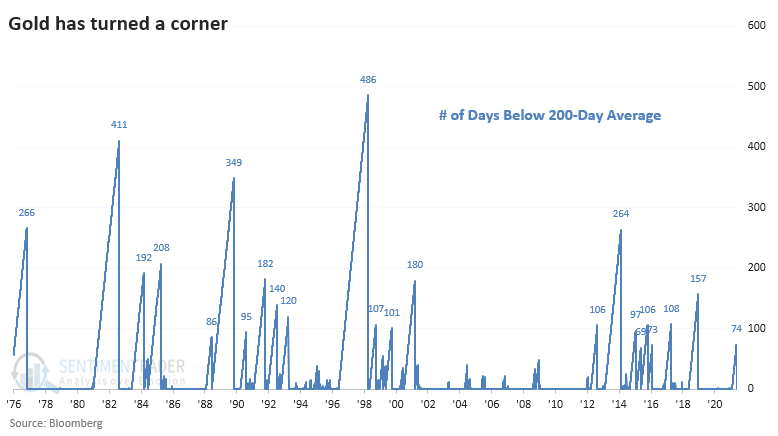
We've seen before that gold has a tendency to be trendy, and attempted reversals in long-term trends aren't very sticky. Medium-term returns weren't kind after the 22 other times gold attempted this kind of trend change.

Over the next 6 months, gold showed a positive return only 32% of the time, and all the other stats were poor. Gold mining stocks also had a tendency to see more selling than buying pressure.

Stat Box

For only the 3rd time since its 2003 inception, on Tuesday, the EEM emerging markets fund gained more than 1.25% on a day when the S&P 500 fund, SPY, lost more than 0.75%. Of the 9 times that EEM showed twice as large of a gain as SPY showed a loss, EEM outperformed SPY over the next 2 months 78% of the time.


What else we're looking at

  • Full details on gold's future returns after crosses above its 200-day average
  • A detailed look at returns on gold mining stocks, too, back to 1975
  • What happens after the Growth / Value ratio shows a massive deviation from trend
  • Based on trends, when to favor Growth or Value
  • A rules-based system for switching between commodities and stocks
PRODUCTS
SentimenTrader
Trading Tools
Indicators & Data API
‍
Strategies & Scanner
‍
Research Reports
FREE
RESOUrCES
Simple Backtest
Calculator
Simple Seasonality
Calculator
The Kelly Criterion
Calculator
Sentiment Geo Map
‍
Public Research Reports
‍
Pricing
Bundle pricing
‍
Announcements
‍
FAQ
COMPANY
‍
About
‍
In the News
‍
Testimonials
‍
Client Success Stories
CONTACT
‍
General Inquiries
‍
Media Inquiries
‍
Financial Professionals Inquiries
‍
© 2025 Sundial Capital Research Inc. All rights reserved.
Setsail Marketing
TermsPrivacyAffiliate Program
Risk Disclosure: Futures and forex trading contains substantial risk and is not for every investor. An investor could potentially lose all or more than the initial investment. Risk capital is money that can be lost without jeopardizing ones’ financial security or life style. Only risk capital should be used for trading and only those with sufficient risk capital should consider trading. Past performance is not necessarily indicative of future results.

Hypothetical Performance Disclosure: Hypothetical performance results have many inherent limitations, some of which are described below. No representation is being made that any account will or is likely to achieve profits or losses similar to those shown; in fact, there are frequently sharp differences between hypothetical performance results and the actual results subsequently achieved by any particular trading program. One of the limitations of hypothetical performance results is that they are generally prepared with the benefit of hindsight. In addition, hypothetical trading does not involve financial risk, and no hypothetical trading record can completely account for the impact of financial risk of actual trading. for example, the ability to withstand losses or to adhere to a particular trading program in spite of trading losses are material points which can also adversely affect actual trading results. There are numerous other factors related to the markets in general or to the implementation of any specific trading program which cannot be fully accounted for in the preparation of hypothetical performance results and all which can adversely affect trading results.

Testimonial Disclosure: Testimonials appearing on this website may not be representative of other clients or customers and is not a guarantee of future performance or success.