
After the first five days are up - what then?

Key points
- The S&P 500 closed higher over the first five trading days of 2025
- Historically, the stock market has tended to perform better - and much more consistently - when the first five trading days of the year show a gain of any size
- Investors should remember that this is a weight of the evidence indicator and not a trading strategy
Defining the period and the data
The "First Five Trading Days of the Year" as a market bellwether was developed and popularized by the late great Yale Hirsch, Founder of The Stock Traders Almanac. The theory is simple: The potential for gains through the rest of the calendar year is greater if the S&P 500 shows a net gain over the first five trading days of the new year than if it shows a loss.
On the face of it, one can make a pretty good case for dismissing this theory out of hand. "What do the first five days of the year have to do with May, August, or December?" is a reasonable question.
Still, as with most things related to the stock market, analyzing the data can be helpful rather than drawing subjective conclusions.
The methodology used here
While we don't necessarily recommend using the first five days as an automatic trading system, we will treat them as such for the purpose of the following test. One of our goals in this approach is to avoid buying and holding the S&P 500 for just the first five trading days of any year.
The test that follows uses the following rules (which are likely just slightly different than Yale Hirsch's original version):
- If the first five trading days of the year show a gain for the S&P 500 Index, we will buy and hold the index through the first five trading days of the following year
- If the first five trading days of the year show a loss for the S&P 500 Index, we will hold no position in the index through the first five trading days of the following year
Practical effect:
If we buy the index after a "first five days up" signal, we will hold it at least through the first five days of the following year. If the following year's first five days show a gain, we will continue to hold the long position in the index (i.e., we do not sell at the end of the current year and then get back in if signaled five trading days later).
Suppose the first five days are down, and we go flat (for the remainder of the current year). In that case, we will stay out during the first five trading days of the following year and wait to see if we get a new buy signal then (rather than buying at the close of the current year and then having to sell that position trading days later if the first five days show a loss).
The +0.62%% gain for the S&P 500 over the first five trading days of 2025 triggered a buy signal at the close on 2025-01-08. The signal will remain in effect through the first five trading days of 2026 (through 2026-01-08).
The results following "Up" first five days
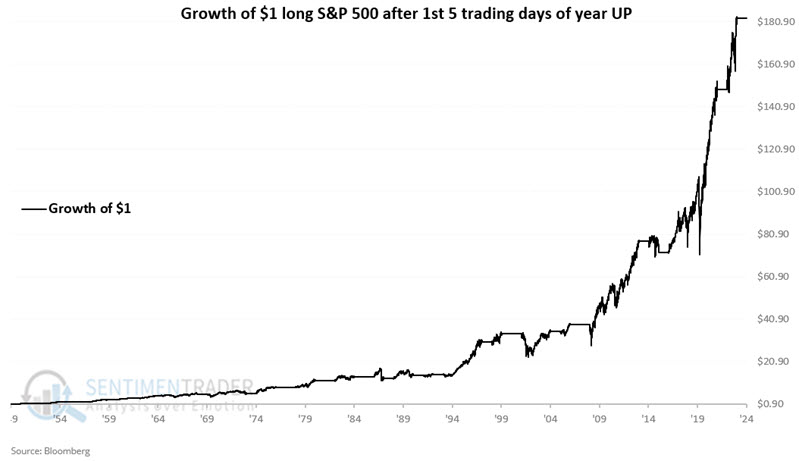
The chart below displays the hypothetical growth of $1 invested in the S&P 500 only during favorable periods using the rules defined above.
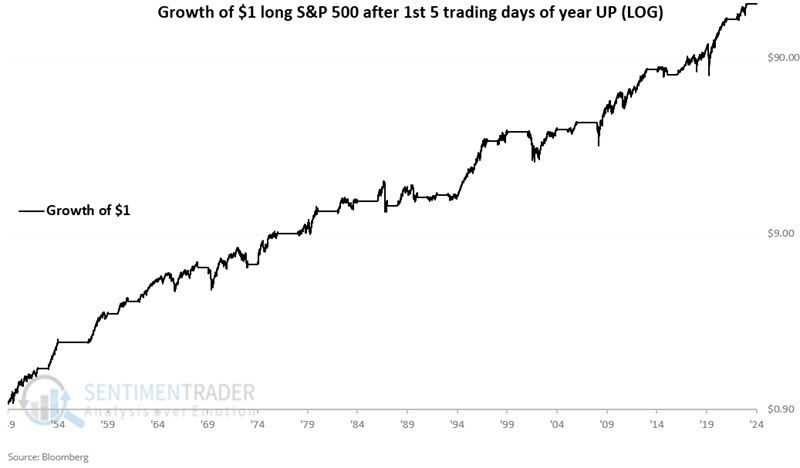
The chart below displays the same results on a logarithmic scale.
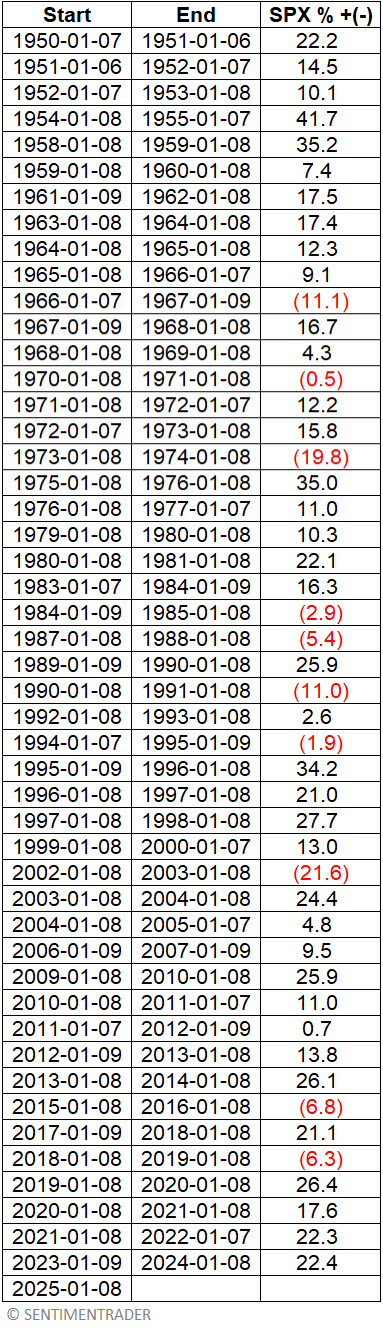
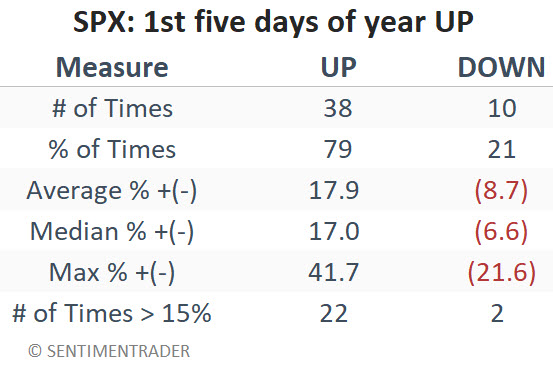
The table displays S&P 500 returns during favorable periods.
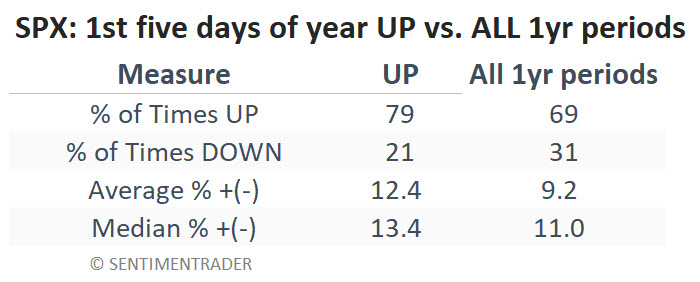
The table below summarizes S&P 500 performance during favorable periods versus performance for all one-year periods.
The table below further breaks down performance during favorable periods (i.e., following a First Five Days UP signal).
Things to note include:
- 79% Win Rate (average for all 12-month periods since 1949 = 68%)
- The 2.60 ratio of median gains during winning periods divided by median losses during losing periods (+17.0% vs. -6.6%)
- 22 gains of +15% or more, only two losses of -15% or more
The results following "Down" in the first five days
It is important to note that an unfavorable first five days of the year has not tended to be bearish for stocks but rather much less bullish than if the first five days show a gain.
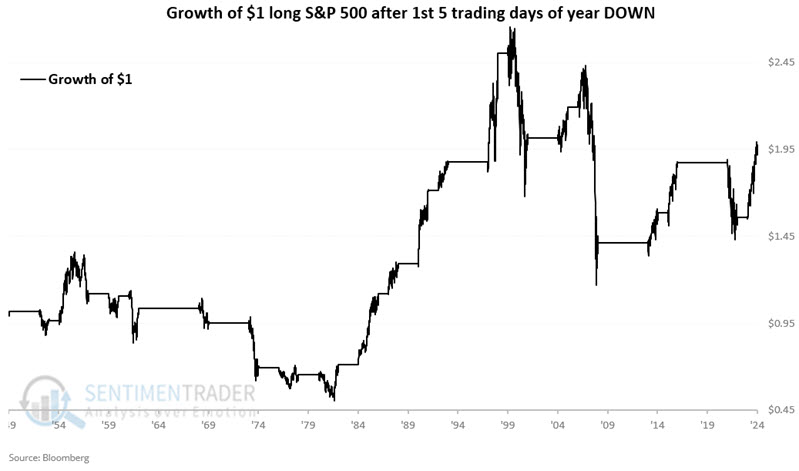
The chart below displays the hypothetical growth of $1 invested in the S&P 500 only during unfavorable periods using the rules above.
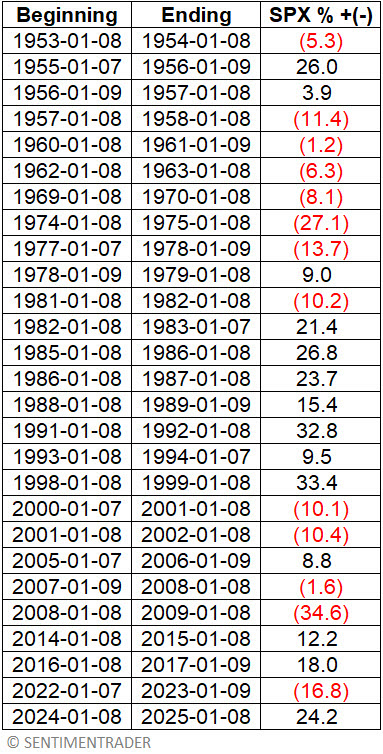
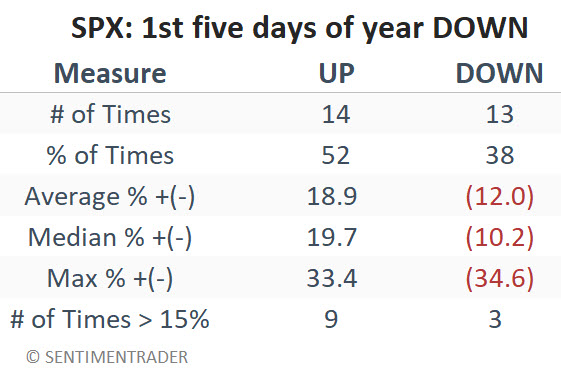
The table displays S&P 500 returns during unfavorable periods.
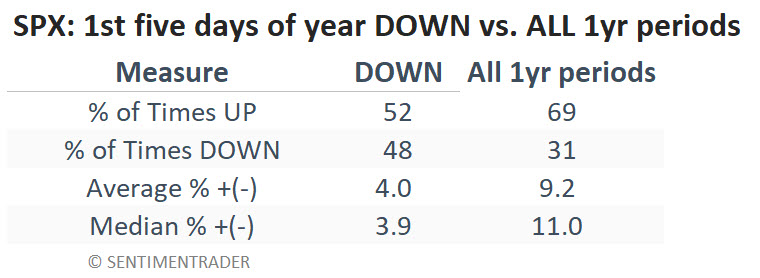
The table below summarizes S&P 500 performance during unfavorable periods.
The table below compares performance during winning periods (following a signal) to performance during losing periods.
A final comparison
The table below summarizes S&P 500 performance during the "Favorable," "Unfavorable," and "All" Periods.
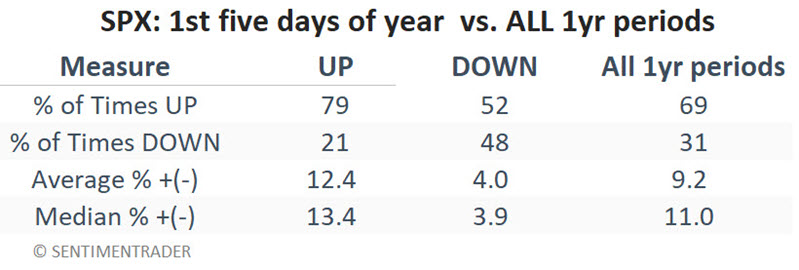
The table above shows a strong tendency for the stock market to perform better after a "First Five Days Up" signal.
- 79% Win Rate (52% following unfavorable first five days and 69% for all 12-month periods since 1949)
- 12.4% average gain (4.0% following unfavorable first five days and 9.2% for all 12-month periods since 1949)
- 13.4% median gain (3.9% following unfavorable first five days and 11.0% for all 12-month periods since 1949)
What the research tells us…
The S&P 500 gained a meager +0.62% over the first five trading days of 2025. So does this mean that "happy days are here again?" It would seem unwise to base one's investment strategy for the entire year solely on the performance over any five days. That said, the numbers over the last seven decades strongly suggest giving the bullish case every benefit of the doubt over the calendar year if the S&P 500 index shows a net gain over the first five trading days of the year.