
Additional Indicators Related to the NASDAQ Composite Index

Key Points
- The McClellan Summation Index has fallen below -500
- The 6-month rank of the 20-day moving average of the NASDAQ TICK indicator has plummeted from 100 to 0
- The 10-day moving average of the HiLo Logic Index has broken above 3
Observations on Market Structure
As of early February 2026, while the NASDAQ Composite Index remains in a relatively high range at the price level, an in-depth look at the internal market indicator data reveals that the market structure is undergoing significant changes. As observed on Tuesday, in addition to that, several other indicators are at unusual levels. This is not an accidental fluctuation of a single indicator; the number of stocks declining overall is also increasing, which deserves investors' close attention in the current environment.
McClellan Summation Index
The McClellan Summation Index, a gauge of the market's long-term breadth momentum, reflects the cumulative momentum of the number of advancing/declining stocks in the market based on the latest chart data. This indicator has recently moved down below -500, with the current reading dropping to -603.0.
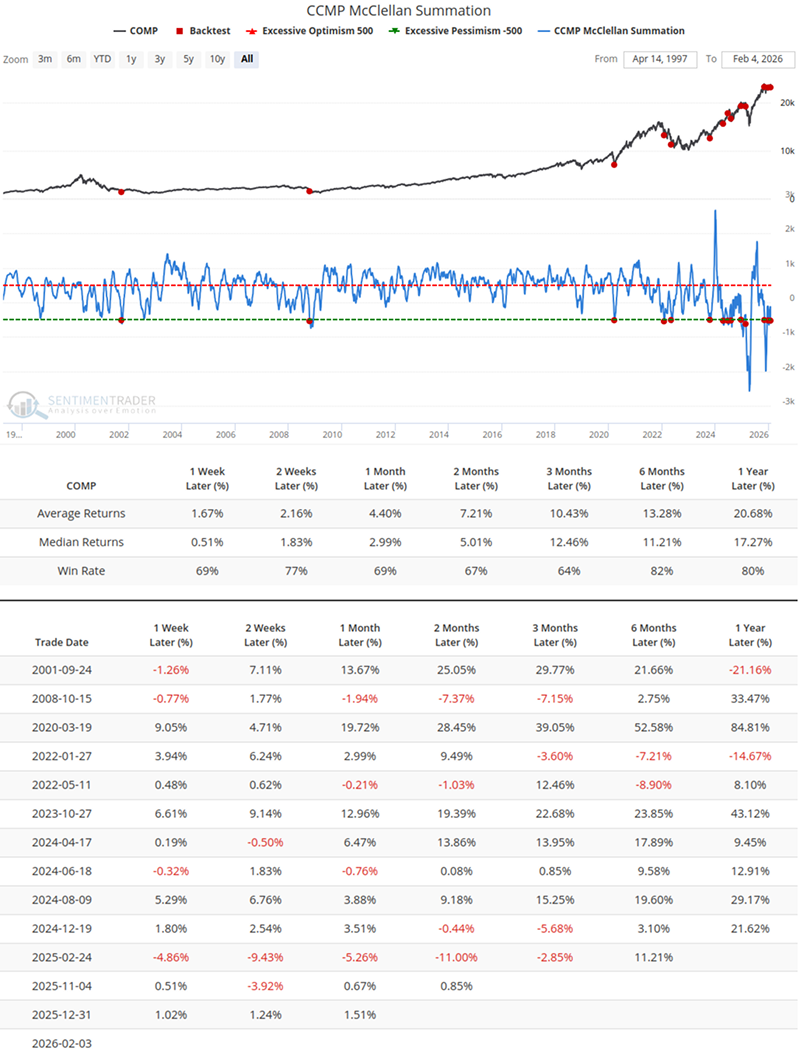
From a historical backtesting perspective, reaching such levels can be regarded as an oversold condition. While this is positive for the long term, short-term volatility may still ensue.
NASDAQ TICK Conditions
The 6-month rank of the 20-day moving average of the NASDAQ TICK indicator has dropped directly from 100 to 0 within 42 days.
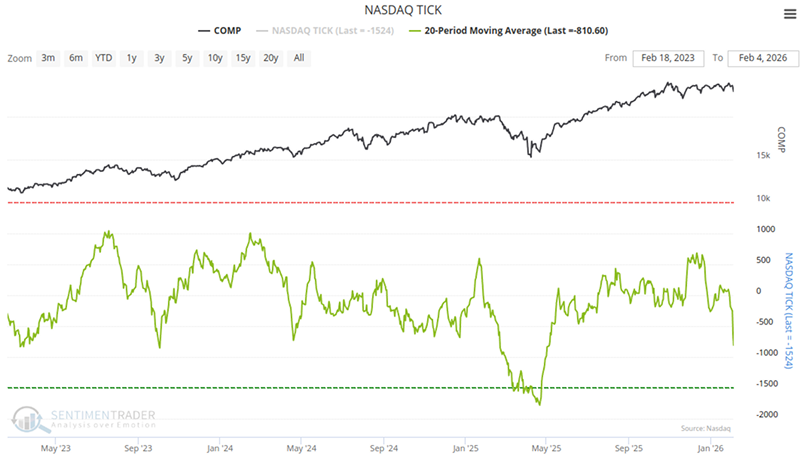
Historical data provides context for understanding such extreme fluctuations.Related Backtest Click Here.
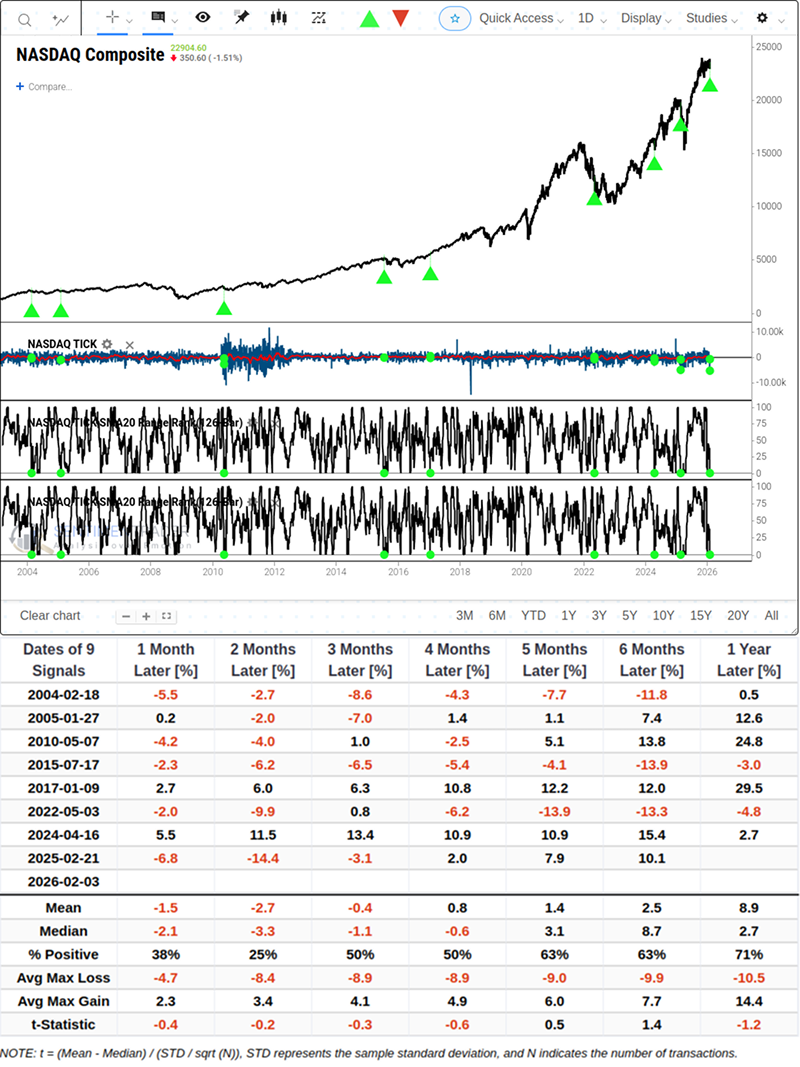
After similar signal triggers in the past, the market has rarely seen an immediate V-shaped reversal. Statistics show that the median returns of the NASDAQ Index were negative at 1 month and 2 months following such a violent release of sentiment, at -2.1% and -3.3% respectively, indicating short-term risks.
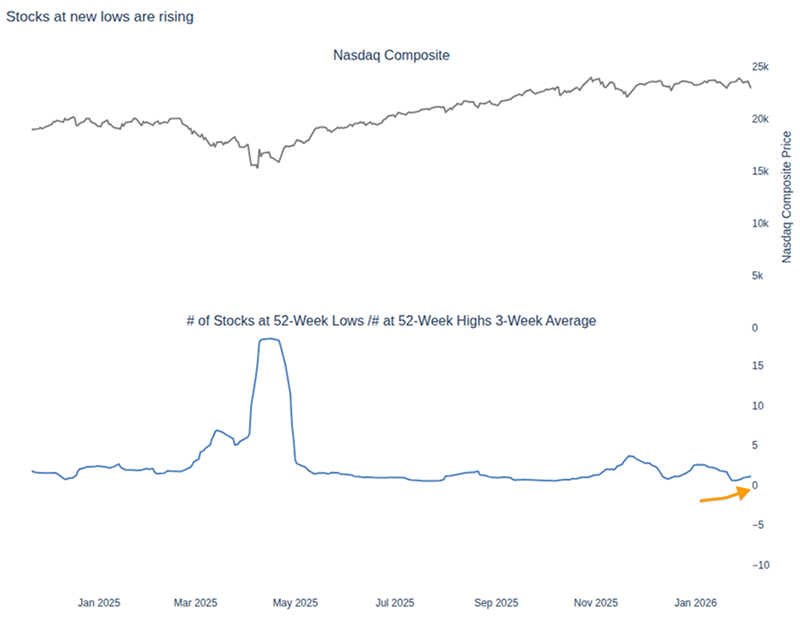
Rapid Breakout of the NASDAQ HiLo Logic Index
The third noteworthy phenomenon comes from the NASDAQ HiLo Logic Index. The 10-day simple moving average of this indicator has recently broken above the 3.0 threshold. This indicator is designed to identify contradictory states within the market-i.e., when a large number of stocks hit new highs while a large number of others hit new lows simultaneously.
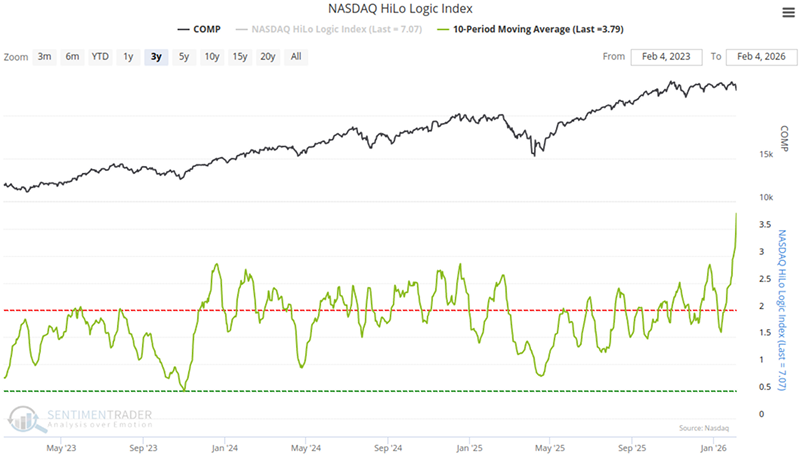
The elevated level of the indicator suggests that the market is currently in a "schizophrenic" state. Such divergence signals have historically emerged during periods of turbulent market conditions, such as the end of 1999 or late 2021.Related Backtest Click Here.
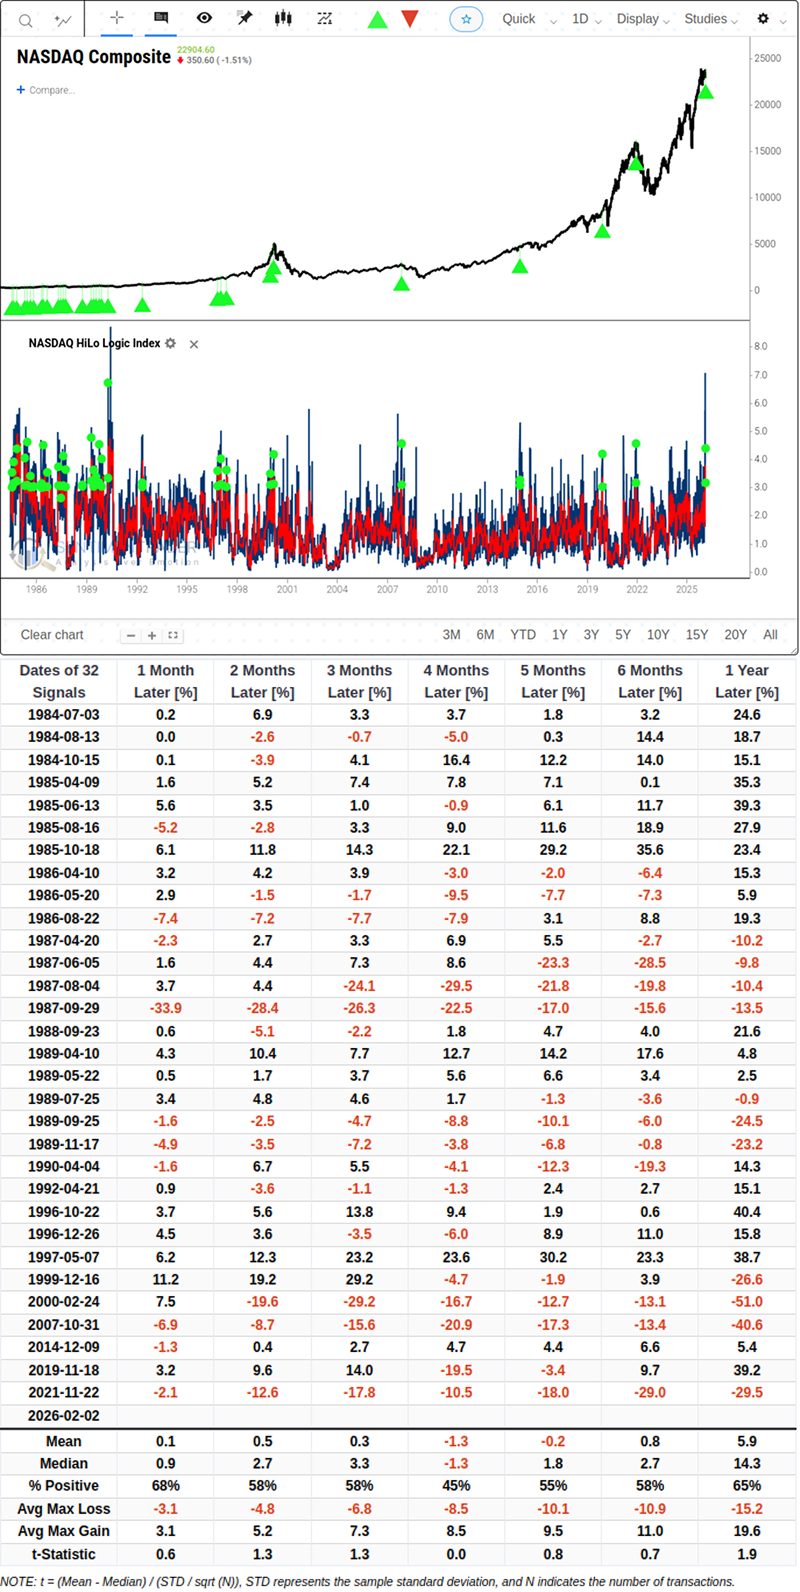
Backtest data shows that the median return of the NASDAQ Index was negative after 4 months. Although the index may not have fallen sharply yet, the extreme divergence among individual stocks within it means that capital is undergoing drastic position adjustments and stock rotations. Such a market environment lacking consistency is usually not conducive to the smooth continuation of trends.
What the Research Tells Us
Combining the signals from the above three dimensions, the market conditions we are currently observing show distinct characteristics of a transitional period. However, we also need to note that while short-term data leans defensive, some long-cycle backtests (such as the 1-year period) still show positive returns. This suggests that the current adjustment may be more of a correction for the overheated sentiment and structural divergence in the earlier period, rather than necessarily pointing to long-term systemic risks.
Based on historical statistical patterns, the current market environment is probabilistically more inclined to range-bound consolidation or inertial downside probing, rather than an immediate start of a one-sided upward trend. For market participants, these signals are not absolute exit orders, but a reminder to prioritize risk management. Until breadth indicators turn upward again or divergence indices fall back to low levels, maintaining objective and patient observation may be a rational choice to cope with the current market uncertainty.