
Absolute & Relative Trend Update

The goal of today's note is to provide you with some insight into what I am seeing with my absolute and relative trend following indicators for domestic and international ETFs.
Data as of 5/14/21 close. All relative comparisons are versus the S&P 500 ETF (SPY). For absolute and relative indicator definitions, please scroll down to the end of the note.
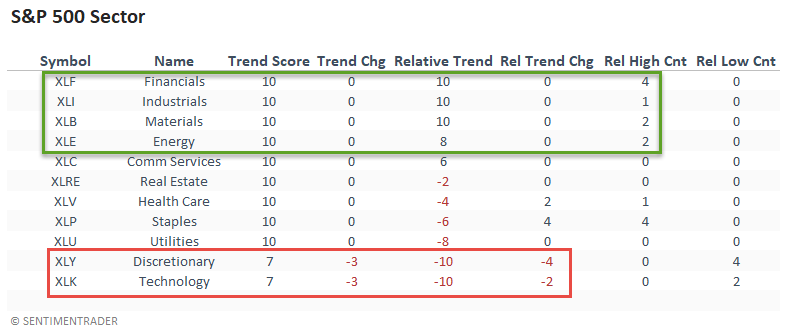
ABSOLUTE & RELATIVE TRENDS - SECTOR ETFS
The relative trend backdrop continues to favor value/cyclical groups. Financials had a solid weak with the sector registering a new relative high on 4/5 days. For the first time since 2016, the relative trend score for technology and discretionary groups simultaneously registered a reading of -10.
ABSOLUTE & RELATIVE TRENDS - EQUAL-WEIGHT AND INDUSTRIES
The equal-weighted relative trend score for technology continues to deteriorate, and the group registered a new relative low on 3/5 days. Discretionary stocks saw a slight downtick, with the trend score declining by as much as four points at one point during the week.
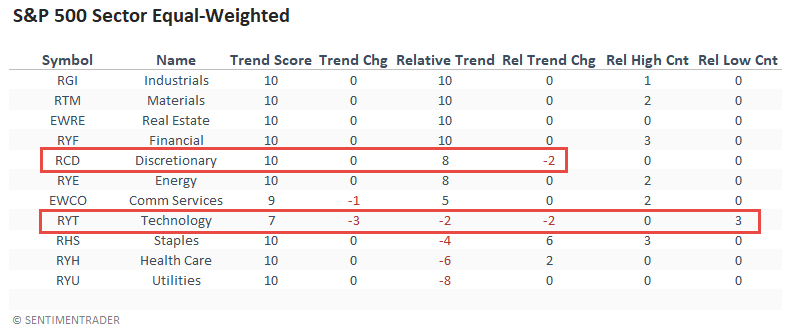
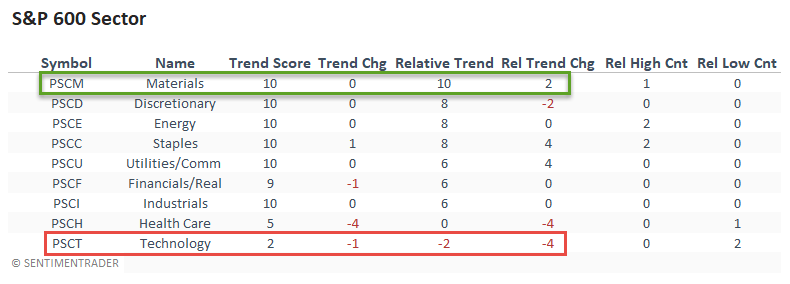
With the jump in the relative trend score this week, the small-cap basic materials sector now joins the equal and cap-weighted methods in the large-cap arena with a perfect score.
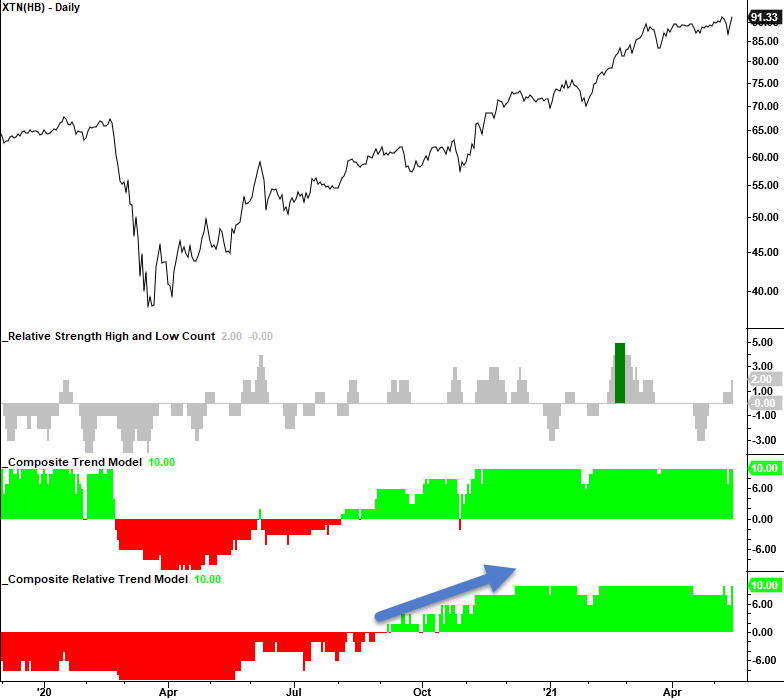
The transportation industry joined the other value/cyclical groups with a perfect relative trend score. Semiconductors and health care equipment showed a noticeable decline.
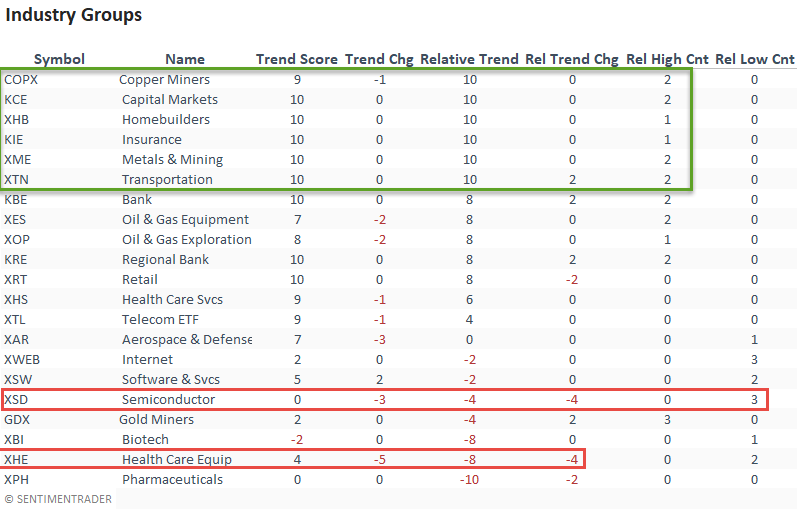
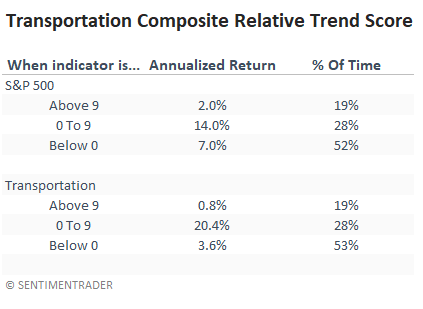
CHART IN FOCUS - TRANSPORTATION
Given the jump in the relative trend score for the transportation industry, let's assess the potential outcome for the industry and the broad market.
In theory, one would think that a solid relative trend score for transportation stocks would be bullish. However, the table shows that annualized returns since 1928 fall by a substantial amount once the group achieves a high level. The sweet spot for the group and the broad market occurs when the score increases from 0 to 9.
ABSOLUTE & RELATIVE TRENDS - THEMATIC ETFS
While the thematic growth ETFs continued to deteriorate on an absolute and relative basis, I would note that the decline was not as bad as the previous week. Even with the jump in prices on Friday, I see no signs of a base-building process.
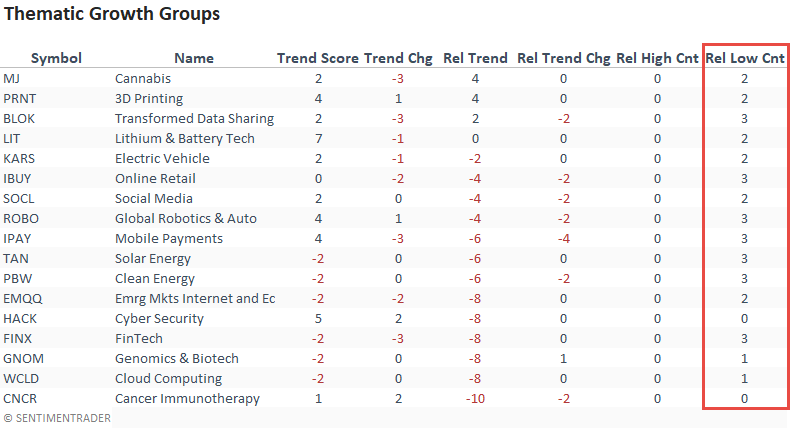
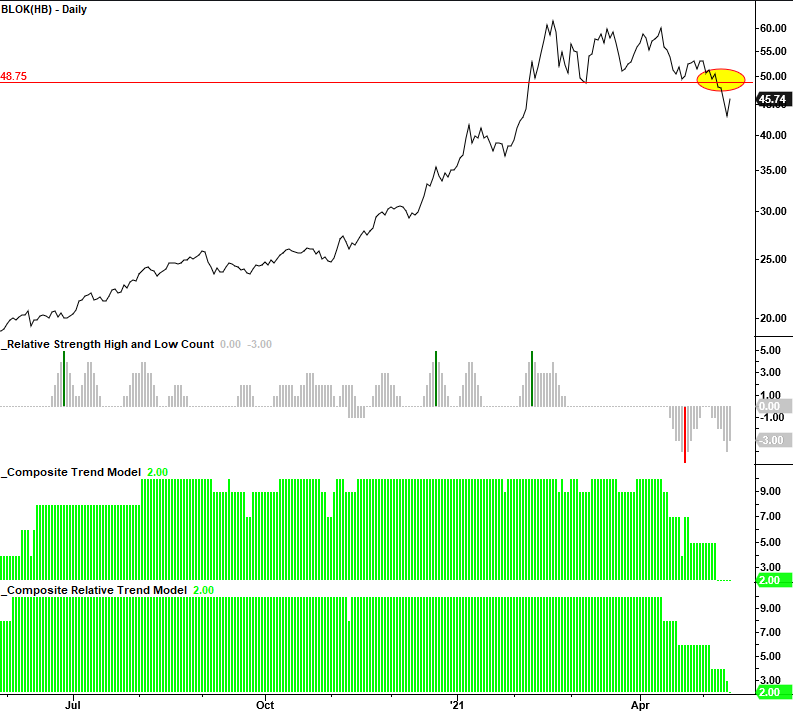
CHART IN FOCUS - TRANSFORMATIONAL DATA SHARING - BLOCKCHAIN/BITCOIN
The Amplify Transformational Data Sharing ETF completed an intermediate-term top last week. I would watch the breakdown pivot point at $48.75. If it fails to recover above that level, take note. The ETF is a good proxy for Bitcoin and other digital assets.
ABSOLUTE & RELATIVE TRENDS - COUNTRIES
European ETFs continue to improve, with the percentage of countries outperforming the S&P 500 rising to 80%. Taiwan got hit hard last week. I shared a note that showed the percentage of 4-week lows spiked to a level that should set up a mean reversion opportunity. The relative trend score for South Africa continues to gyrate up and down.
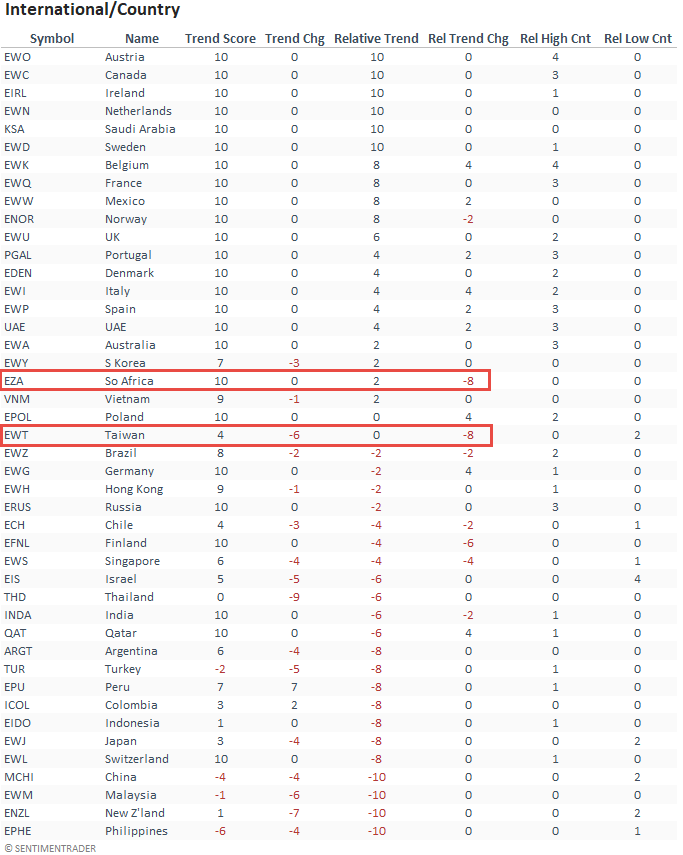
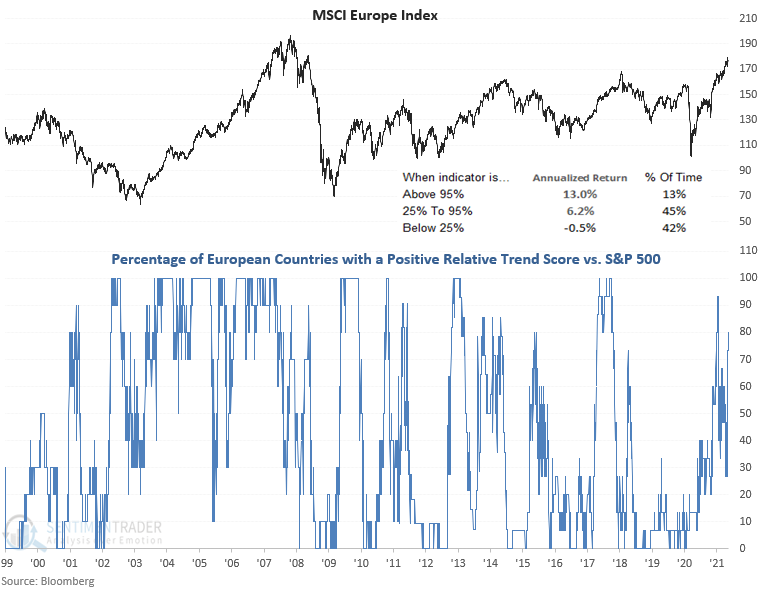
CHART IN FOCUS - EUROPEAN RELATIVE TRENDS
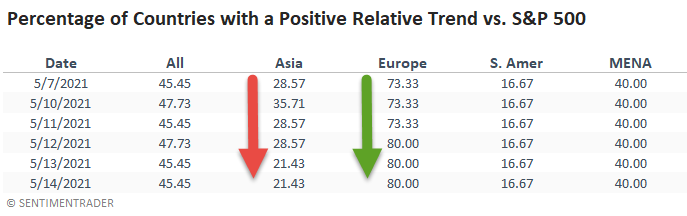
The following table shows that the overall percentage of countries outperforming the S&P 500 remained flat w/w as the gain in Europe was offset by the decline in Asia. The MSCI Europe Index performs well when a high percentage of European Countries are outperforming the S&P 500.
ABSOLUTE AND RELATIVE TREND COLUMN DEFINITIONS
- Absolute Trend Count Score - The absolute trend model contains ten indicators to assess absolute trends across several durations.
- Absolute Trend 5-Day Change - This indicator measures the 5-day net change in the absolute trend model.
- Relative Trend Count Score - The relative trend model contains ten indicators to assess relative trends vs. the S&P across durations.
- Relative Trend 5-Day Change - This indicator measures the 5-day net change in the relative trend model.
- Relative High Count - This indicator measures the number of 21-day relative highs vs. the S&P 500 in the last 5 days.
- Relative Low Count - This indicator measures the number of 21-day relative lows vs. the S&P 500 in the last 5 days.
- Absolute and Relative Trend Scores range from 10 (Best) to -10 (Worst)