About those worrisome PPI headlines...

The headlines are freaking out about inflation "shocks" after the latest PPI report. No doubt there will be hours of breathless reporting about "what it all means" and "how this will affect things moving forward," blah, blah, blah. For the record, the 12-month % rate-of-change for the Producer Price Index stands at +2.02%.
I have a much more simplistic way of analyzing PPI numbers.
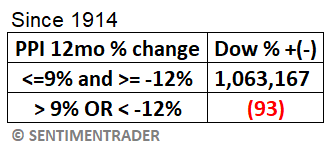
- If the 12-month % change in the Producer Price Index is above 9% OR below -12%, that's bad
- Otherwise, the stock market won't give it another thought until next month's reading
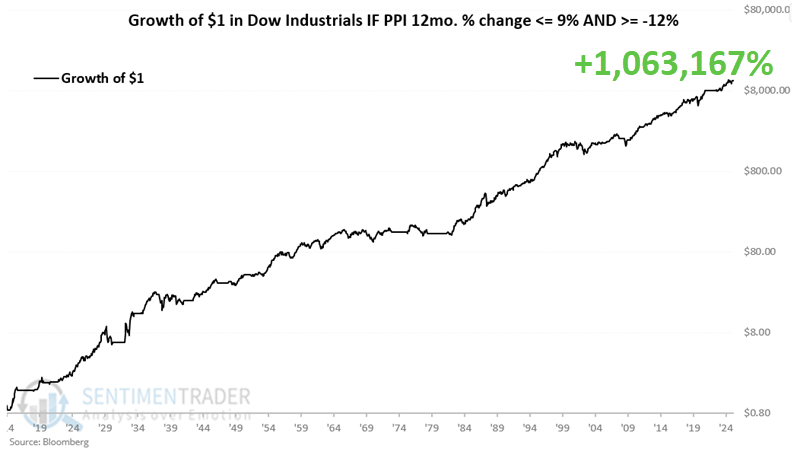
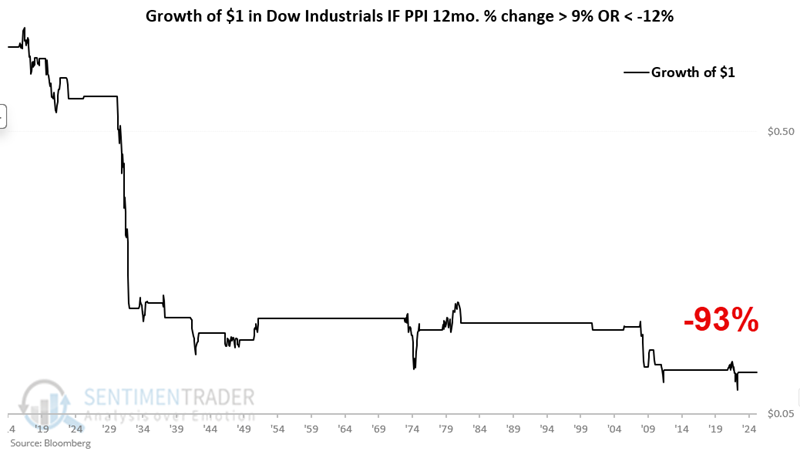
Too simplistic? I looked at the cumulative performance for the Dow Jones Industrial Average since 1914 based on whether the latest PPI 12-month % change value at the end of the month was within the favorable +9% to -12% range, or outside (i.e., greater than 9% or less than -12%). Peruse the table and charts below and decide for yourself how much you want to worry about today's PPI report.