
About the first seven months of 2023...

Key points:
- The first seven months of pre-election years have been exceptionally favorable for stocks since the 1940s
- Specific sectors have stood head-and-shoulders above others during this period
- These tendencies could create opportunities for investors right out of the box in 2023
The first seven months of the pre-election year
This article highlighted the most favorable 10-month period within the four-year election cycle. The bad news is that we are already into the third month. The good news is that the last seven months of this ten-month period have historically demonstrated consistently robust returns.
Let's start with the S&P 500 Index starting in 1943, which was the year before the 1944 presidential election. The chart below displays the cumulative growth of $1 held in the S&P 500 Index only during the first seven months of each pre-election year since then.
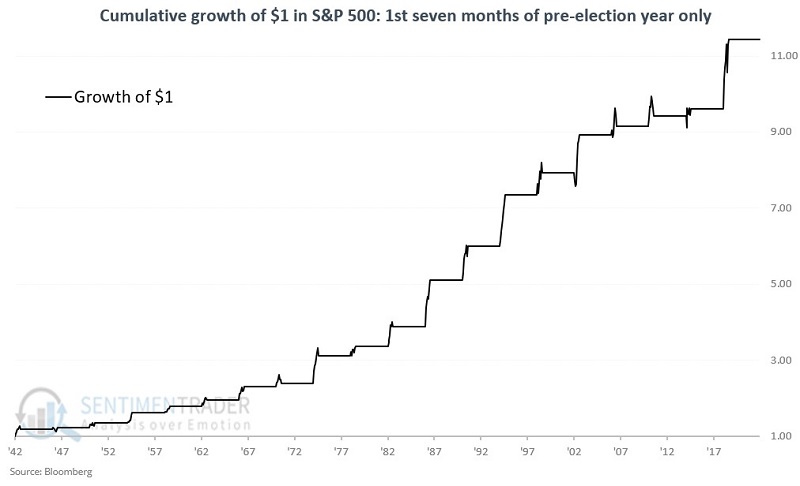
The table below shows the cycle-by-cycle performance of the S&P 500 during just this favorable seven-month period. There were no losses.
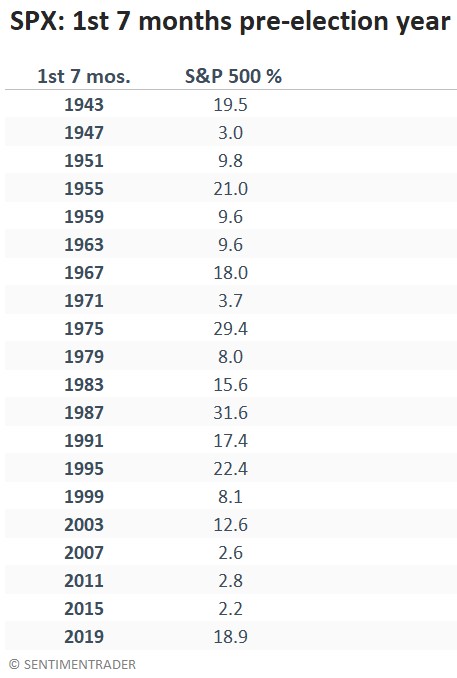
Stock market performance has been a model of consistency during this seven-month favorable period since 1943. This is a good time to invoke the most important caveat regarding any seasonal trend - i.e., there is never any guarantee that a given trend will work out as expected the next time around.
Taking a look at sector performance
Now let's look at the performance of each of the major S&P 500 sectors during this favorable period. For testing, we used the Fama French Index database from 1943 to 1991 and then the S&P 500 sector data after that.
The table below displays the cumulative percentage gain for each sector if they are all held only during the first seven months of each pre-election year.
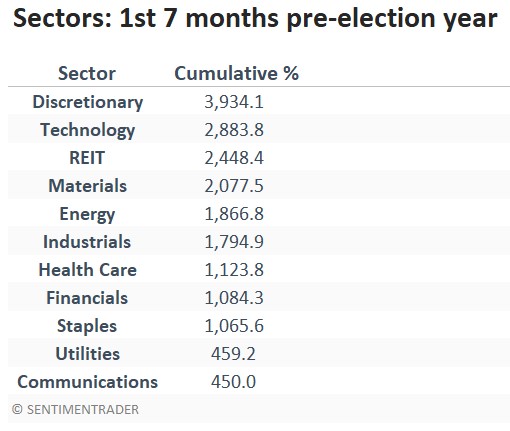
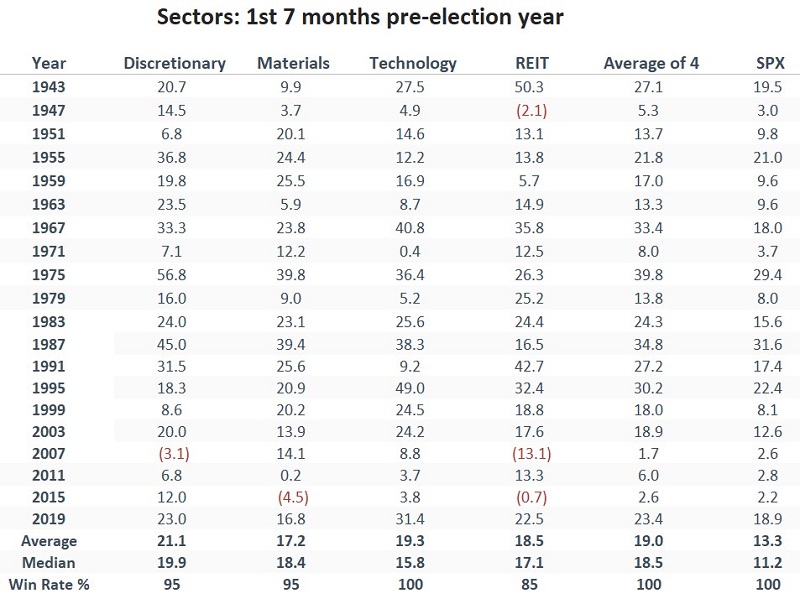
The top four performing sectors during this favorable period were Consumer Discretionary, Technology, Real Estate, and Materials. The table below displays the cycle-by-cycle returns for each of these sectors during the favorable period. The average of all four top sectors and the S&P 500 performance are included for the sake of comparison.
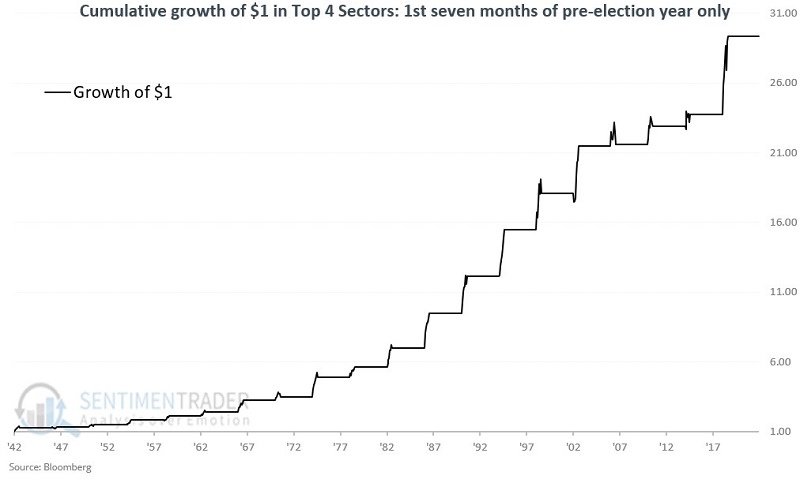
The chat below displays the cumulative growth of $1 split evenly among the Top 4 sectors on January 1st of each pre-election year and held through the end of July.
What the research tells us…
It's hard to quibble with the results shown above. There can be little argument that the first seven months of the pre-election year have been favorable for stocks since the 1940s, nor that the top sectors have performed beautifully. Unfortunately, historical results only go so far when investing real money in real-time. Nothing that appears above relieves an investor of making the critical decisions regarding allocating capital and managing risk if and when things do not go as planned. The adage of "hope for the best, prepare for the worst" remains solid advice.