
About that supposedly worrisome Equity Risk Premium...

Key points
- The Equity Risk Premium has fallen to a multi-year low
- This seems to be setting off a lot of dire warnings on social media websites
- As usual, the masses appear to be getting it wrong
Defining the Equity Risk Premium
The Equity Risk Premium (ERP) indicator measures the difference between the earnings yield (100/PE Ratio) on the S&P 500 minus the current yield on 10-year Treasury notes. The higher the risk premium, the more attractive stocks are relative to bonds.
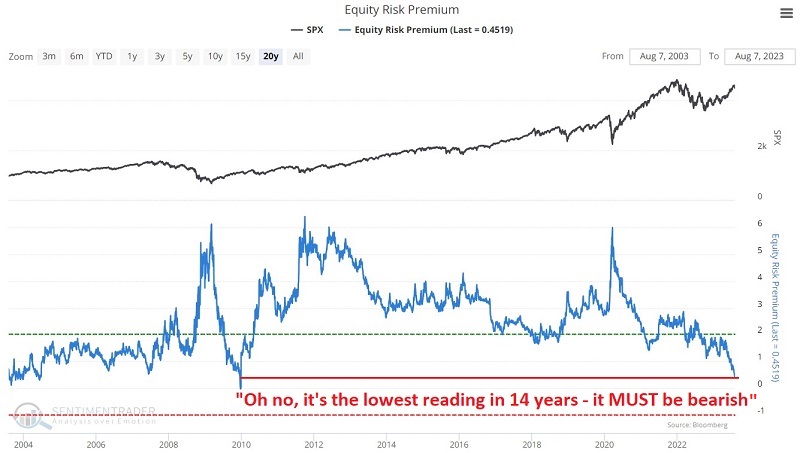
As you can see in the chart below (which has recently appeared roughly a bazillion times on my Twitter feed from various sources), the ERP has fallen to its lowest level in over 13 years. This has set off many alarm bells, with pundits voicing ominous warnings about stocks being overvalued relative to bonds. And to some extent, that argument may have some merit - just not based on this indicator, as we will see in a moment.
At first glance, it does appear in the chart above that ERP is extremely low. However, if we go back and draw the entire history of ERP readings going back to 1962, the current reading is not at "rock bottom," as many suggest, but rather, right smack dab in the middle of the road.
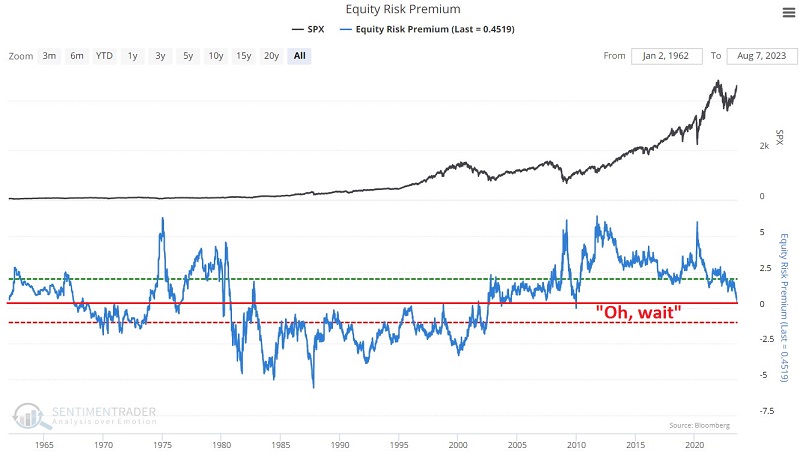
This does not mean the latest reading is insignificant - as we will discuss shortly. It is. Just not in the way, most people seem to think.
The best signal from ERP
It is correct to state that the higher ERP, the more undervalued stocks are relative to bonds. And at the extreme, it can signal a very bullish opportunity for stock investors. The chart below displays every time ERP crossed above 5.0 for the first time in at least a year, and the table summarizes subsequent S&P 500 performance.
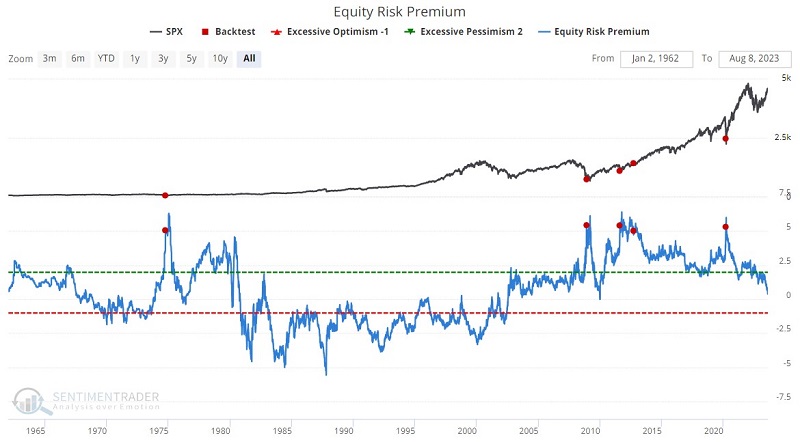
The good news is that historical results have been spectacular. The bad news is that this signal happens very infrequently, ERP is nowhere close to 5.0 at the moment, and the indicator is (apparently) presently heading in the wrong direction (i.e., falling hard). So are the social media doom and gloom pundits right after all? Are they ever?
A closer look at the latest ERP reading
Far from crossing above 5.0, the ERP recently crossed below 0.50. If high readings are bullish, then human nature dictates that sharp declines to multi-year lows MUST be bearish. But what does history tell us?
The chart below displays all times ERP crossed below 0.50, and the table summarizes subsequent S&P 500 performance.
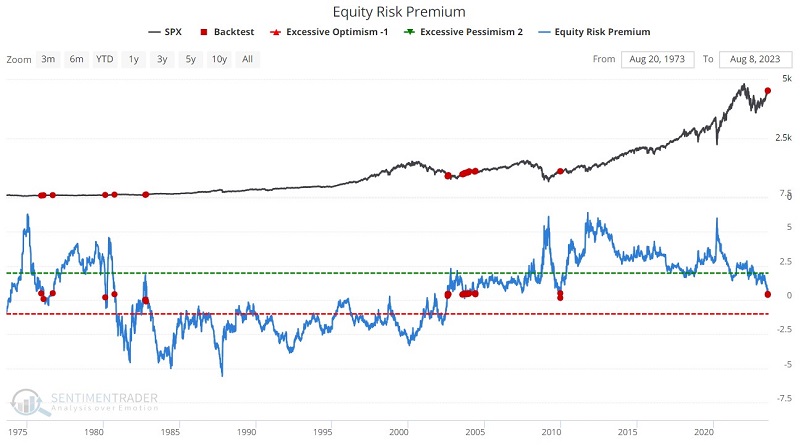
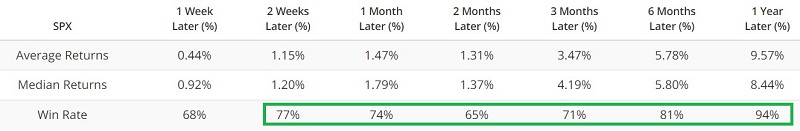
The average and median returns are not spectacular. However, the Win Rates are pretty solid at 81% after six months and 94% after 12 months. So to state that the recent action of ERP is "bearish" appears to have little historical justification.
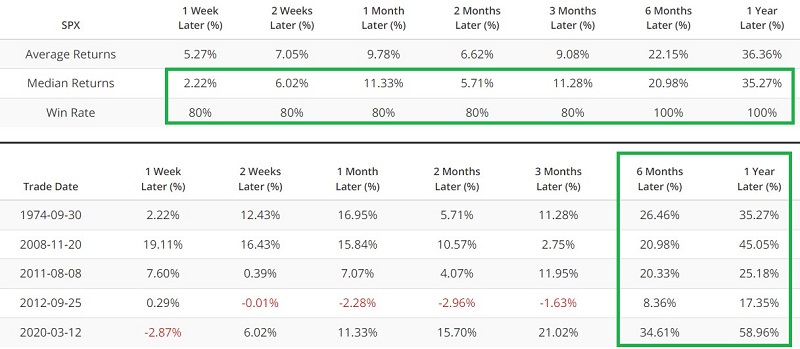
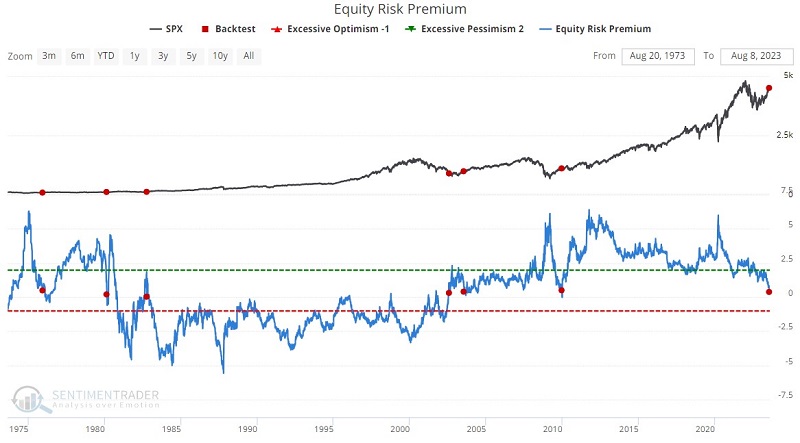
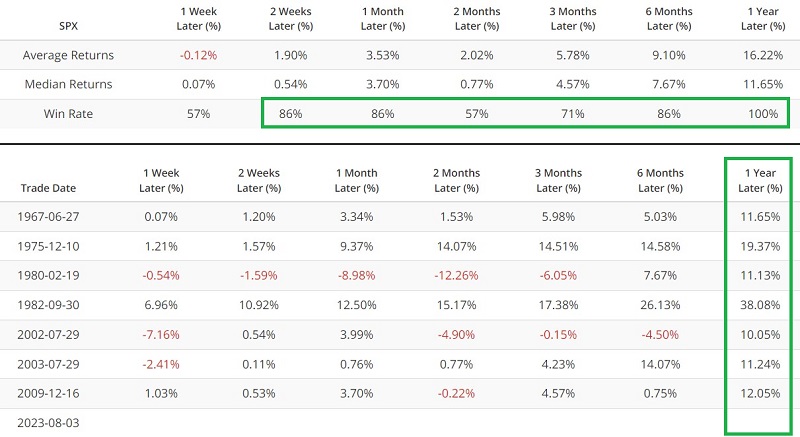
To go one step further, let's again limit ourselves to only one signal within 12 months. The chart below displays only those times when ERP crossed below 0.50 for the first time in 12 months. The most recent occurrence was on 2023-08-03.
The table below summarizes subsequent S&P 500 performance. Overall, returns are not spectacular. However, the key thing to note is that the S&P 500 gained at least double digits in all seven previous instances in the next twelve months.
What the research tells us…
Does the recent decline by the Equity Risk Premium indicator below 0.50 guarantee a double-digit return for stocks in the year ahead? Of course not. However, it does lend a certain amount of weight to the bullish side of the weight of the evidence. In addition, it reminds us (once again) to avoid knee-jerk reactions to supposedly ominous items posted on social media. Could the stock market turn bearish? Of course. Will it turn bearish because the Equity Risk Premium just hit a multi-year low? History suggests the answer is "No."