Products
SentimenTrader Trading Tools
‍
Backtest Engine
My Trading Toolkit
Correlation Analysis
Seasonality
Market Prediction
Indicators & Data API
‍
Proprietary Indicators & Charts
Market Data API
Strategies & Scanner
‍
50+ Trading Strategies
Smart Stock Scanner
Smart Option Scanner
Research Reports
‍
Research Solutions
Reports Library
Free Resources
Simple Backtest Calculator
Simple Seasonality Calculator
The Kelly Criterion Calculator
Sentiment Geo Map
Public Research Reports
Education
Sentiment Indicators
Technical Indicators
Pricing
Company
About
In the News
Testimonials
Client Success Stories
Contact
Log inLoginSign up
< BACK TO ALL REPORTS

About that overbought stock market...

Jay Kaeppel
2023-12-26
Strong rallies create "overbought" conditions, which causes some investors to feel anxious and concerned. Market history, however, typically suggests the opposite. This piece highlightsS&P 500 action following previous extreme readings in the % of S&P 500 stocks above their 50-day moving average.

Key points

  • The SPY Breadth (% > 50 Day Avg) indicator recently spiked above 90%
  • This triggered the usual chorus of "overbought market" warnings
  • Reality paints a very different picture

The vast majority of S&P 500 stocks are in uptrend

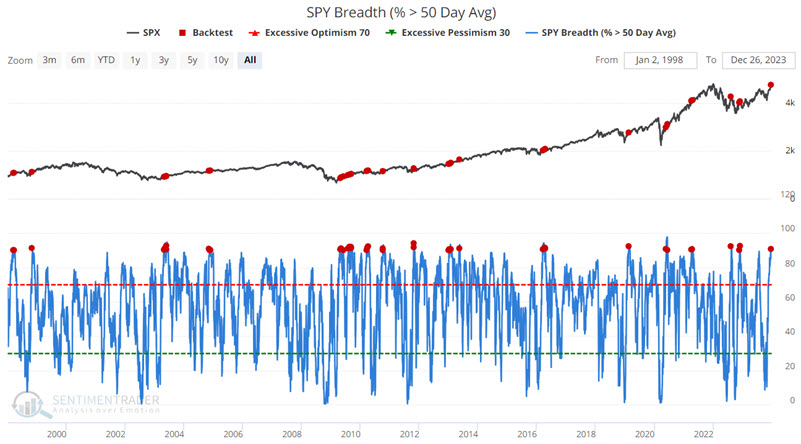
As the name implies, the SPY Breadth (% > 50 Day Avg) indicator measures the percentage of S&P 500 stocks trading above their respective 50-day moving averages. A reading of 90% or more invariably occurs only after a powerful thrust higher in the market - such as the one we've seen in the last several months.

Low readings indicate an "oversold" market and, often notably, not always - suggest a decent buying opportunity. Therefore, when high readings occur, human nature triggers a tendency for many investors and pundits to raise fears of an "overbought" market that is likely to decline. This is precisely why we "crunch the numbers" and attempt to quantify results because reality is quite different from theory in this case.

The history of crosses above 90% sends a strong signal

The chart below highlights each date when the SPY Breadth (% > 50 Day Avg) indicator crossed above 90% (including overlaps) since 1998. The most recent signal occurred on 2023-12-19.

The table below summarizes performance results for the S&P 500 Index following previous signals.

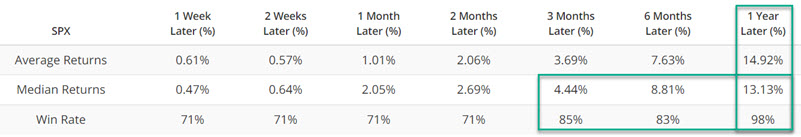
As a frame of reference, since 1998-01-02, the median 12-month return for the S&P 500 Index is +11.1%, with a Win Rate of 77%. As you can see in the table above, the median 12-month return following the dates highlighted in the chart above was +13.13%, with an exceptionally high Win Rate of 98%.

Traders relying on gut instinct and trying to play the short side of stocks following previous supposedly "overbought" readings paid a high price. Conversely, investors who used to confirm an ongoing uptrend profited handsomely and consistently.

What the research tells us…

Does the recent cross above 90% by the SPY Breay Avg) indicator imply a 98% probability of a gain of 13% for the S&P 500 Index in the year ahead? That's not exactly how this works. The numbers highlighted above are merely history. No signal from any indicator ever guarantees anything. The information highlighted above does not constitute a standalone trading system. The recent signal on 2023-12-19 is best thought of as "weight of the evidence" for the favorable side of the ledger.

Most importantly, a trader who thinks that the recent "overbought" status of the market means they should load up on the short side ought to seriously consider market history more closely and verify that they have other reasons for being bearish. Investors who are long in the market but are feeling nervous following the recent strong rally should probably take some comfort in the results highlighted above (while still maintaining whatever risk controls they have in place).

PRODUCTS
SentimenTrader
Trading Tools
Indicators & Data API
‍
Strategies & Scanner
‍
Research Reports
FREE
RESOUrCES
Simple Backtest
Calculator
Simple Seasonality
Calculator
The Kelly Criterion
Calculator
Sentiment Geo Map
‍
Public Research Reports
‍
Education
Sentiment Indicators
‍
Technical Indicators
‍
Pricing
Bundle pricing
‍
FAQ
‍
Announcements
‍
COMPANY
‍
About
‍
In the News
‍
Testimonials
‍
Client Success Stories
CONTACT
‍
General Inquiries
‍
Media Inquiries
‍
Financial Professionals Inquiries
‍
© 2026 Sundial Capital Research Inc. All rights reserved.
Setsail Marketing
TermsPrivacyAffiliate Program
Risk Disclosure: The information and tools provided are for research and analytical purposes only and are not intended as investment advice. Market analysis involves uncertainty, and outcomes may differ from expectations. Users should conduct their own due diligence and consider their individual circumstances before making any financial decisions. Past performance is not necessarily indicative of future results.

Hypothetical Performance Disclosure: Hypothetical performance results have many inherent limitations, some of which are described below. No representation is being made that any account will or is likely to achieve profits or losses similar to those shown; in fact, there are frequently sharp differences between hypothetical performance results and the actual results subsequently achieved by any particular trading program. One of the limitations of hypothetical performance results is that they are generally prepared with the benefit of hindsight. In addition, hypothetical trading does not involve financial risk, and no hypothetical trading record can completely account for the impact of financial risk of actual trading. for example, the ability to withstand losses or to adhere to a particular trading program in spite of trading losses are material points which can also adversely affect actual trading results. There are numerous other factors related to the markets in general or to the implementation of any specific trading program which cannot be fully accounted for in the preparation of hypothetical performance results and all which can adversely affect trading results.

Testimonial Disclosure: Testimonials appearing on this website may not be representative of other clients or customers and is not a guarantee of future performance or success.