
AAPL Calendar Spread - Part II

Key Points
- Part I highlighted an example call calendar spread using options on ticker AAPL
- The critical factors regarding calendar spreads are: Price action, time decay, and changes in implied volatility
- It is also essential to formulate a plan for each options trade
First things first
If you have absolutely no interest in options and/or are pretty sure you will never trade options, then it is "class dismissed early" for you today. Thank you for checking in and please be sure to read my next non-options-related piece.
AAPL Calendar spread - a quick review
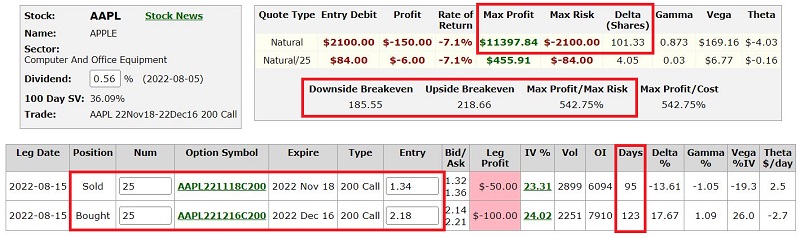
The example trade is an out-of-the-money calendar spread created as follows:
- Buy 25 AAPL Dec16 2022 200 call @ $2.18
- Sell 25 AAPL Nov18 2022 200 call @ $1.34
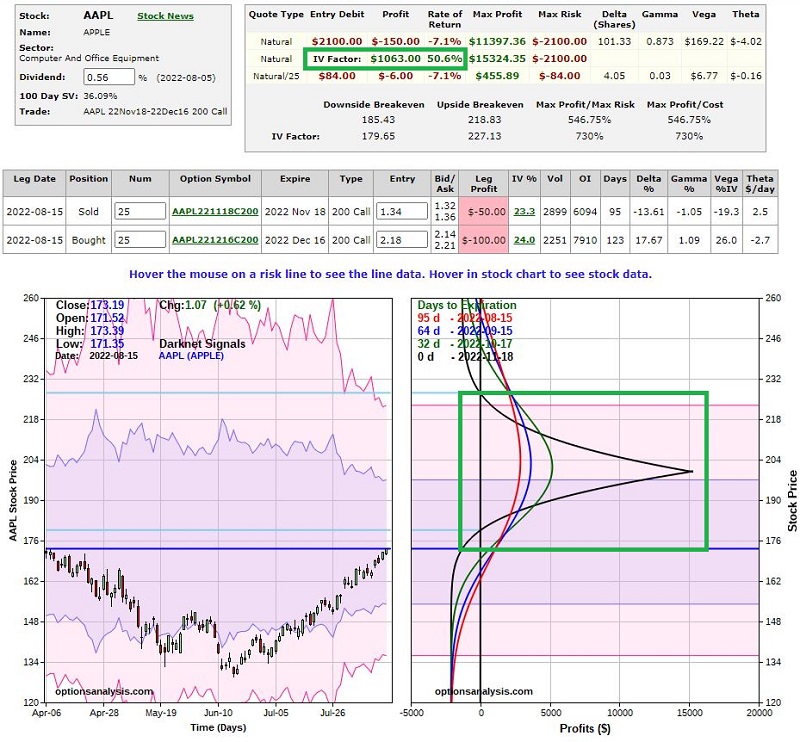
The particulars for this position and the risk curves (i.e., the expected profit/loss as of a given date at a particular price for AAPL shares) appear below (courtesy of Optionsanalysis).
Key factor #1: price action
As you see in the chart above, the profit or loss will rise or fall depending on changes in the price of AAPL shares. To a point. The goal is for the price to climb to the $180 to $200 a share range. This would generate a substantially high rate of return on the $2,100 committed to the trade.
Things to keep in mind are:
- If price falls, this trade is virtually certain to lose money (though no more than $2,100)
- If price rises above $200 a share, the risk curves will roll over and decline
This means we must make decisions in advance regarding how to handle these situations. On the downside, the question is whether to cut a loss at some point (based either on $ loss for the option trade or some particular price point for AAPL shares) or just to let it ride, content that $2,100 does not exceed our maximum pain point.
On the upside, it is a little easier: If AAPL shares near $200 and we are still holding this position, it is time to take a profit or adjust the trade; i.e., there is no reason to give back profits if AAPL does exactly what we want it to do. On the other hand, if AAPL rallies to say $190 and then stalls out, we may need to decide whether to take a profit or not.
Key factor #2: time decay
Time decay refers to the fact that every option will lose all of its time premium by option expiration. Because both of the call options in our example trade are out-of-the-money (i.e., the strike price for the calls is above the price of AAPL shares), their prices are comprised entirely of time premium. If AAPL is below $200 a share when each option expires, that option will expire worthless.
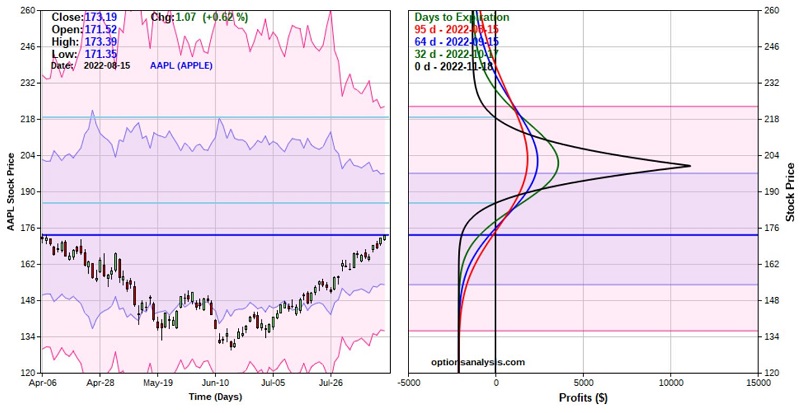
The Greek value theta reflects the dollar amount of time decay a particular option will incur in a single day. Note that theta is not static and will change over time based on price changes and the passage of time. In the figure below, we see that as the trade is entered, we will lose $2.70 of time premium on the long call on the first day of this trade. On the other hand, we will gain $2.50 of time premium from the short call (we are short the November call, so as it declines in price, we show a gain on that option). So, for now, time decay hurts this position. But two things can and will affect this state of affairs.
First, time decay accelerates as option expiration draws closer. As a result, at some point, the short November call will begin to experience much more daily time decay than the long December call. Think of it this way. If AAPL remains below the strike price of $200 through November options expiration, the November 200 call will expire worthless, generating a profit of $1.34 per contract. The question is, "how much time premium did the long December call lose by that point?" If the long December call loses less than $1.34 of time premium by November expiration, then this trade will show a net profit at that time.
For the sake of example, let's assume that the November call expires worthless and that the December call is still worth $1.30 at that time.
- November call expires worthless: $1.34 x 100 shares x 25 contracts = +$3,350
- December call worth $1.30: ($1.30 - $2.18) x 100 shares x 25 contracts = -$2,250
- Net gain = $3,350 - $2,250 = $1,100
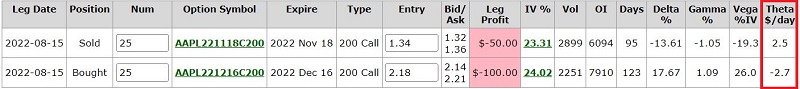
Remember that theta changes as the price of the underlying stock changes. The chart below displays risk curves for four dates from 2022-08-15 through 2022-10-17. The thing to note is this:
- Below roughly $180 a share (red box in the chart below), time decay works against this trade (i.e., the expected $ P/L is less from one date to the next, indicating a growing open loss on the trade)
- Between roughly $180 and $220 a share (green box in the chart below), time decay works in favor of this trade (i.e., the expected $ P/L is greater from one date to the next, indicating a growing open profit on the trade)
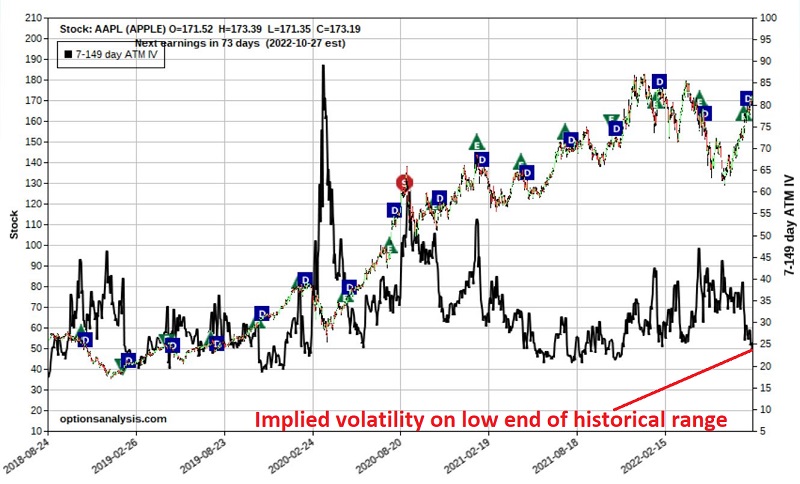
Key factor #3: Changes in implied volatility
The most little-known and/or misunderstood factor regarding a calendar spread is the effect of changes in implied volatility. The chart below displays a bar chart for AAPL stock with the average implied volatility for AAPL options appearing as a black line. As you can see, implied volatility can make large swings over time. These swings indicate whether time premiums are presently high, low, or somewhere in between.
Implied volatility is calculated by an options pricing model such as Black-Scholes. In a nutshell, high implied volatility indicates a lot of time premium built into the price of the stock's options, and low implied volatility indicates the opposite. The key concept: You would prefer IV to rise after a calendar spread is entered. Let's discuss why this is so.
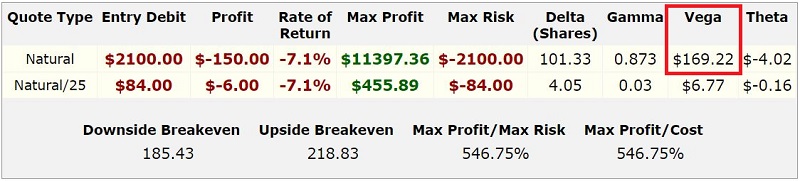
The Greek value Vega indicates the $ amount of time premium that an option or combined option position will gain or lose if volatility rises one full percentage point. The table below shows that our 25-lot calendar spread has a delta of $169.22. This tells us that if implied volatility increases one full percentage point, this position can be expected to gain $169.22 in value due solely to the change in volatility. Conversely, if IV falls one point, this position will lose $169.22 of time premium.
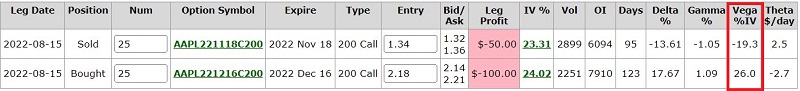
To cover all the bases, Vega is positive with a calendar spread because longer-term options will always have a higher Vega than a shorter-term option at the same strike price. The chart below shows that the long December call has a Vega of $26.0, and the short November call has a Vega of -$19.3. So an increase in volatility will increase the value of the overall position and vice versa.
The bottom line: If IV increases after a calendar spread is entered, it will help the position, and if IV decreases, it will hurt the position.
The point: One of the biggest mistakes in option trading is buying a calendar spread when implied volatility is extremely high. The high IV can make a given calendar spread look enticing; HOWEVER, if the IV plummets after the trade is entered, the position can lose money very quickly because the long option will lose more time premium than the short option. This phenomenon is commonly referred to as a "volatility crush." And it is just as bad as it sounds. Likewise, the only defense from a volatility crush is selling at a loss quickly before it gets worse.
The chart below estimates the effect of a 30% rise in implied volatility during the life of our example trade. The two key things to note:
- The expected increase in the value of the position is +$1,063
- The range of profitability at November expiration (green box in the chart below) expands from $219 to $227 on the upside and from $185 to $180 on the downside
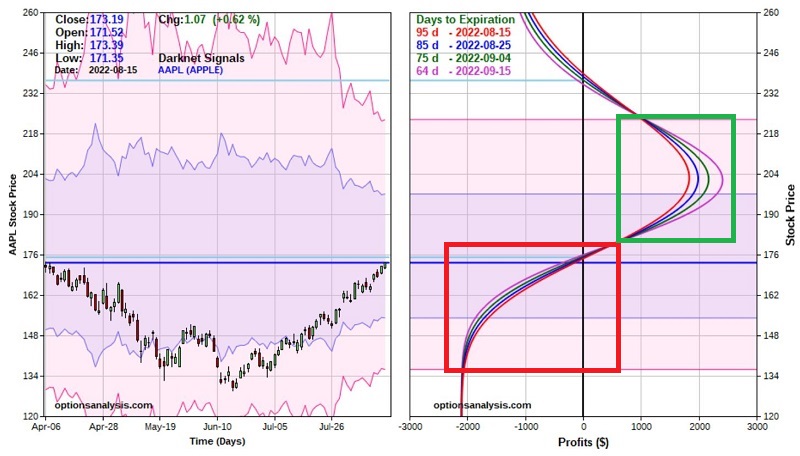
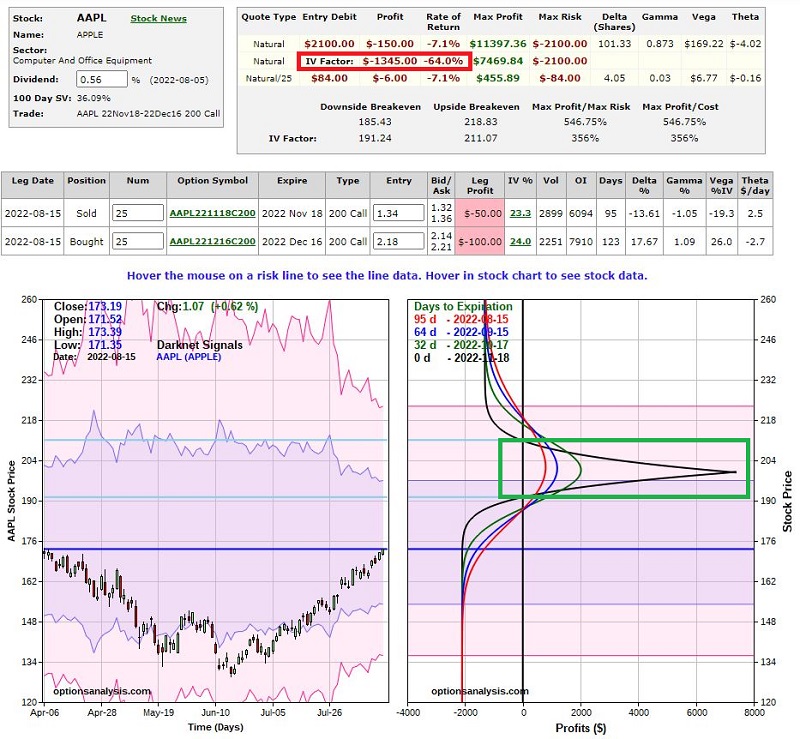
The chart below estimates the effect of a 30% decline in implied volatility during the life of this trade. The two key things to note:
- The expected decrease in the value of the position is -$1,345
- The range of profitability (green box in the chart below) narrows from $219 to $211 on the upside and from $185 to $191 on the downside
Forming a calendar spread trading plan
If you are still with me at this point - first, thanks for hanging in there - you almost certainly understand now why a calendar spread is not a set it and forget it strategy. It requires monitoring and decisive action when a critical moment is reached. One thing to note is that there is no one best way to manage a calendar spread, so what appears below is strictly an example presented as food for thought.
Taking a loss: The critical decision is whether to cut a loss at a particular time or to let it ride. If the trade is positioned so that $2,100 does not exceed your maximum risk threshold for a single trade, the position can be held through November expiration. Remember, you will still own 25 December 200 calls at that point, with another month left until expiration.
Taking profits: If AAPL approaches the previous high near $182-183 a share, the trade would be expected to have a significant open profit. Taking partial profits on this position at that point would make sense. Likewise, if implied volatility on the December calls exceeded 30% (which would be a 30% rise from the current level of 24%), some profit-taking is also reasonable. And if AAPL rallies to $200 a share during the life of this trade, then all positions should be exited.
What the research tells us…
As we've just seen, many factors can significantly impact a directional calendar spread. The keys things to remember are, a) give the trade some time to work out, b) do not enter a calendar spread if implied volatility is on the high end of the historical range for that stock (to avoid a volatility crush), c) try to look for opportunities where IV is currently low (to increase the likelihood of volatility helping the position, d) make specific plans regarding stop-losses and profit-taking criteria.