
AAPL Calendar Spread - Part I

Key Points
- AAPL has rallied sharply, and many traders are looking (hoping?) for a potential new all-time high
- Buying 100 shares of AAPL stock costs over $17,000
- A calendar spread using options offers a trader the potential for a high rate of return at a fraction of the cost of buying 100 shares of stock
- There are several factors to analyze when considering a calendar spread
AAPL
In the minds of many investors, Apple is, well, the apple of their eye when it comes to outstanding companies. In the chart below (courtesy of Optuma), we see that AAPL has staged a terrific rally, with some traders expecting a retest of the old highs and possibly a new all-time high.
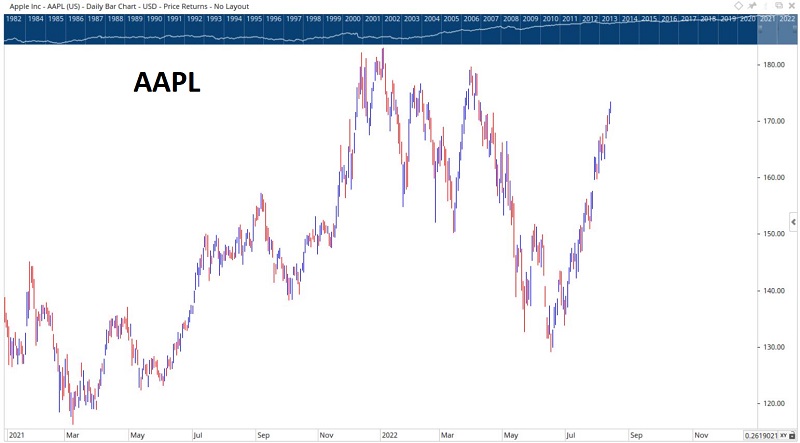
However, one problem for many of those investors is that at $173.19 a share, it costs $17,319 to buy just 100 shares of AAPL stock. Fortunately, there are alternatives for traders who want to play the long side of AAPL but have a problem with the price tag. The same is true for traders who want to bet against AAPL.
A call calendar spread
A trader who expects AAPL to continue to rally in the next several months might consider the example trade below:
- Buy 25 AAPL Dec16 2022 200 call @ $2.18
- Sell 25 AAPL Nov18 2022 200 call @ $1.34
The particulars for this position and the risk curves (i.e., the expected profit/loss as of a given date at a particular price for AAPL shares) appear below (courtesy of Optionsanalysis).
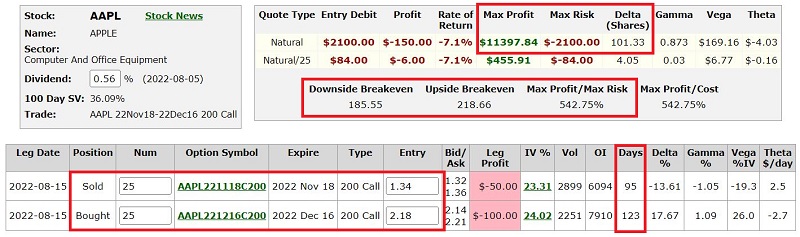
Things to note:
- The cost to enter a 1-lot is just $84. The cost to enter a 25-lot is $2,100
- $2,100 is also the maximum risk
- If held until November options expiration, the trade will show a profit if AAPL is between roughly $185 and $219 a share (depending on changes in volatility which we will discuss in Part II)
The bottom line: This trade will start to accumulate a profit if AAPL rises, but the profit level will roll over and begin to decline if AAPL rallies above the short strike price of $200. On the flip side, if AAPL drops in price by November options expiration, this trade will lose money (but no more than $2,100 no matter how far the stock might fall).
Comparing to 100 shares of AAPL
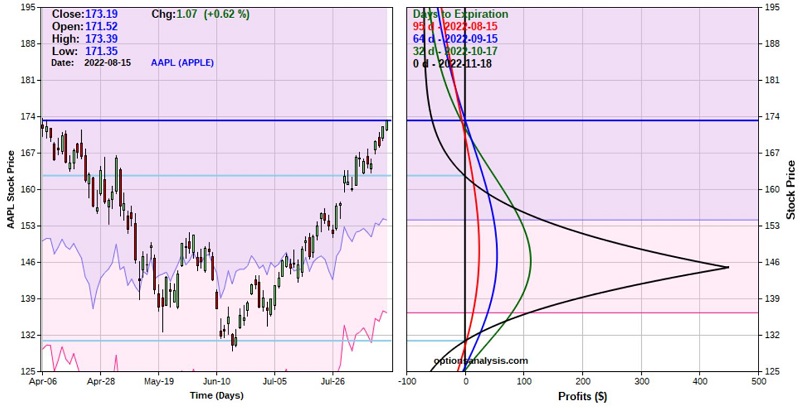
A 25-lot of the AAPL calendar spread has a delta of 101. This means that (for now) this trade is roughly equivalent to holding 100 AAPL shares AAPL stock (but for $2,100 instead of $17,319). However, note that the delta will change as price changes and time goes by. The chart below displays the risk curves for the calendar spread across four different dates versus the risk curve for holding long 100 shares of stock (which is a straight line).
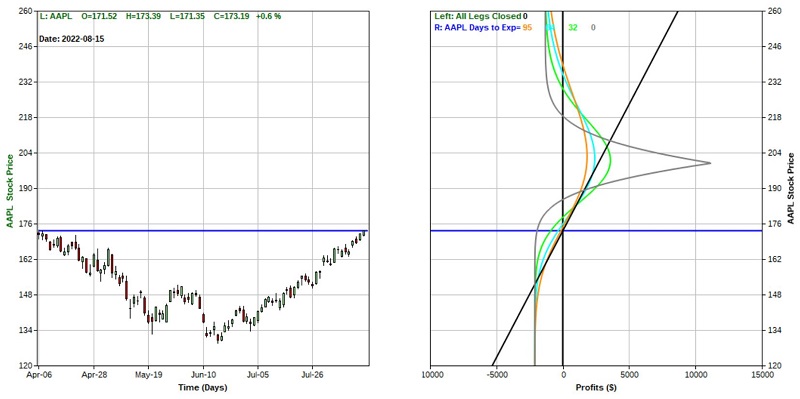
There are tradeoffs involved. As you can see, the long stock shares position is pretty straightforward, whereas the calendar spread has some quirks. To wit:
- If AAPL rises above $200 a share, the stock position keeps making more money while the risk curve for the calendar spread rolls over and can go negative if the price rises far enough (and we are foolish enough to be still holding the position)
- Between roughly $155 and $185, the calendar spread can make less profit or show a larger loss than the stock position due to time decay.
- Below roughly $155, the stock position will keep losing more money while the maximum risk for the calendar spread cannot exceed $2,100.
Where to from here?
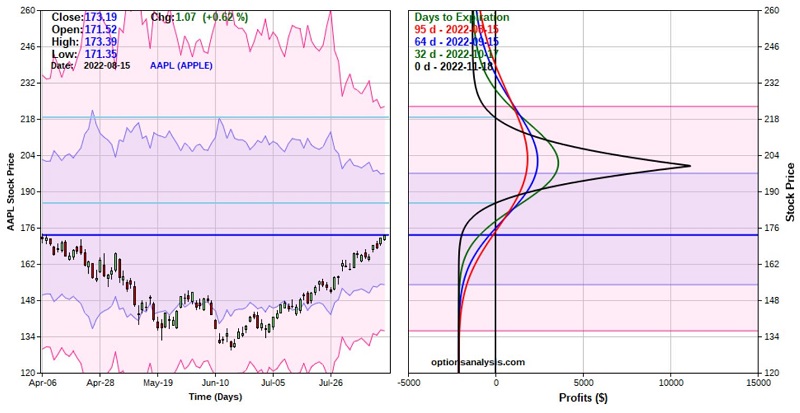
I cannot predict what the price of AAPL will do in the next month, but I can estimate the calendar spread likely profit/loss depending on the price of AAPL shares. Let's look at the risk curve for 2022-09-15. The purple line in the chart below displays the expected P/L for the calendar spread as of 2022-09-15 (64 days before November options expiration).
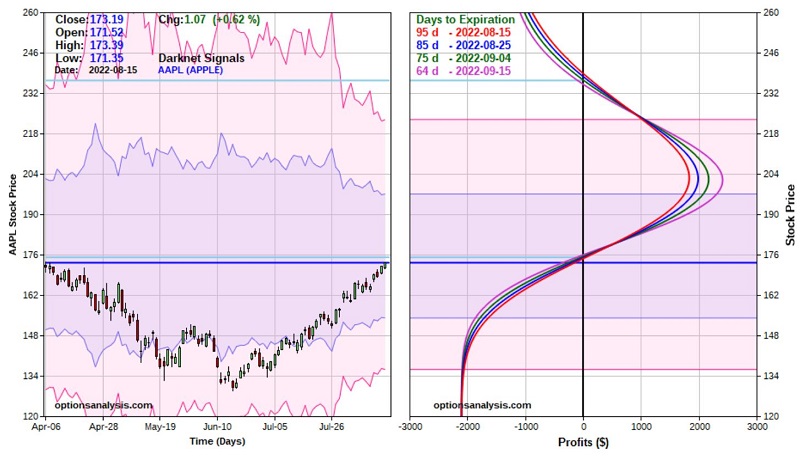
A trader might put on this trade if they think AAPL will continue to rally but don't want to pay $17K+ to buy 100 shares. Barring a change in implied volatility, a rise by AAPL stock to $200 a share by 2022-09-15 would generate an open profit of roughly $2,413 - over a 100% return on capital. A rally of any kind between approximately 180 and 200 will generate a significantly high % return.
Not a one-way street
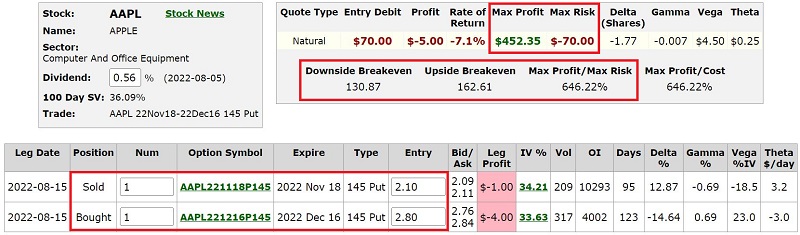
Remember that the calendar spread strategy can also be used to express a bearish opinion. A trader who holds the opposite view of the one above could consider a put calendar spread such as this one:
- Buy 1 AAPL Dec16 2022 145 put @ $2.80
- Sell 1 AAPL Nov18 2022 145 put @ $2.10
The particulars and risk curves for this bearish put calendar spread appear below. The maximum risk for a 1-lot is -$70. A trader can adjust the lot size to achieve a desired level of risk.
What the research tells us…
A calendar spread allows a trader to enter a bullish (or bearish) position, often at a fraction of the cost of buying shares of the underlying stock. However, certain factors can influence a calendar spread. A trader must decide which expiration months and strike prices to trade. They must also develop a plan to manage the trade once entered (a calendar spread is not a set-it-and-forget-it type of trade and needs to be monitored).
Another extremely critical consideration for calendar spreads is implied volatility. We will cover this topic in Part II and spell out an example trade management plan.