
AAII Bull Ratio generates a Compelling Signal

Key points:
- Every twist and turn in investment sentiment is closely analyzed by the universe of market analysts, for clues regarding "too much" bullishness or bearishness among investors
- But sometimes it pays to look at the underlying current and not just the waves on the surface
- The 50-week moving average of the AAII Bull Ratio recently crossed a significant level, suggesting a resurgence in investor bullishness
- Significant market gains have typically followed the signal detailed here; however, the signal itself is best considered as "weight of the evidence" and not as a "set it and forget it" buy signal
Bullish investors are essential to sustaining a bull market
As purveyors of investor sentiment, we often feel a twinge of anxiety when investor sentiment becomes overly bullish. Nevertheless, it is probably a good time to be reminded of:
Jay's Trading Maxim #190: Remember, bulls are needed to sustain a bull market.
One investor sentiment measure for which many uses have been developed over the years is the AAII Bull and Bear Sentiment Survey. The AAII (American Association of Individual Investors) is a non-profit organization headquartered in Chicago and was founded in 1978. Their stated mission is: "assisting individuals in becoming effective managers of their own assets through programs of education, information, and research." It is affiliated with NAIC, the organization that helped so many investment clubs get started in the late 1990's.
Their niche market is individual investors, and not professional traders, pension funds, or anything else institutional. Their focus, and the focus of the great majority of their membership, is long-term fundamental analysis of sound companies using a very minimal amount of technical analysis for decision-making purposes.
The AAII sentiment survey is a weekly poll conducted by the organization to gauge its membership's overall sentiment. They ask their membership where they think the market will be in six months, and group the responses into three categories: bullish, bearish, or neutral.
This indicator is a Bull Ratio, calculated by: BULL RATIO = (BULLS / (BULLS + BEARS))
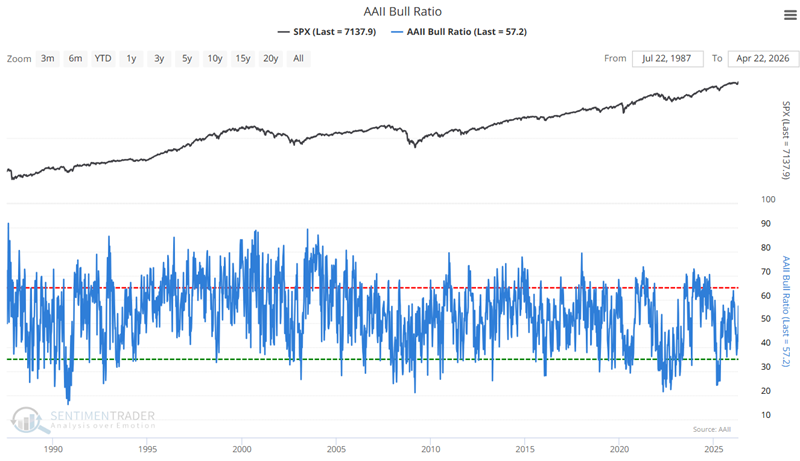
Like most contrarian indicators, when the survey shows too many investors are bullish, it often corresponds to market highs. Conversely, too many bears suggest that the market may soon find a low. The chart below shows the weekly AAII Bull Ratio since 1987.
A longer-term average pulls signals from the noise
The AAII surveys are primarily viewed as contrary indicators - too much bullishness implies trouble, too much bearishness implies opportunity. This is what I call "looking at the waves." However, it is also possible - and in some instances even more useful - to use a longer-term approach to identify significant "market currents" taking place under the surface of all the waves.
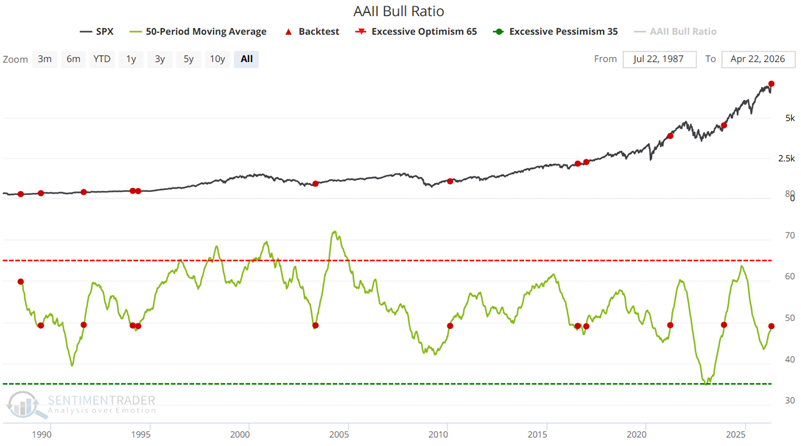
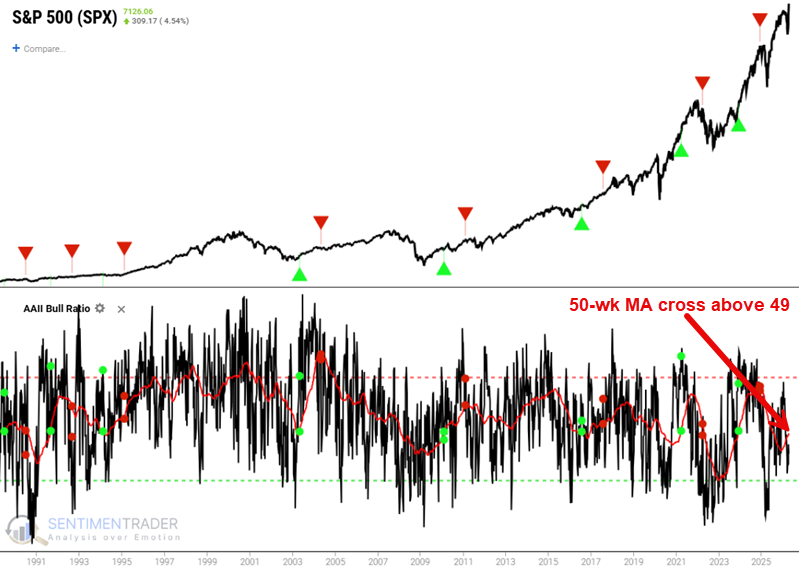
To wit, let's look at one specific way to use the AAII Bull Ratio as a longer-term indicator. The chart below highlights, with a red dot, all weeks when the 50-week moving average of the Bull Ratio indicator crossed above 49, including overlapping signals in 1994 and 2016. The most recent signal occurred on April 22nd, 2026.
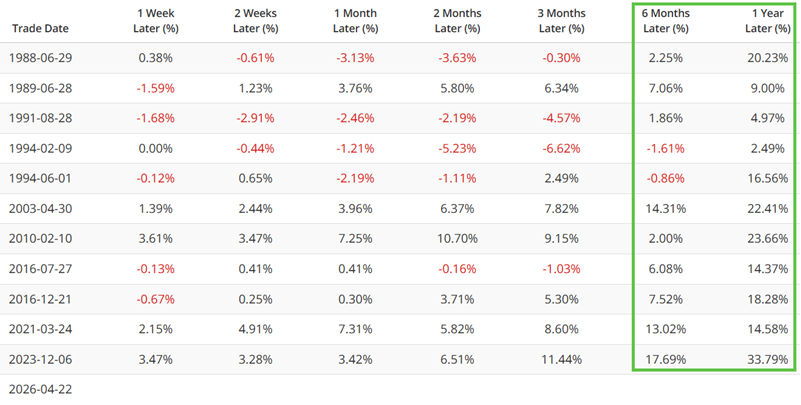
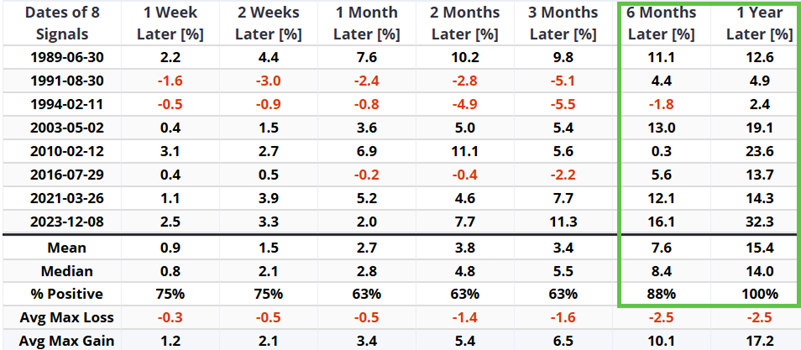
The table below shows the performance of the S&P 500 during different time periods in the year following each previous signal, including all overlapping signals (i.e., signals that occurred within a year of a previous signal). Note the strong tendency for gains 6 and 12 months after a signal.
The table below summarizes post-signal S&P 500 performance.

The 1-Year Win Rate of 100% and Median Return of 16.56% is compelling (though never guaranteed to work the next time around).
Creating a systematic approach to AAII Bull Ratio trend analysis
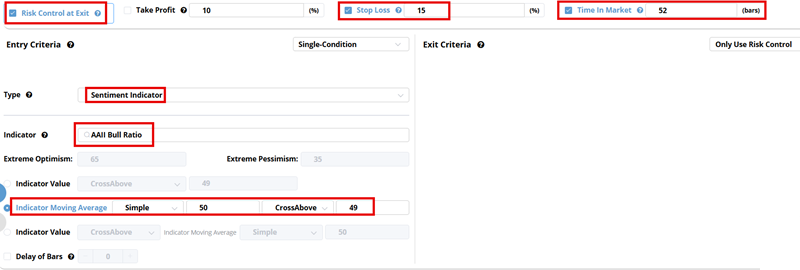
Let's take a look at a systematic approach to using the AAII Bull Ratio. Here are the simple test rules:
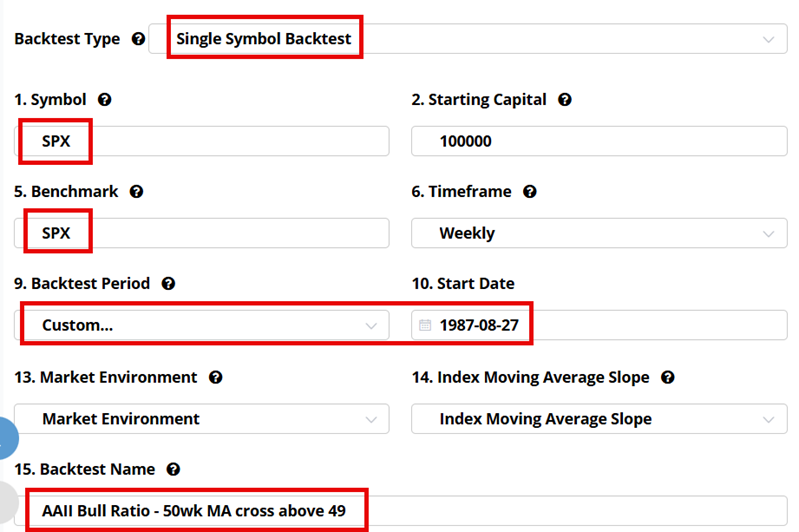
- Buy the S&P 500 Index when the 50-week moving average of the AAII Bull Ratio crosses above 49
- We will use a 15% stop-loss
- Exit the trade after 52 weeks (i.e., one year later)
The input screens to set up this test in Backtest Edge appear below.
The signals from this test appear below. Note that any signal that occurs within 1 Year of a previous signal is ignored for this test.
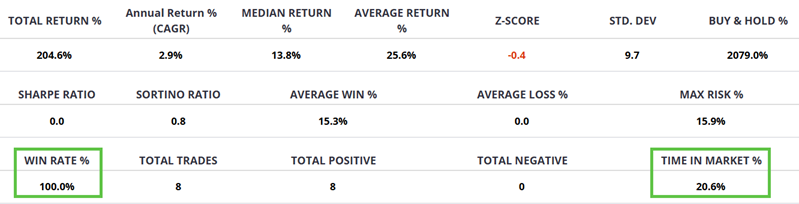
The table below summarizes the test results. Note that this "strategy" is only in the market about 21% of the time, so it is not a good choice for use as a standalone strategy. On the other hand, the 100% Win Rate suggests this may be a useful tool as a confirmation signal, i.e., as weight of the evidence.
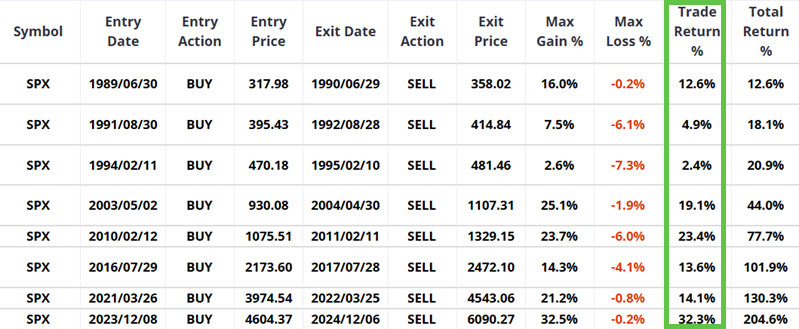
The table below displays the hypothetical trade-by-trade results.
The table below shows that this method has a compelling Win Rate for 6-month and 1 Year periods.
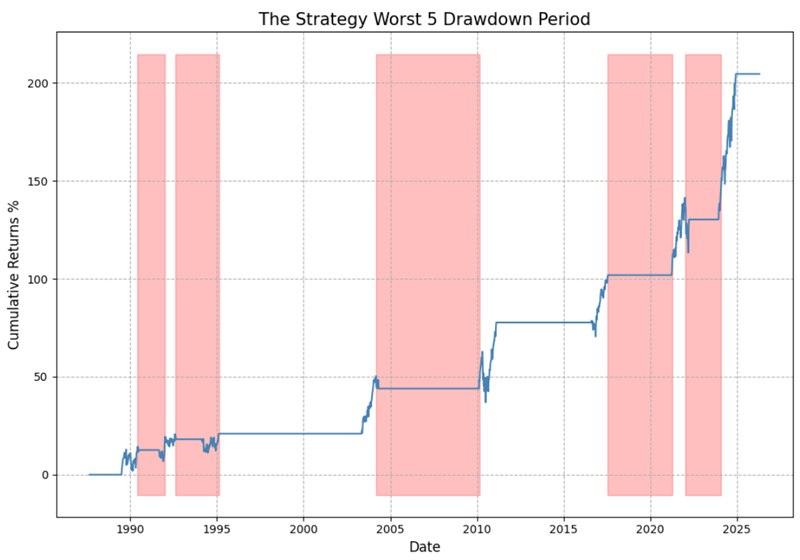
The chart below displays the hypothetical net return from holding the S&P 500 using the rules above. For the sake of setting realistic expectations, note that there can be some volatility along the way. However, overall, the "lower left to upper right" nature of the equity curve is fairly obvious.
What the research tells us…
The level of bullishness among investors swings from low to high and back again. While the most common application of sentiment indicators is to look for extremes to identify potential turning points, sometimes a longer-term approach to analyzing sentiment data can help tease out the underlying current. A reversal to an uptrend in overall bullishness following a period of general bearishness is typically a useful indicator of a favorable environment for investors. The recent cross above 49 by the AAII Bull Ratio 50-week average suggests the potential for bulls to pour back into the market and to propel it even higher in the year ahead.