
AA aye aye

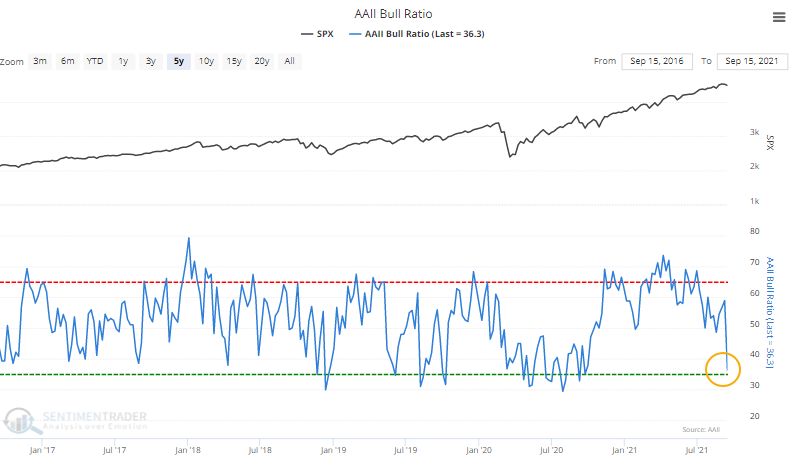
Much is being made this morning about the plunge in individual investor sentiment according to the weekly AAII survey. The Bull Ratio plunged to 36% even as stocks have barely pulled back.
There is a tendency to consider everything a contrary indicator. We try hard to avoid knee-jerk contrarianism, for the simple fact that most things are not a contrary indicator. But let's take a look at the history of this survey and see if the knee-jerks are likely to be correct.
The table below shows every signal since 1987 when the S&P 500 was still within 2% of its highest weekly close of the past 52 weeks and yet the AAII Bull Ratio was below 40%.
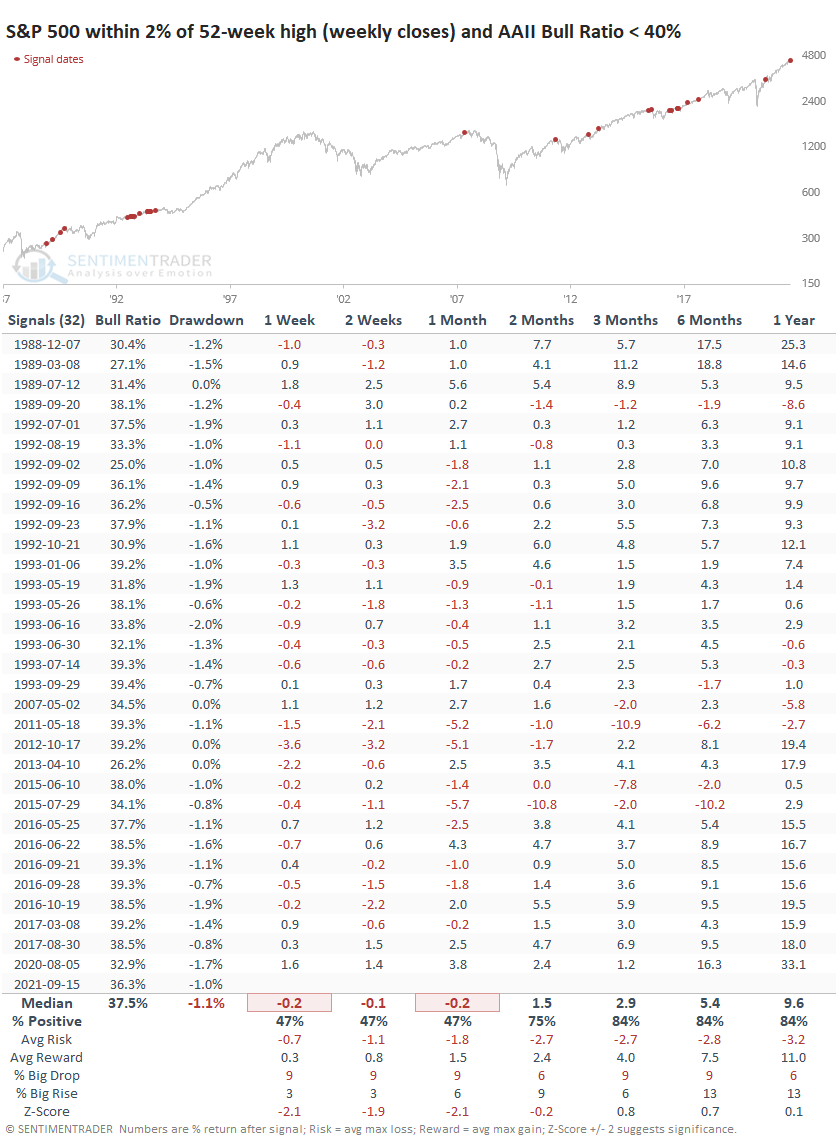
Up to a month later, the AAII folks were correct (we see this tendency often). Note that they were quite prescient near the peaks in 2007 and 2011 and 2015.
Over the longer-term, the S&P's returns were above random, but not egregiously so. It had an above-average win rate, with a decent risk/reward but nothing too special.
Bulls should want to see rising sentiment, as long as it isn't too high. Declining sentiment, even among a retail population, isn't a great sign, especially in the near-term.