
A year with (almost) uninterrupted optimism

Key points:
- In 2024, there was only a week or two when investors turned "not bullish"
- Over multiple decades in two surveys, such displays of persistent optimism are rare
- Those years that saw comparable sentiment tended to see poor returns in the following year
Investors have been bullish almost all year
This has been a year for bulls...and they know it.
Equity allocations are at or near record levels, depending on the denominator, and gains have been broad-based, leading to a record number of millionaire retirement accounts. No wonder it's tough to find a bear - nobody likes losing for this long.
As a sign of just how optimistic folks have been this year, one of the most popular surveys of individual investor sentiment has spent only two brief weeks with (barely) more bears than bulls. It's almost the mirror image of 2022.
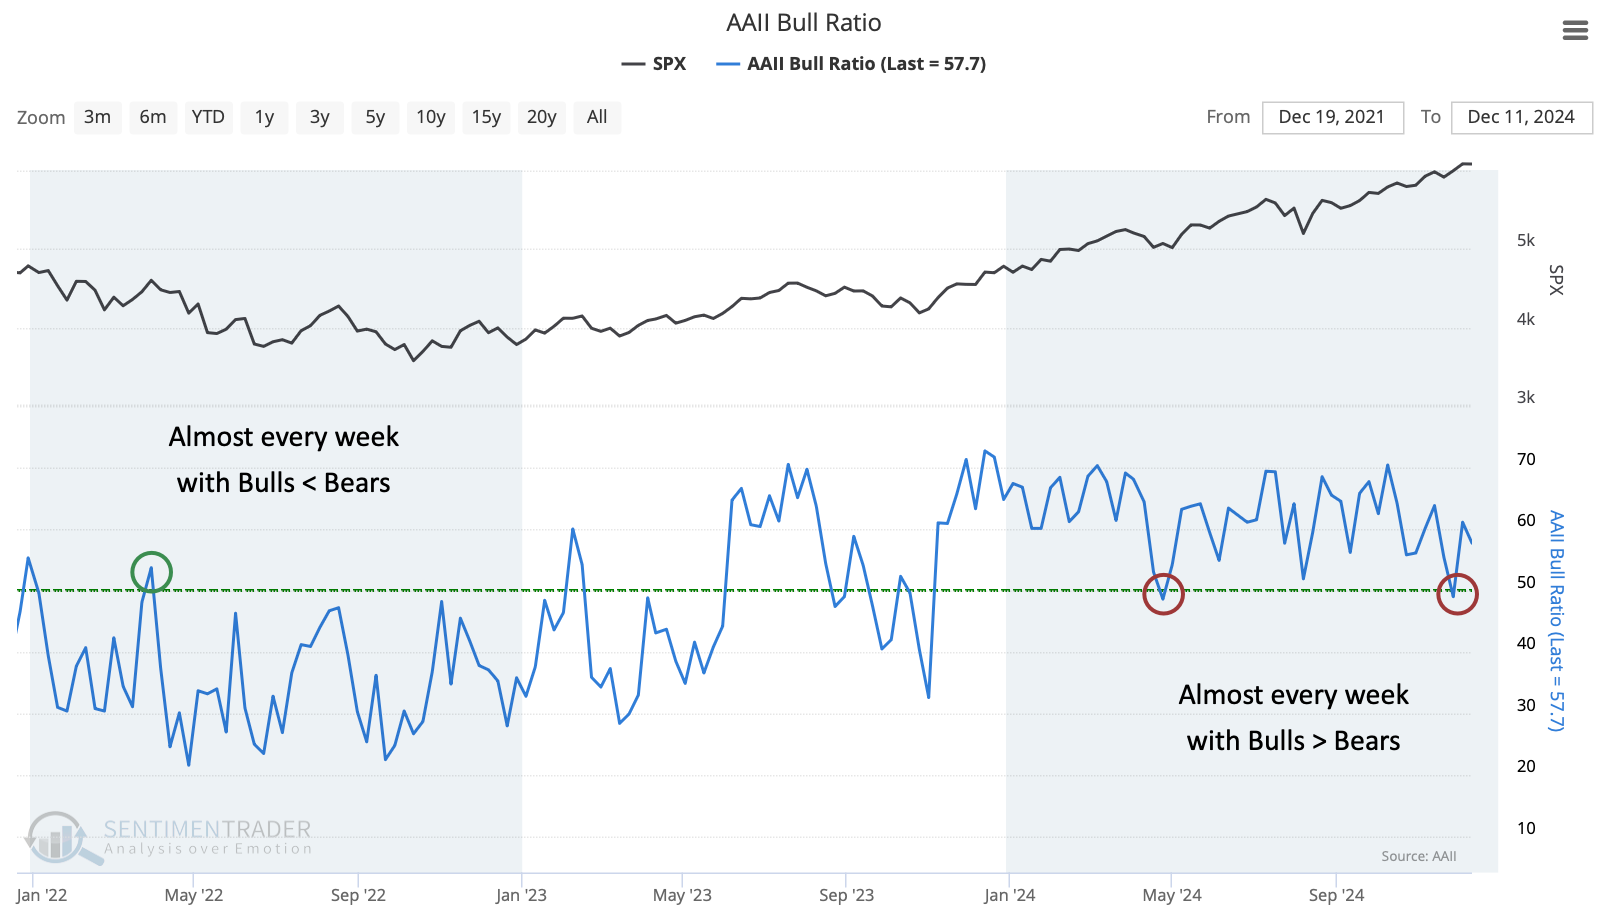
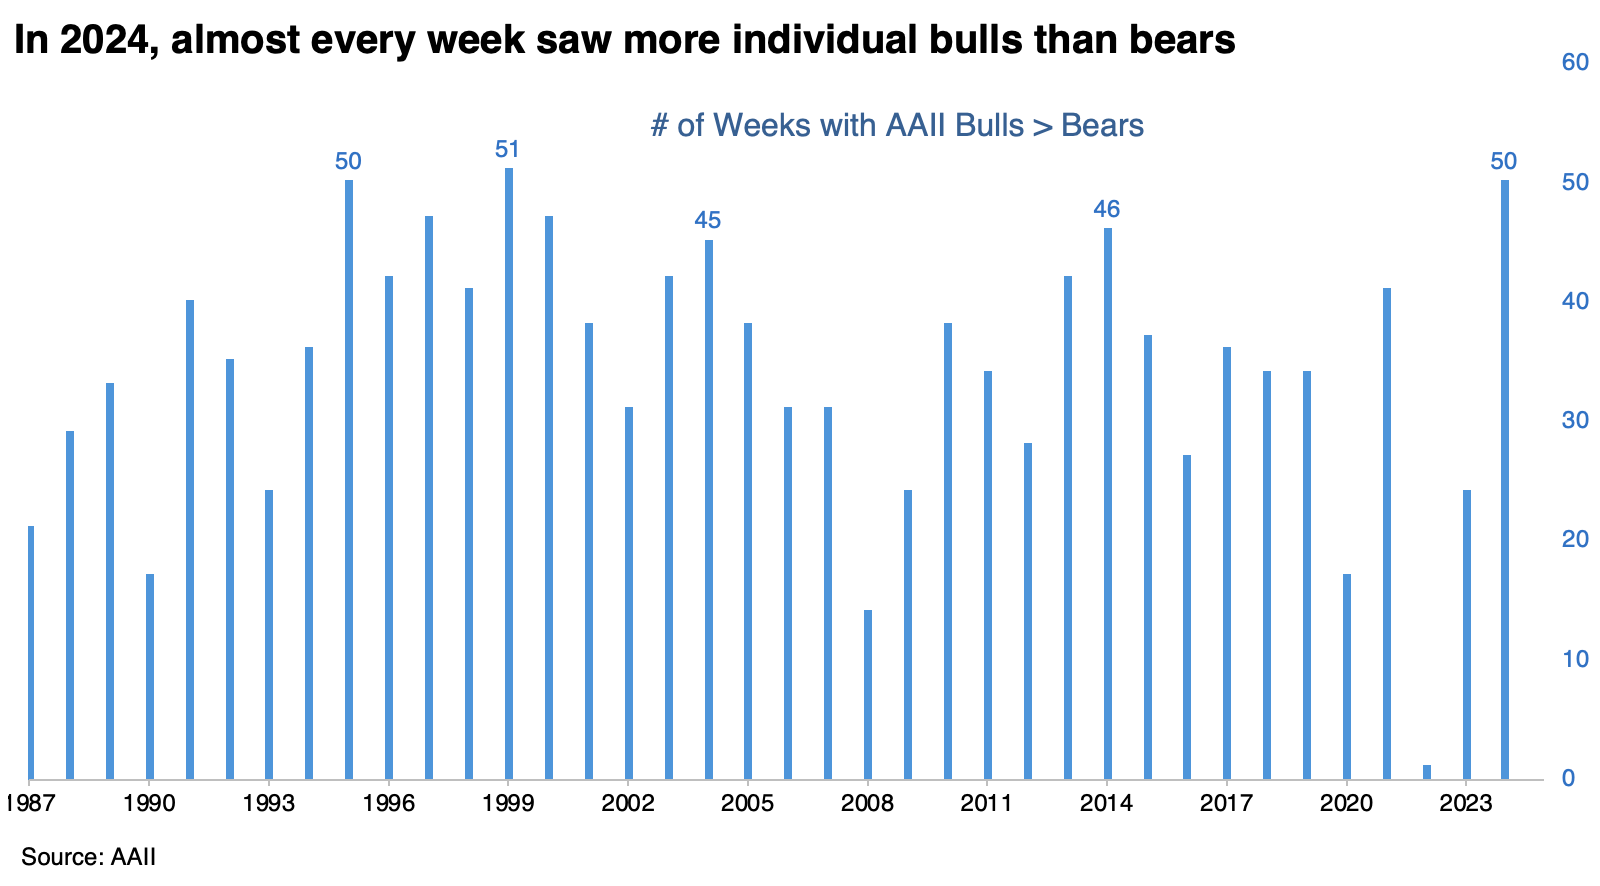
This will go down as a year with among the most bullish sentiment since the 1987 inception of the AAII survey. The only two years with more consistent optimism were 1995 and 1999. The former had a rough couple of weeks to start the new year before booming, while the latter had a rough time overall.
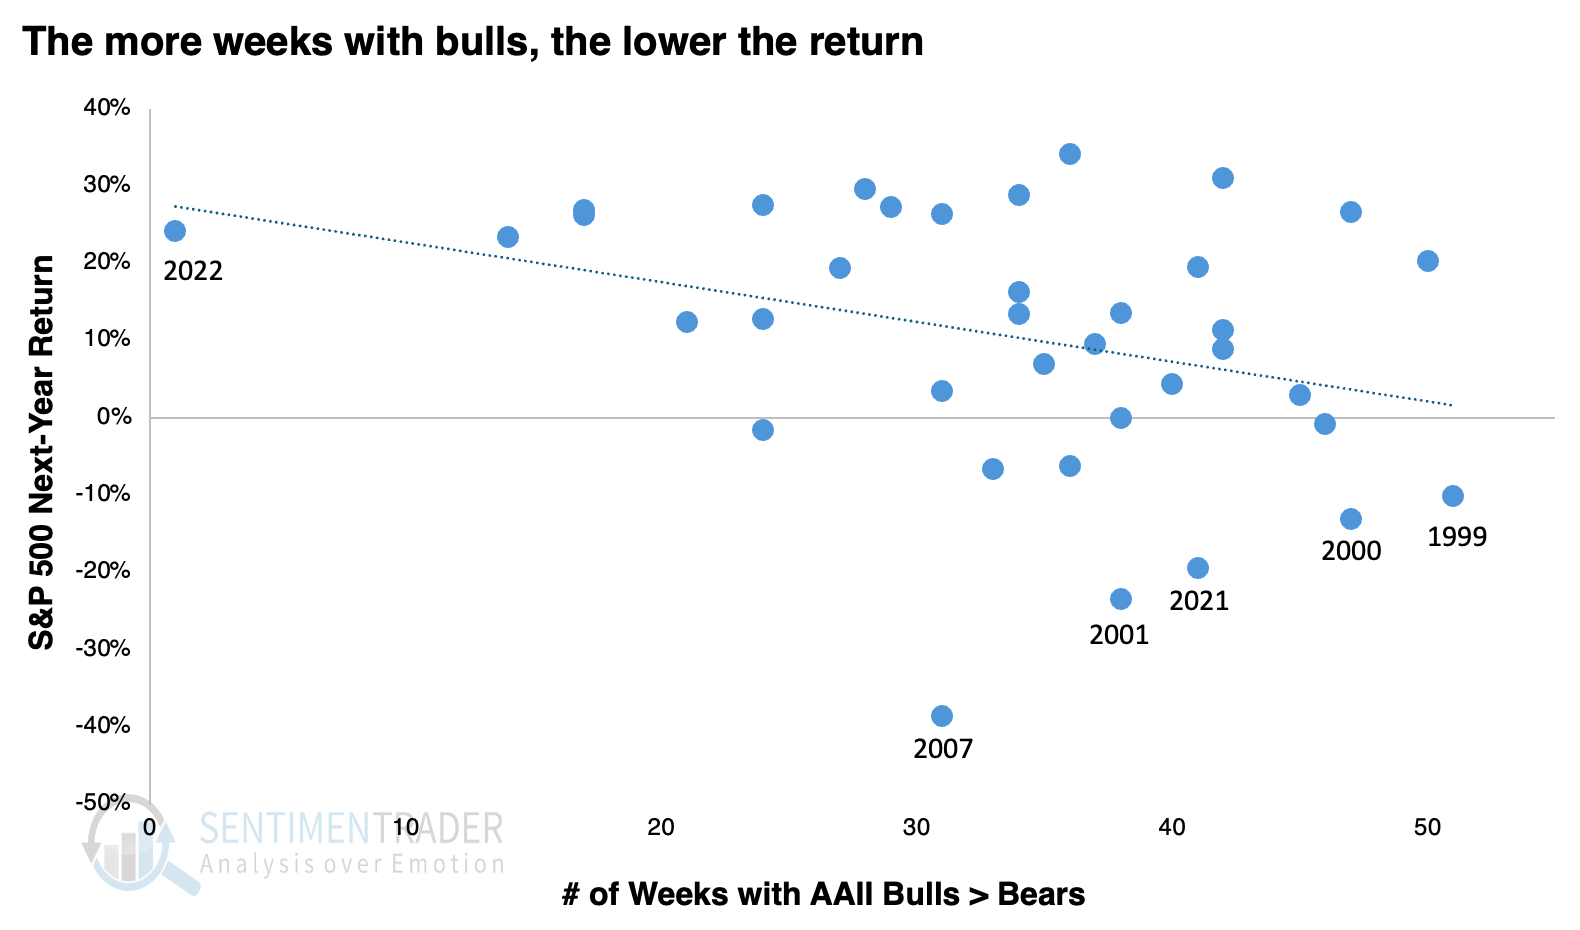
The scatter plot below shows the number of weeks in a year with more bulls than bears, referenced against the S&P 500's return over the following year. The blue dotted line shows a negative correlation, so the more weeks with bullish sentiment, the poorer next year's return.
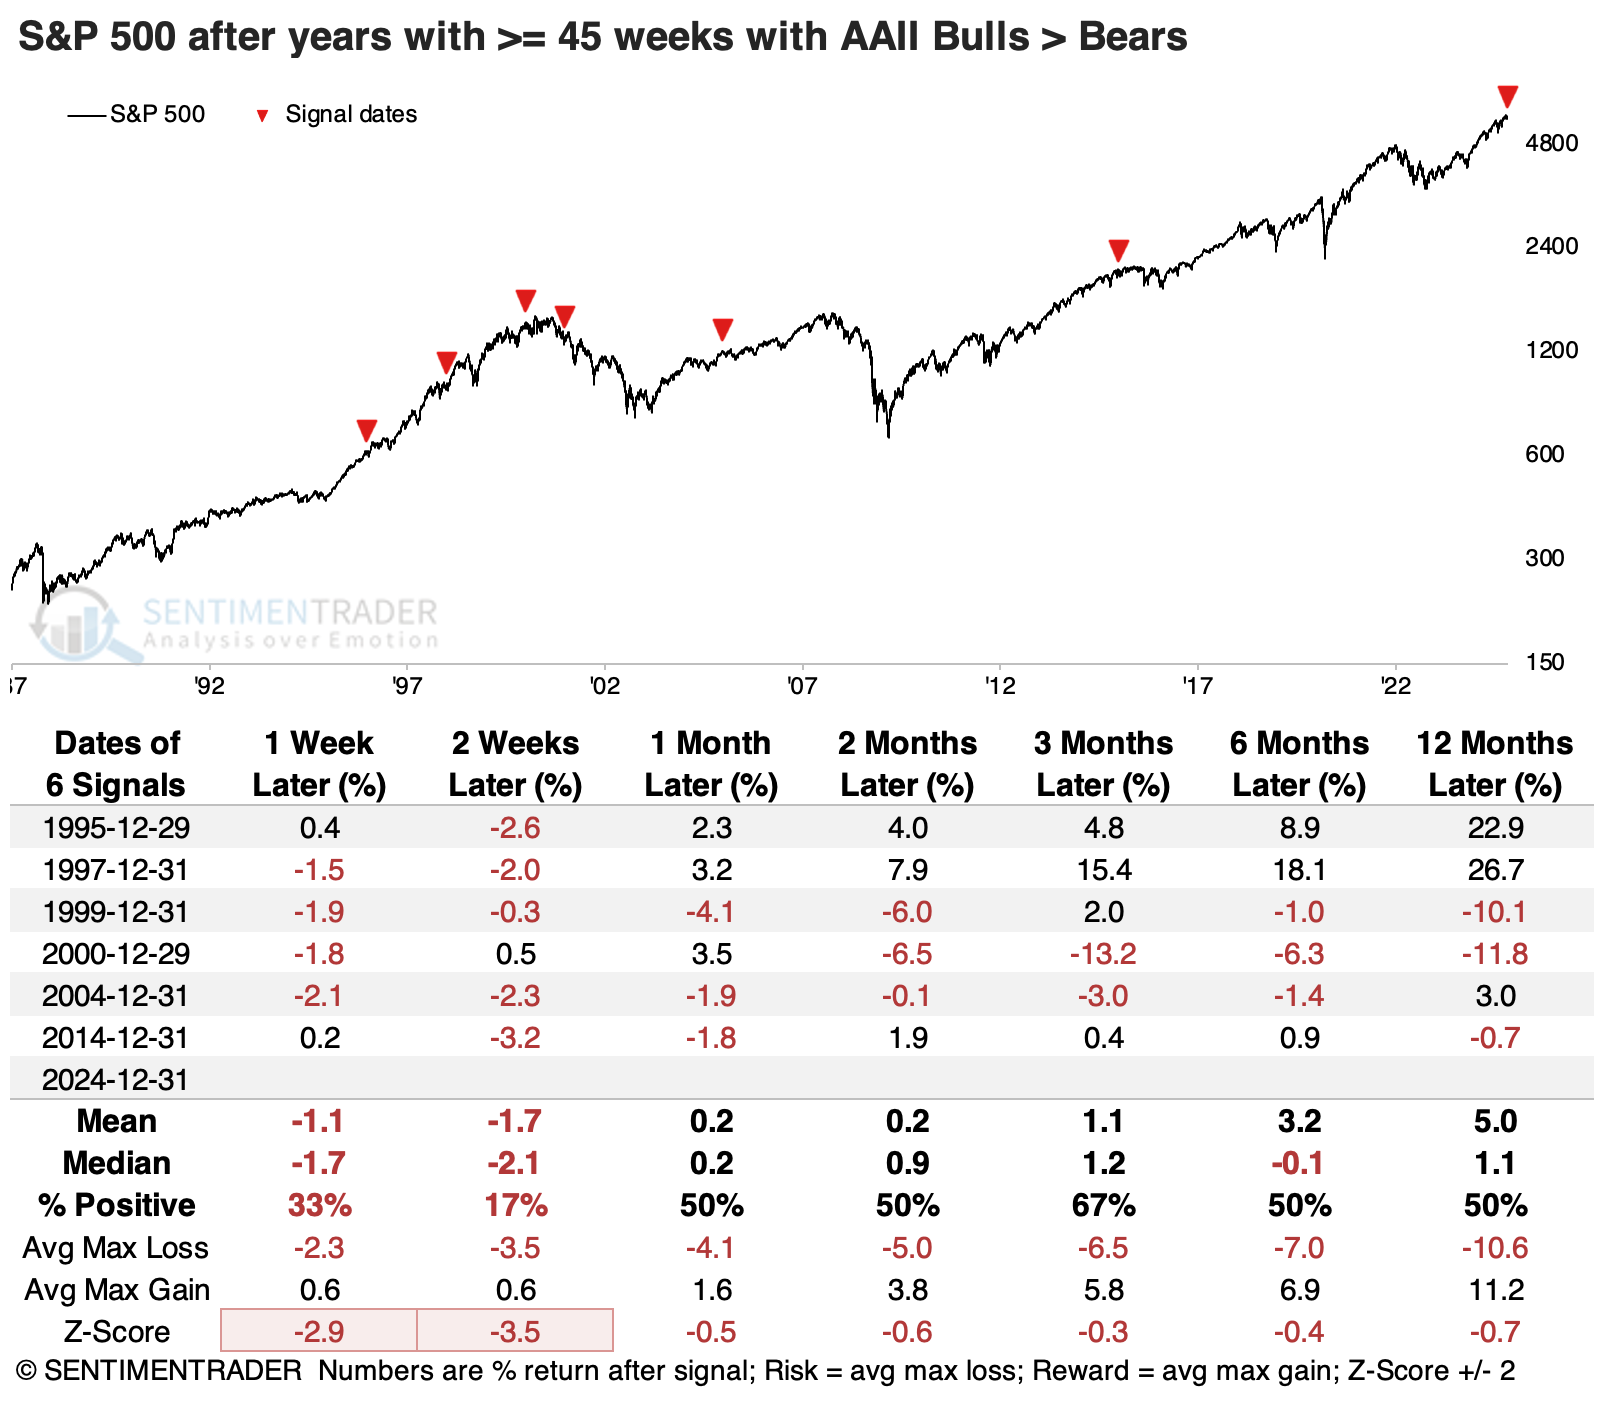
After any year with at least 45 weeks of net bullish sentiment in the AAII survey, the S&P 500 tended to suffer weakness during the first couple of weeks of the new year. The one year that didn't show weakness ended up giving all its gains back, and then some - it was the peak of the internet bubble.
After five of the years, next-year returns were poor, while two turned themselves around and ended up with excellent gains.
Going back further with a different population
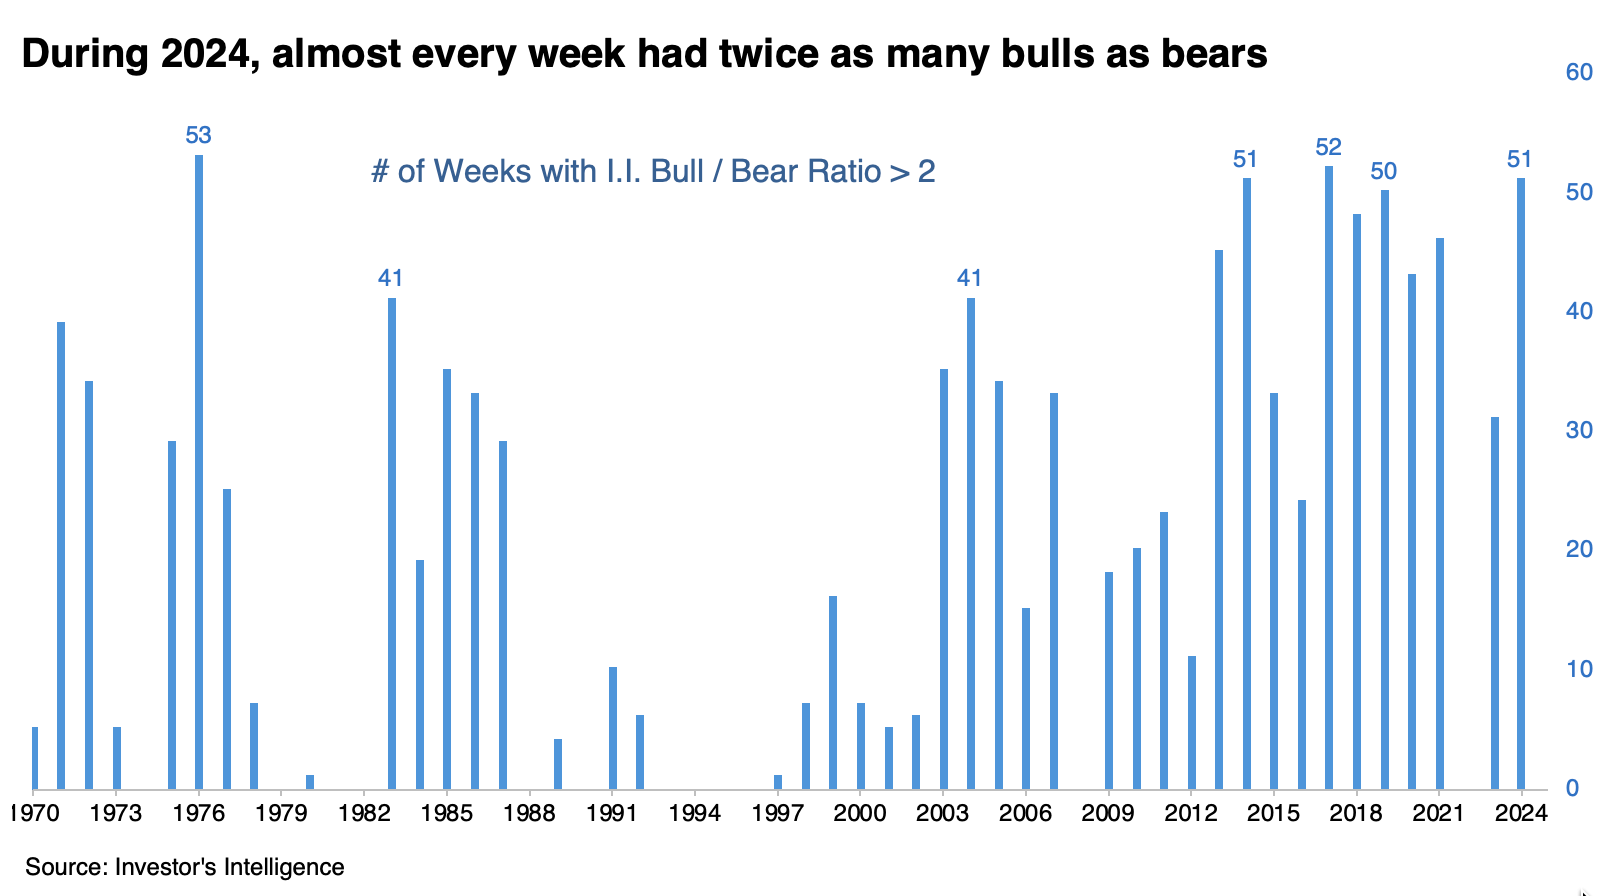
The Investor's Intelligence survey of newsletter writers goes back more than a decade. While it doesn't necessarily sample the same population, the overlap between the two surveys is consistent. In that survey, we'll likely see twice as many bulls as bears for more than 50 weeks this year.
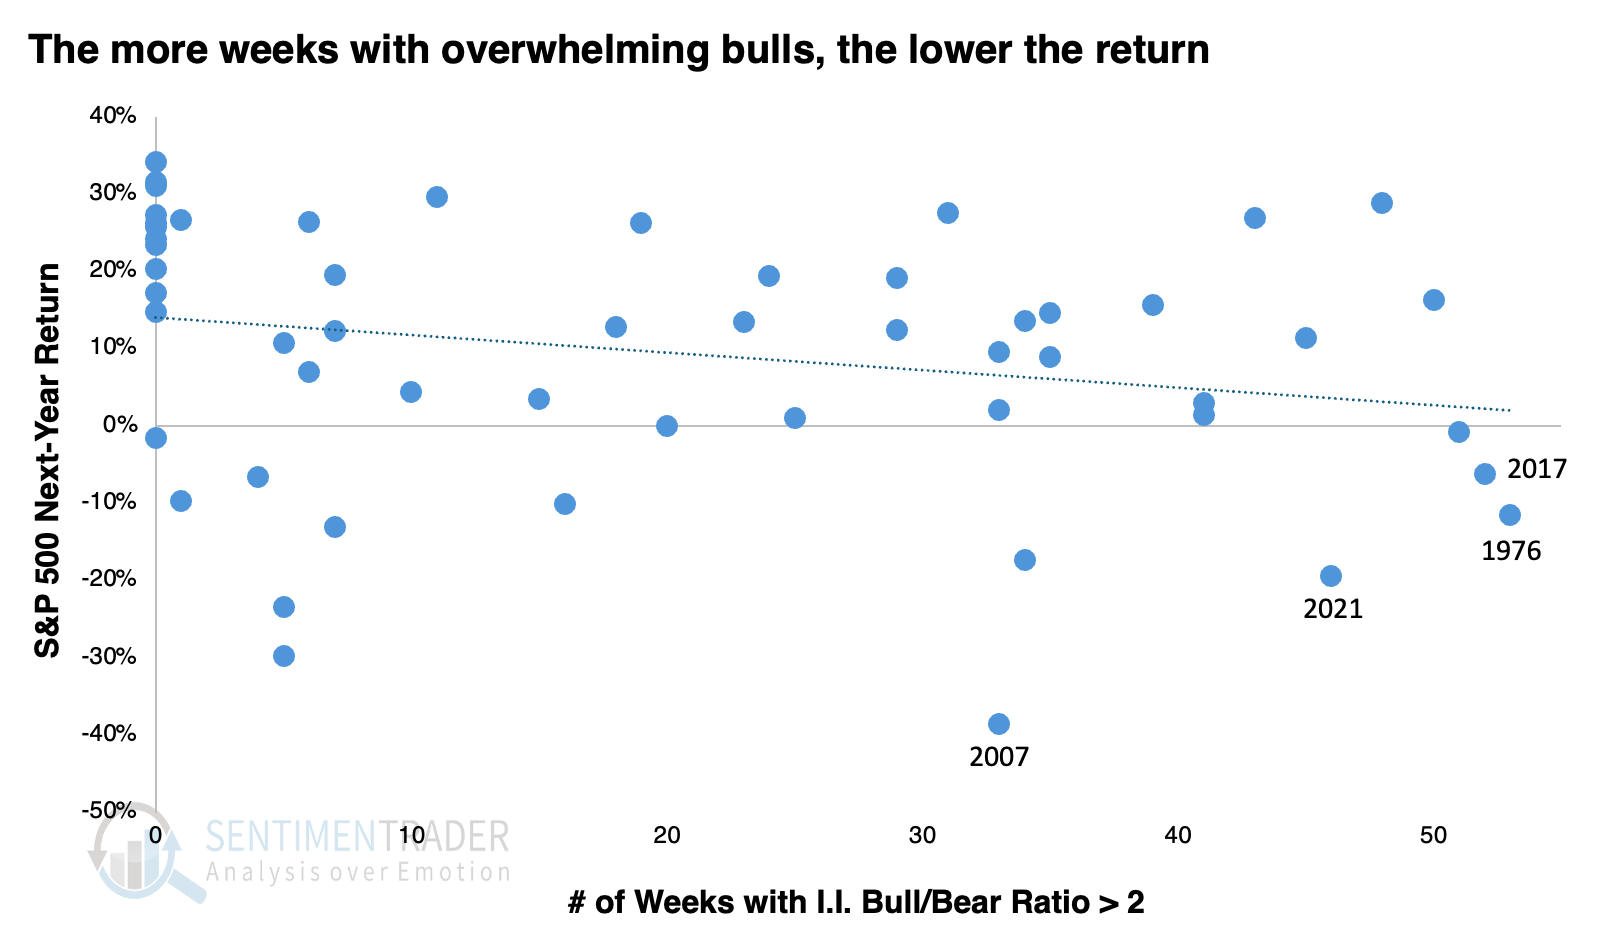
This scatter plot, too, shows a negative relationship between the number of weeks in a year with twice as many bulls as bears and the S&P's return over the following year. It's not a super-strong correlation, but the trend is pretty clear.
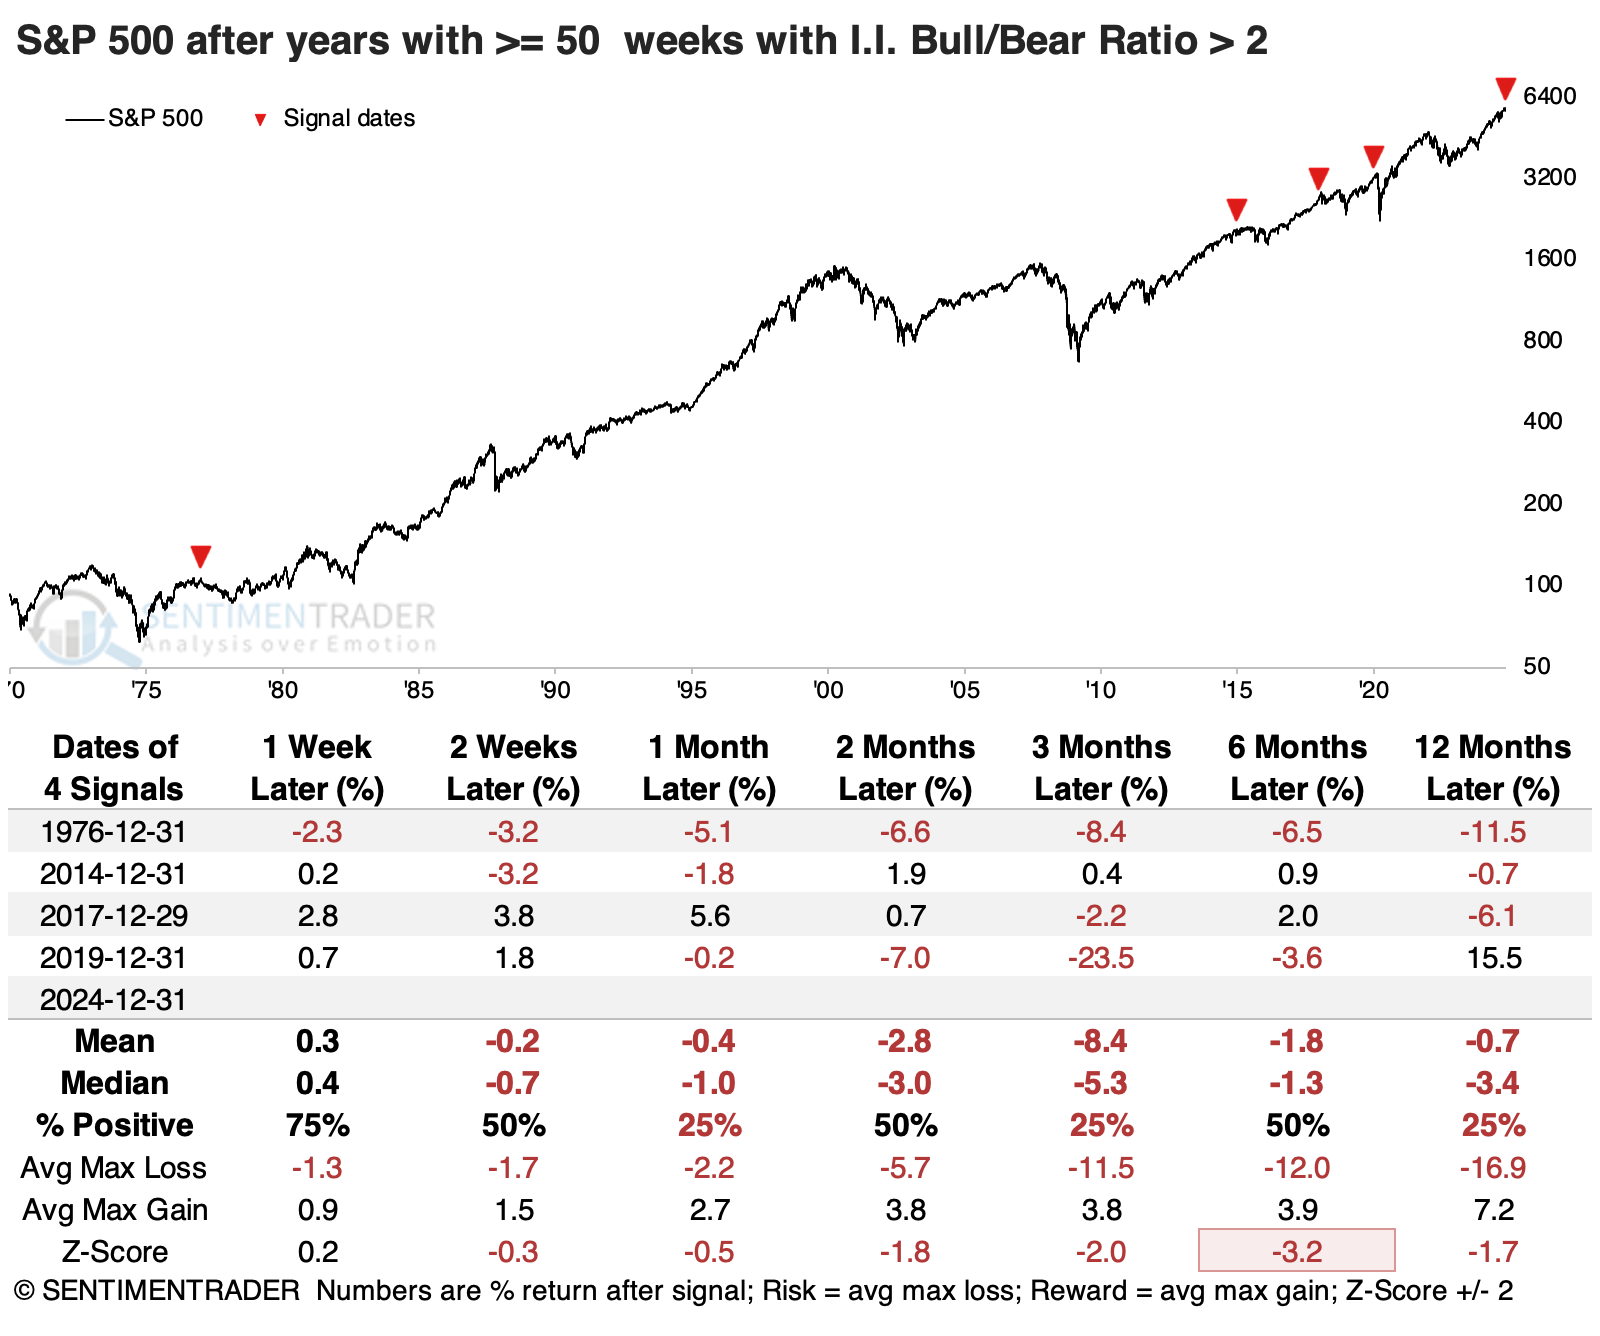
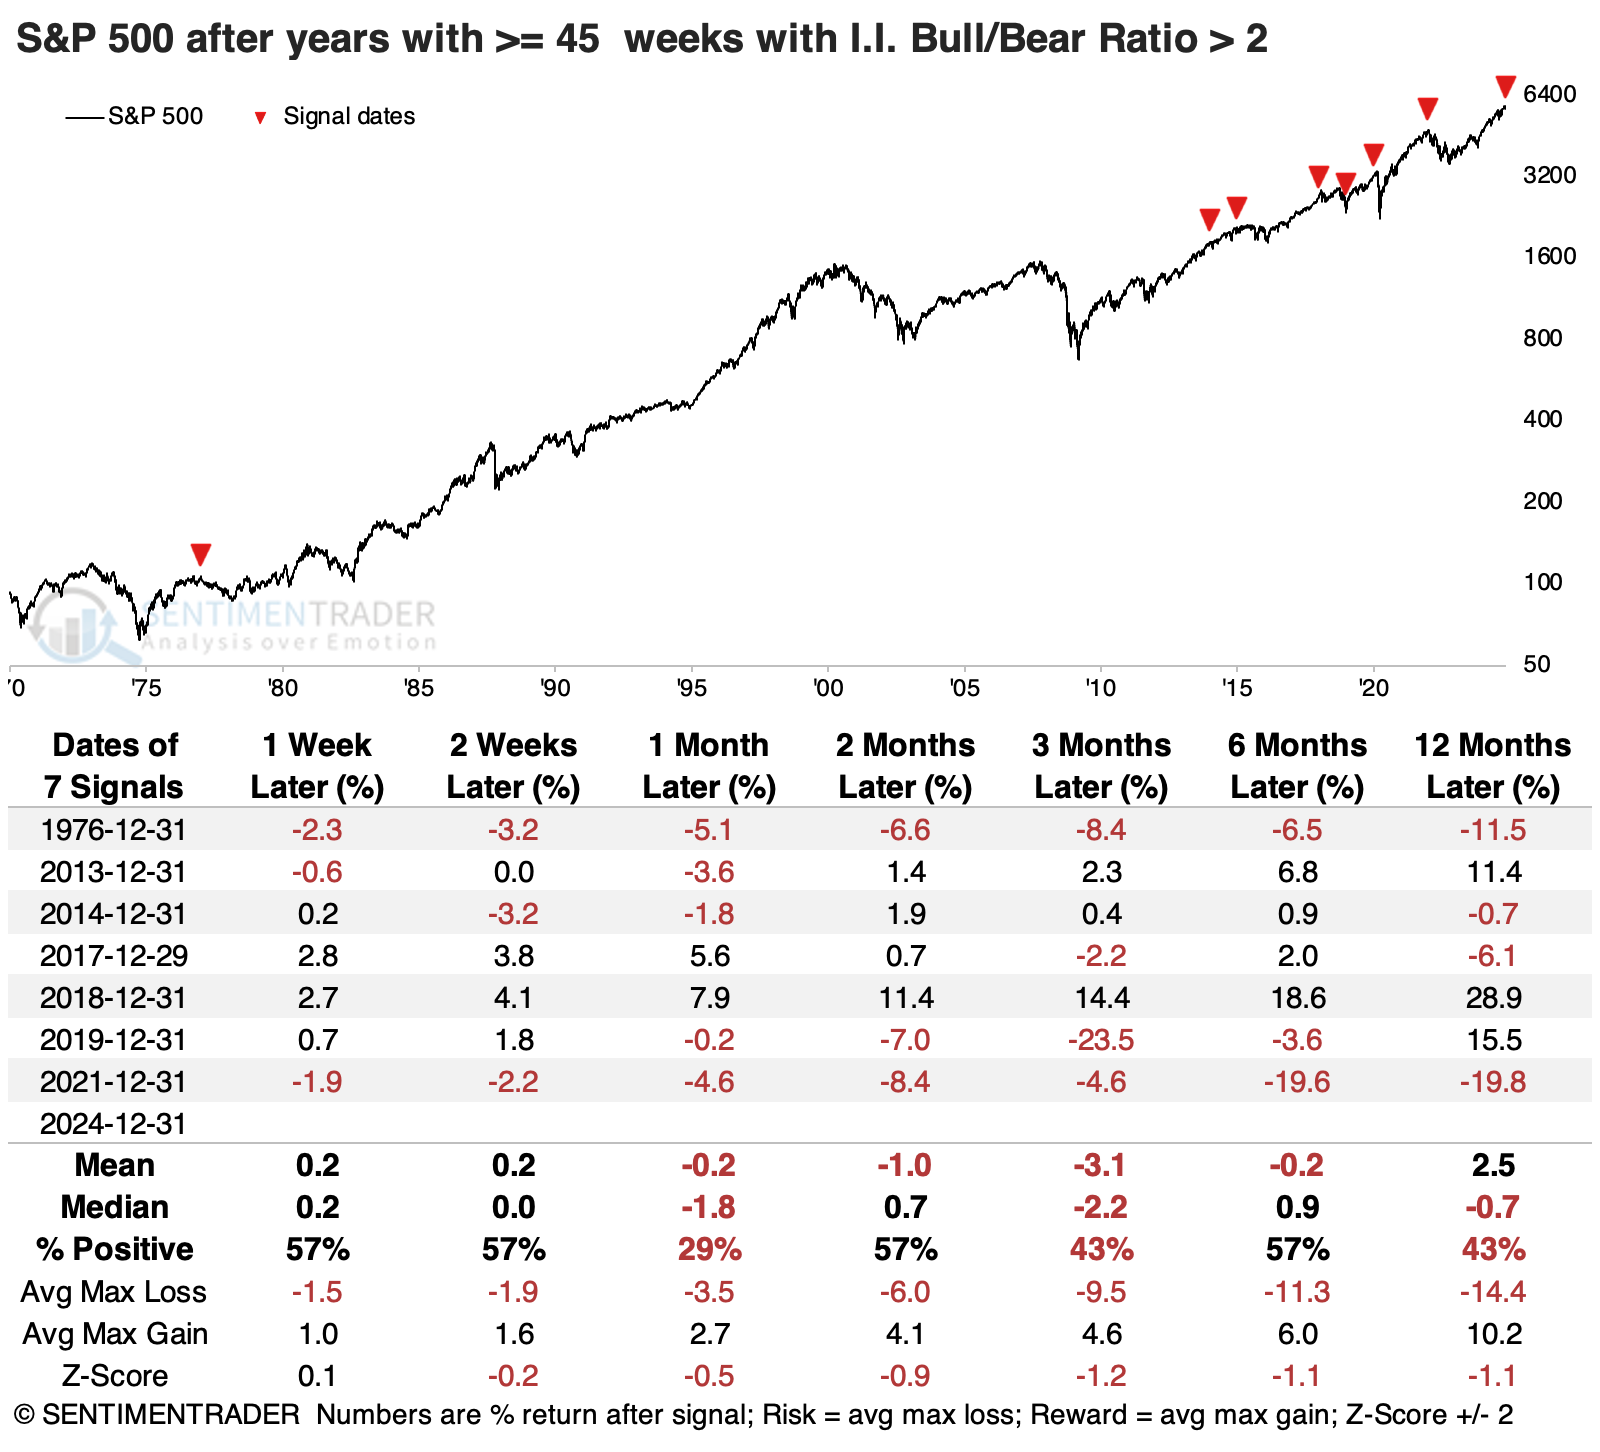
The table below shows every year with at least 50 weeks with twice as many bulls as bears. All of them showed losses in the S&P 500 either six or twelve months later.
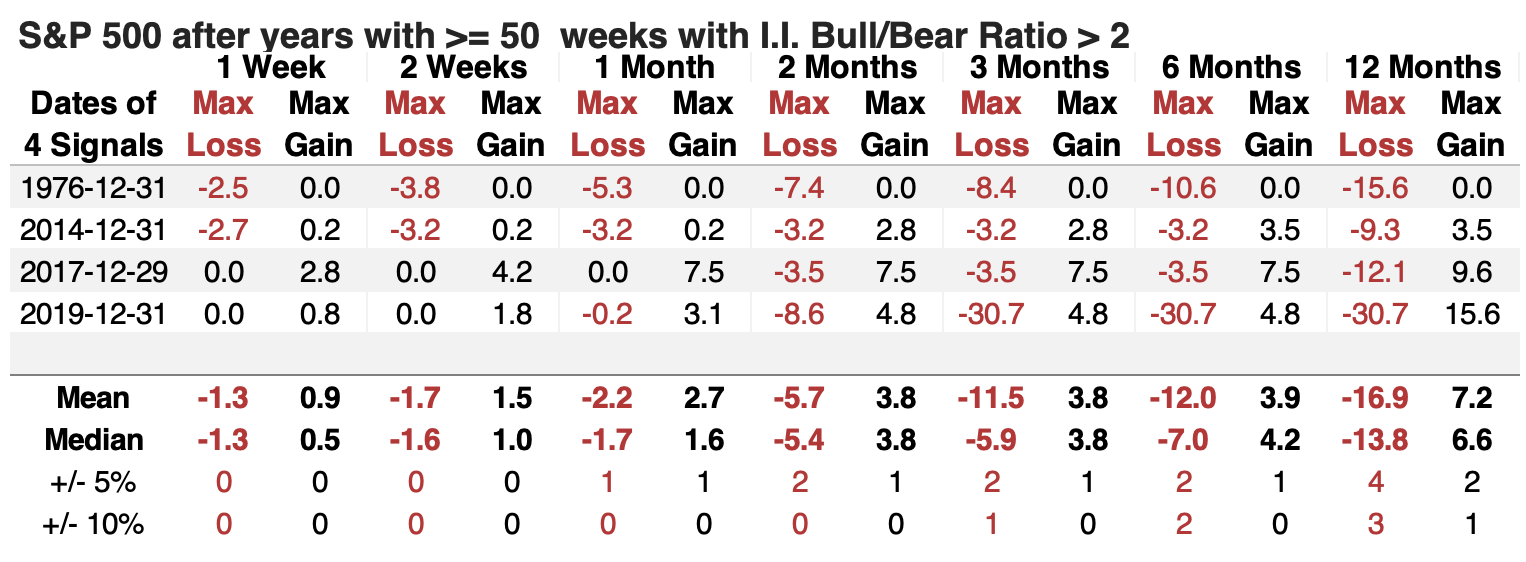
The table of maximum gains and losses across time frames shows that all the signals suffered more risk than reward over the following year.
There are a few more precedents if we relax the parameters to 45 weeks of extreme bullishness during a calendar year. Even so, only two (2013 and 2018) enjoyed more reward than risk over the following year.
What the research tells us...
One of the hallmarks of market bubbles is that investors generally acknowledge a market is overvalued but expect prices to rise anyway. That's where we are today (though it's worth noting that other signs of a bubble are missing).
There is little dispute that stocks are currently at some of the highest valuations in history by nearly any metric. That fact isn't dampening investor appetite, in fact it seems to be encouraging it. Just in the past month, we've seen record fund inflows (BofA), mainstream financial media suggesting 100% stock allocations (MarketWatch), another 20% gain next year (Barron's), putting everything in the U.S. (Economist), and riches gained by young men in the most speculative assets (WSJ). We've seen asset managers suggesting the business cycle has been defeated (BlackRock), perma-bears turning bullish (Rosenberg), and new financial products based on near-record low credit spreads. Taken together, it's a bright, flashing red light.
The history of momentum-heavy markets, however, is that a surprisingly large amount of money is not only willing to ignore but also chase these trends. So, markets rarely peak quickly. They dip and rise and meander and the signs keep piling up until they all come home to roost in a "surprisingly" quick fashion; short-term gains tend to get wiped out during the subsequent pullback. It's worth remembering those historical lessons in the weeks and perhaps even months to come.