
A wrenching switch in defensive sectors' relative returns

Key points:
- Consumer staples, health care, and the equal-weighted S&P 500 enjoyed historic relative rebounds
- These giant moves tended to lead to even more gains over long time frames
- Their strength was improved after years of underperforming the market
Investors finally found staples again
In a hyperactive tape, change can happen fast.
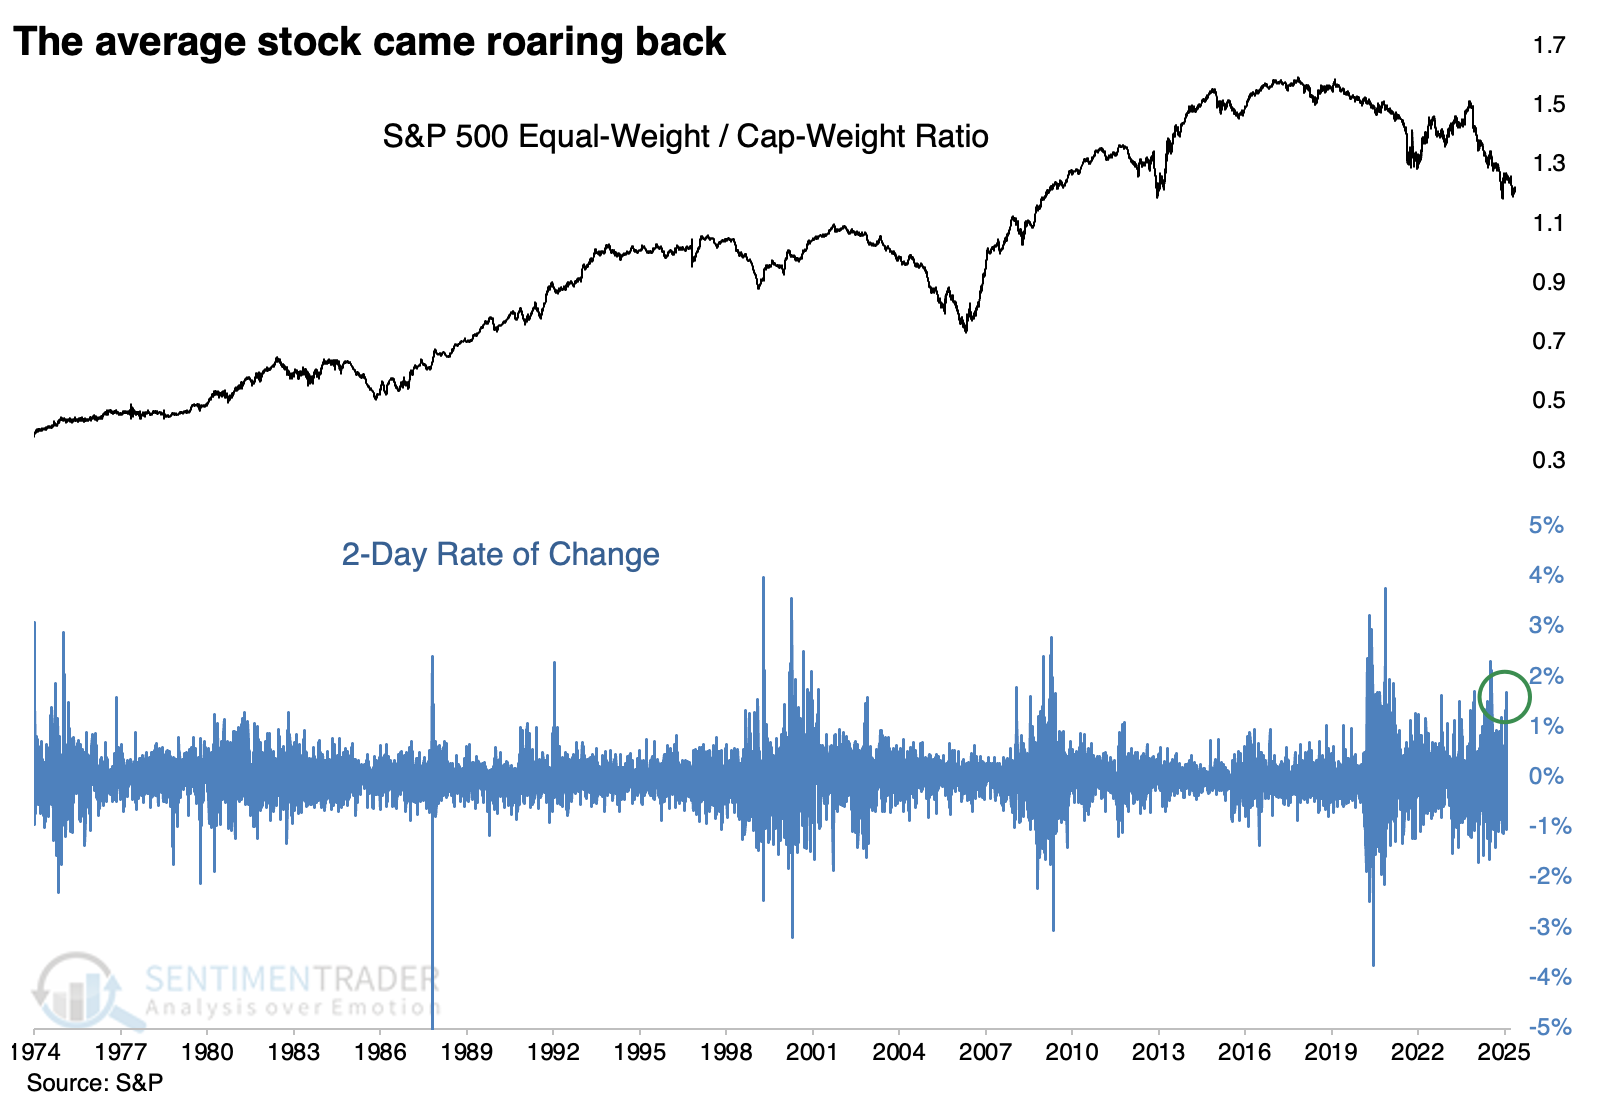
We've looked at the extreme divergence in the equal-weight S&P 500 to the cap-weighted index that most investors follow. We've also seen recent extremes in consumer staples. Those reversed with a vengeance.
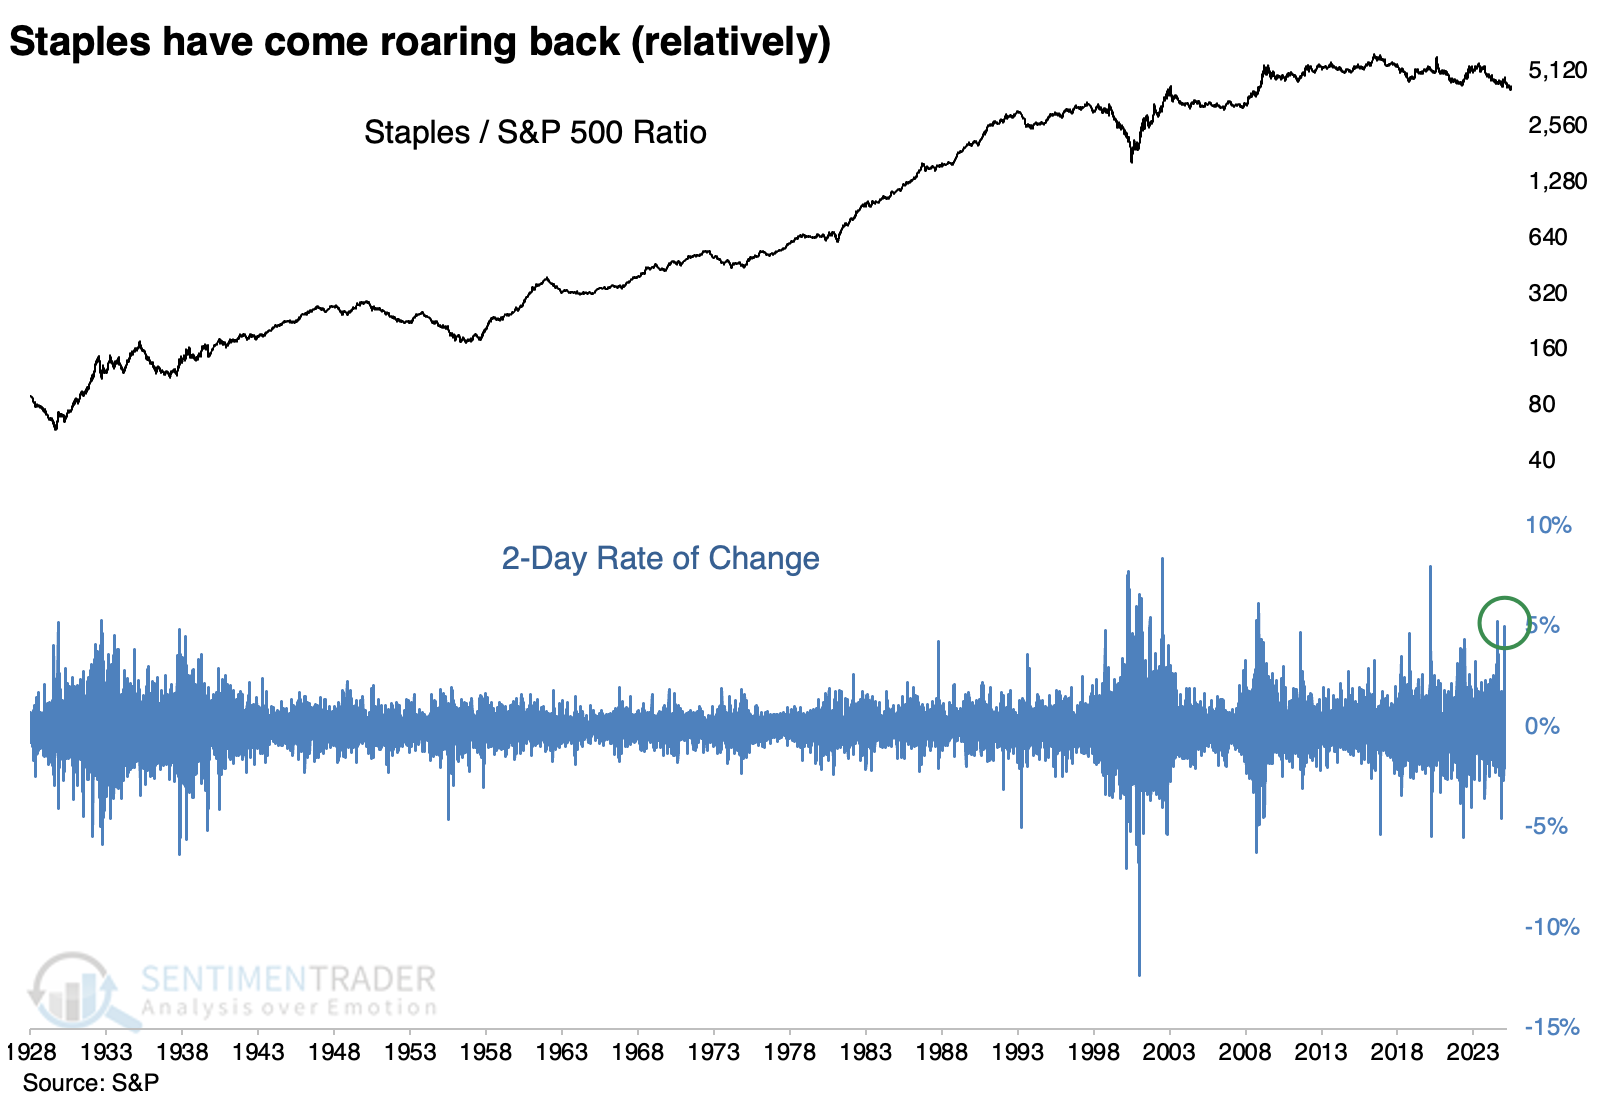
The DeepSeek news threw a wrench into the most lopsided trade in markets on Monday, with many leading stocks getting hit by the worst selling in years. It was one of the oddest sessions in history because most other stocks were unaffected and performed just fine on the day, especially those in the beaten-down consumer staples.
That sector outperformed the S&P 500 by nearly 5% over two days, one of the most significant spikes in outperformance in nearly 100 years. The trend reversed somewhat on Tuesday, but that doesn't necessarily negate the initial shock.
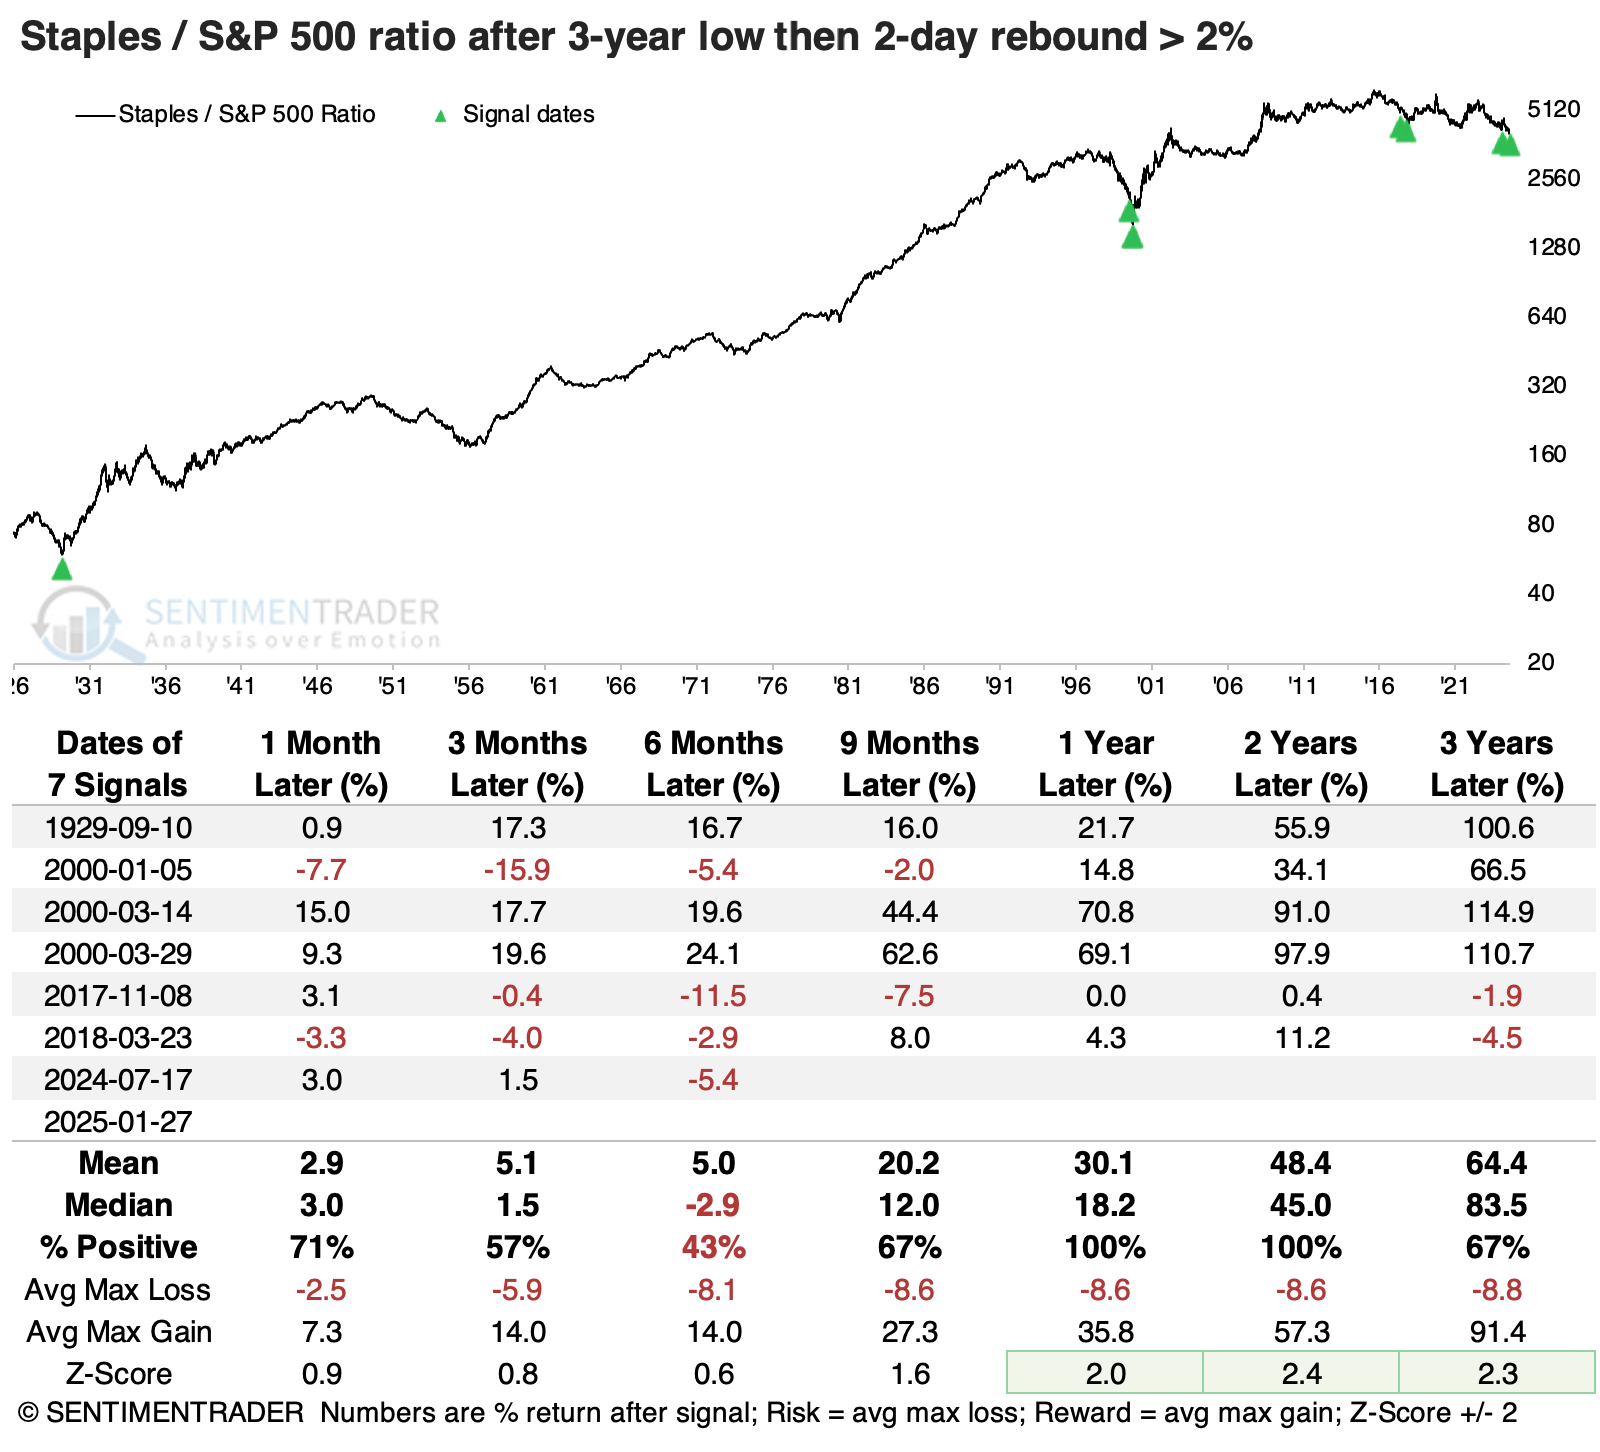
When the ratio between staples and the S&P rebounded by +2% or more over two days, when it had been sitting at a multi-year low, the sector tended to keep outperforming. Over the next one and two years, staples handily outperformed the market without much give-back.
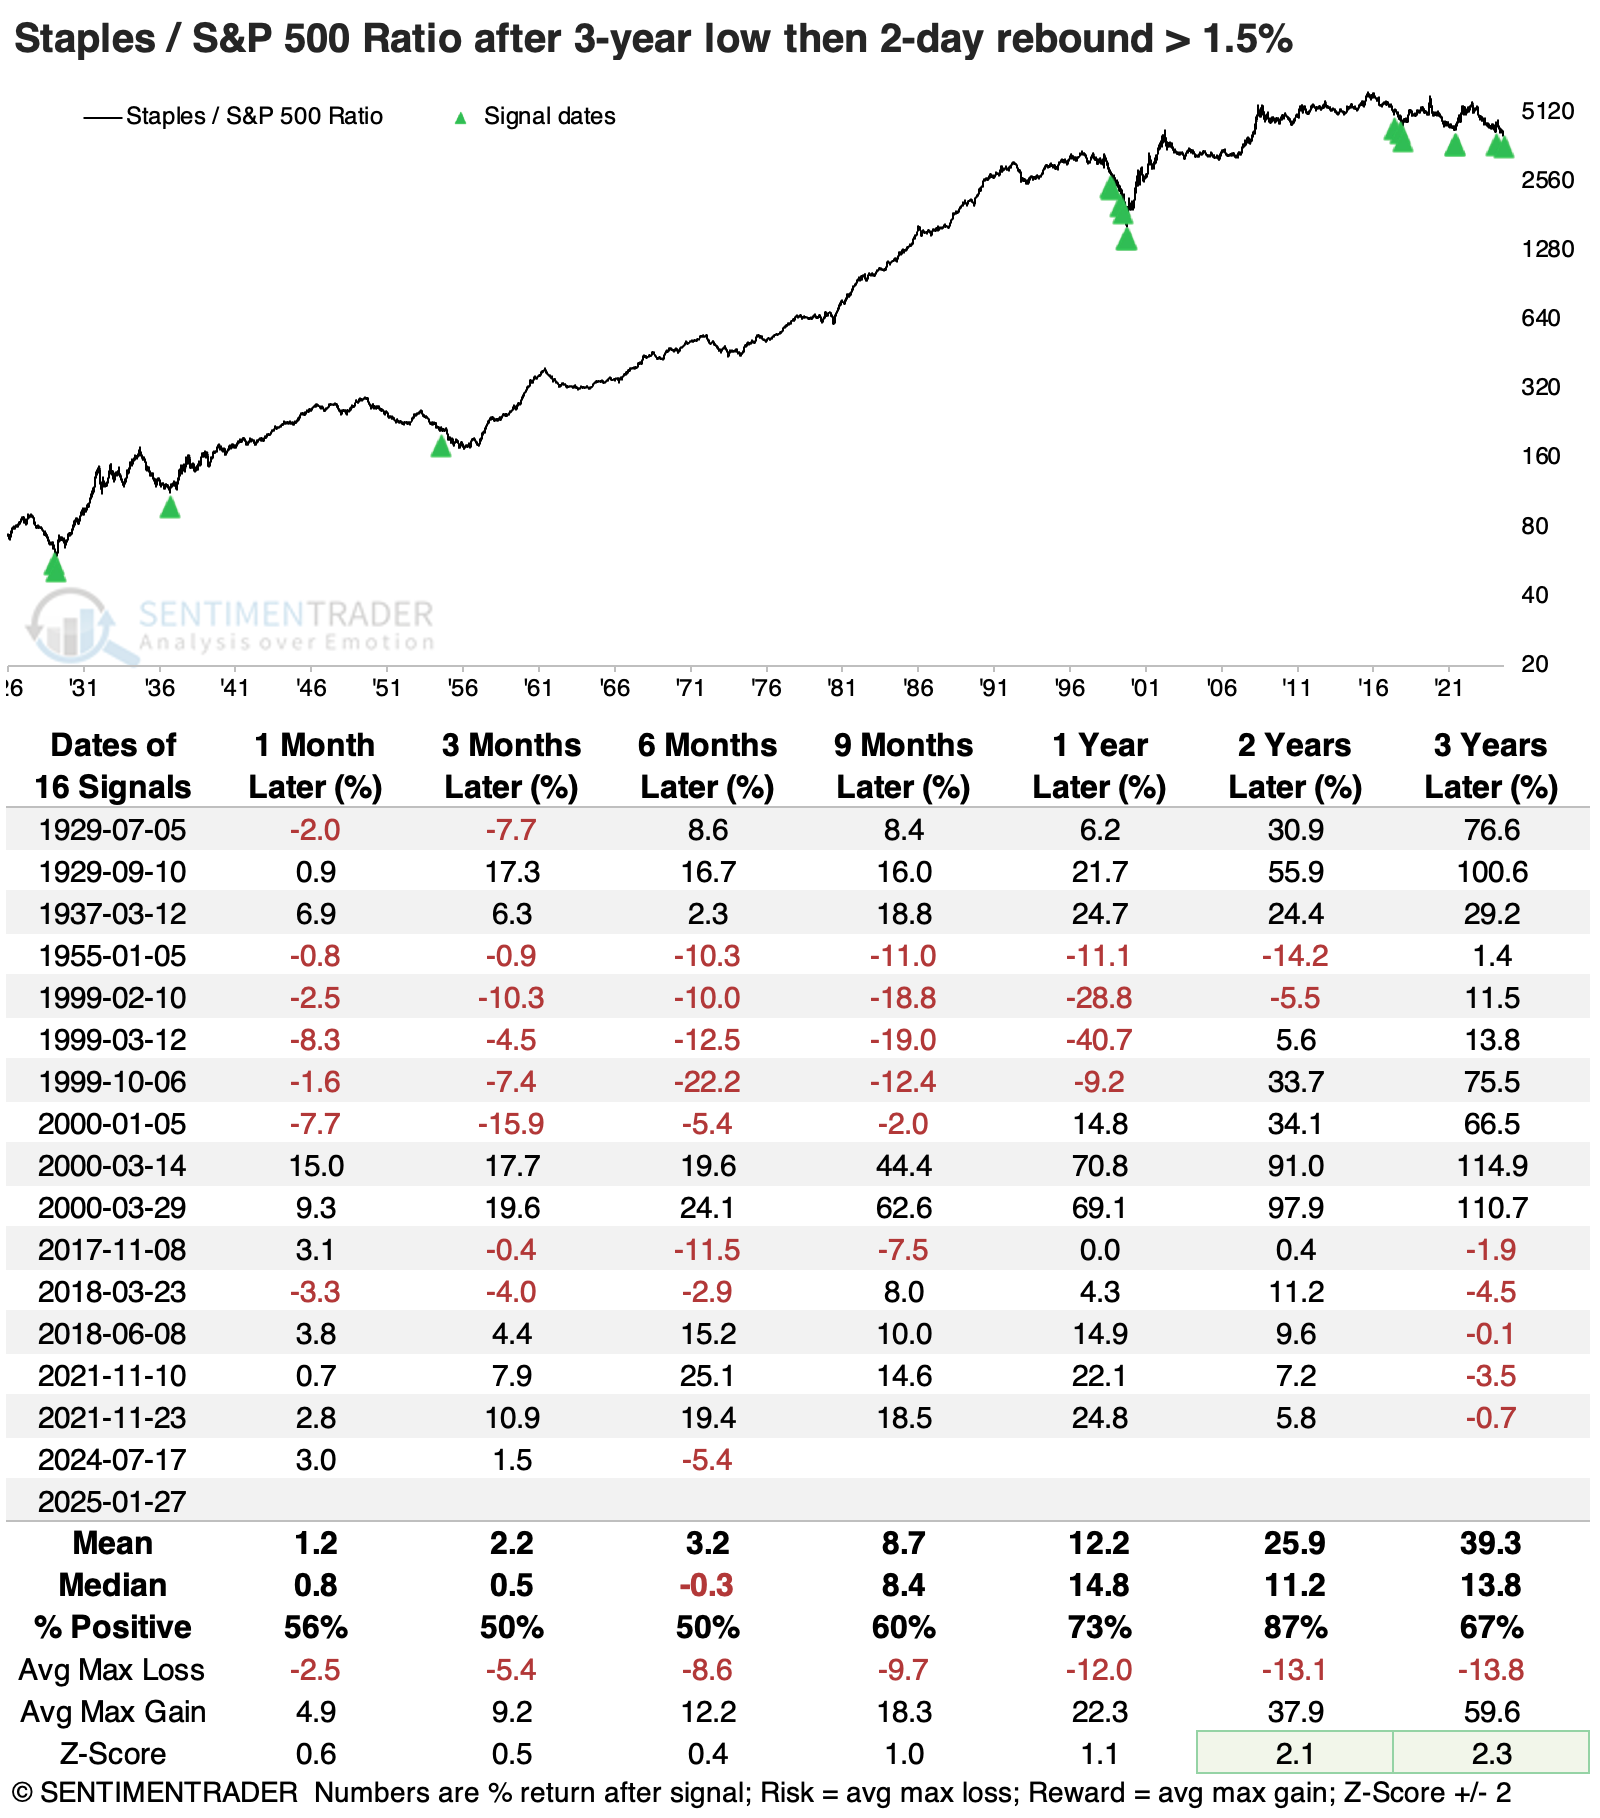
If we relax the parameters to look for a modestly smaller two-day bounce, the sample size more than doubles. These less impressive bounces were too early to call the bottoms in 1955 and 2000, but also added a couple of successful ones.
A healthy move into health care
While health care stocks had recovered more than staples since December, those stocks had also been beaten down in the prior few months. And they, too, rebounded strongly on Monday.
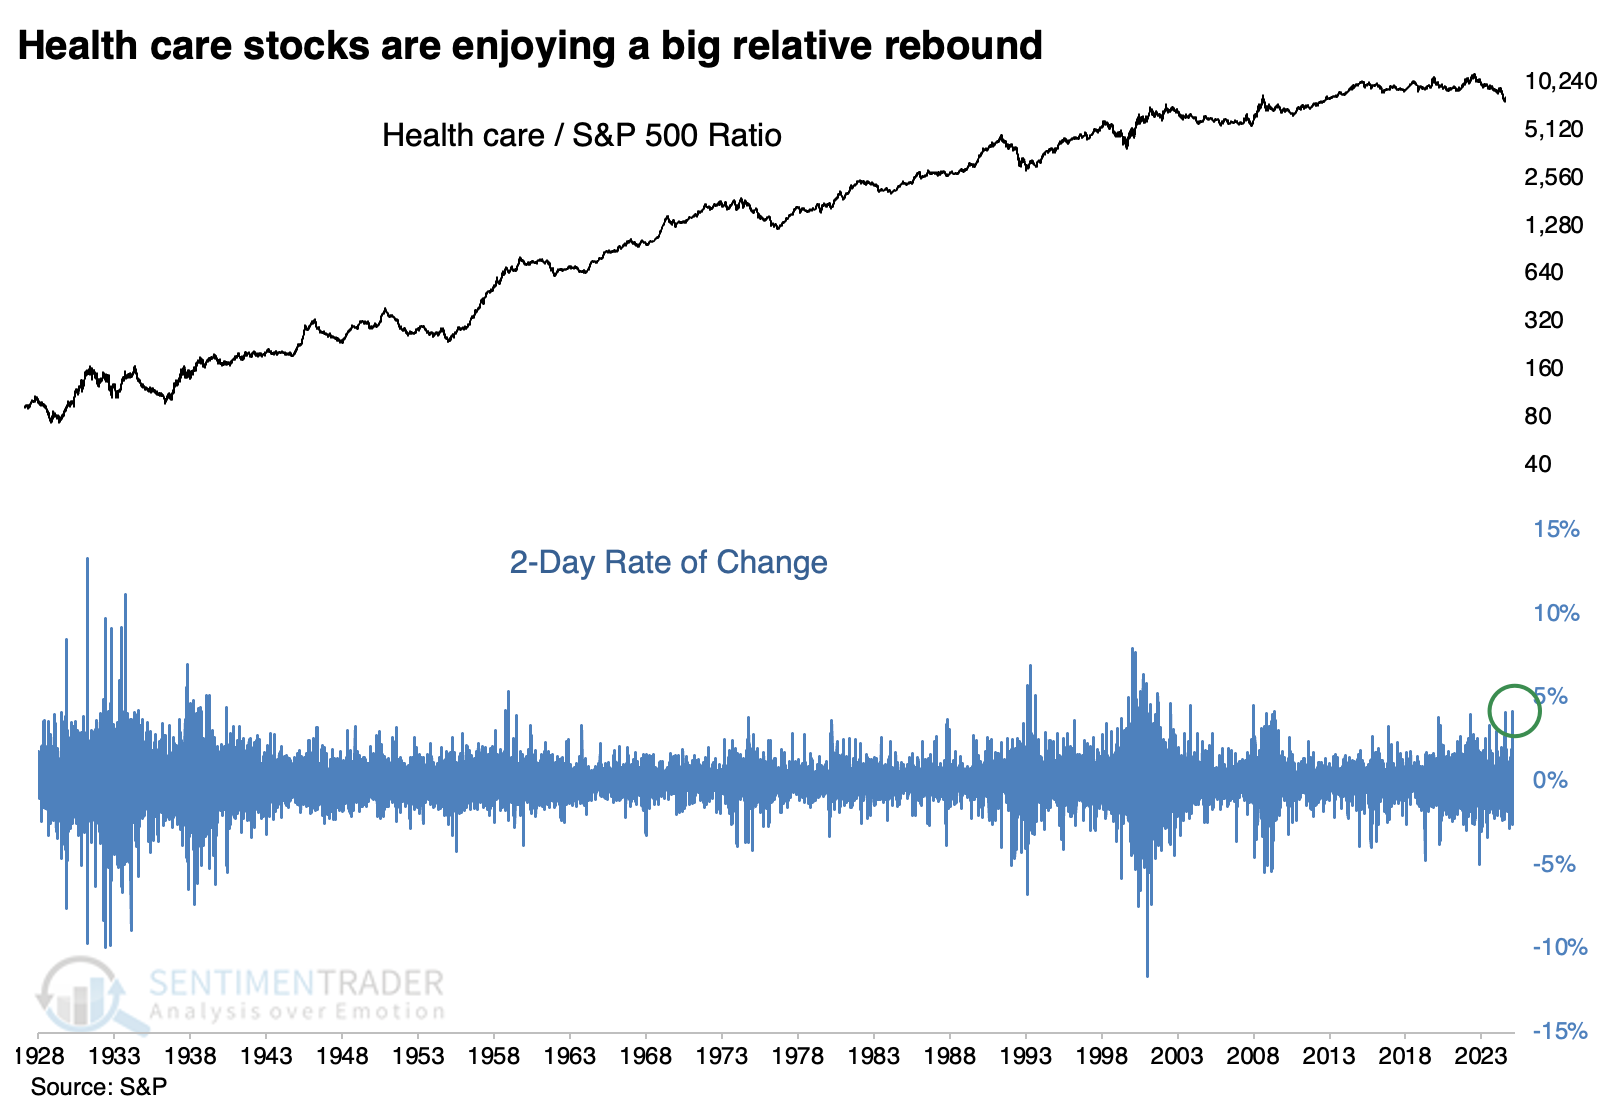
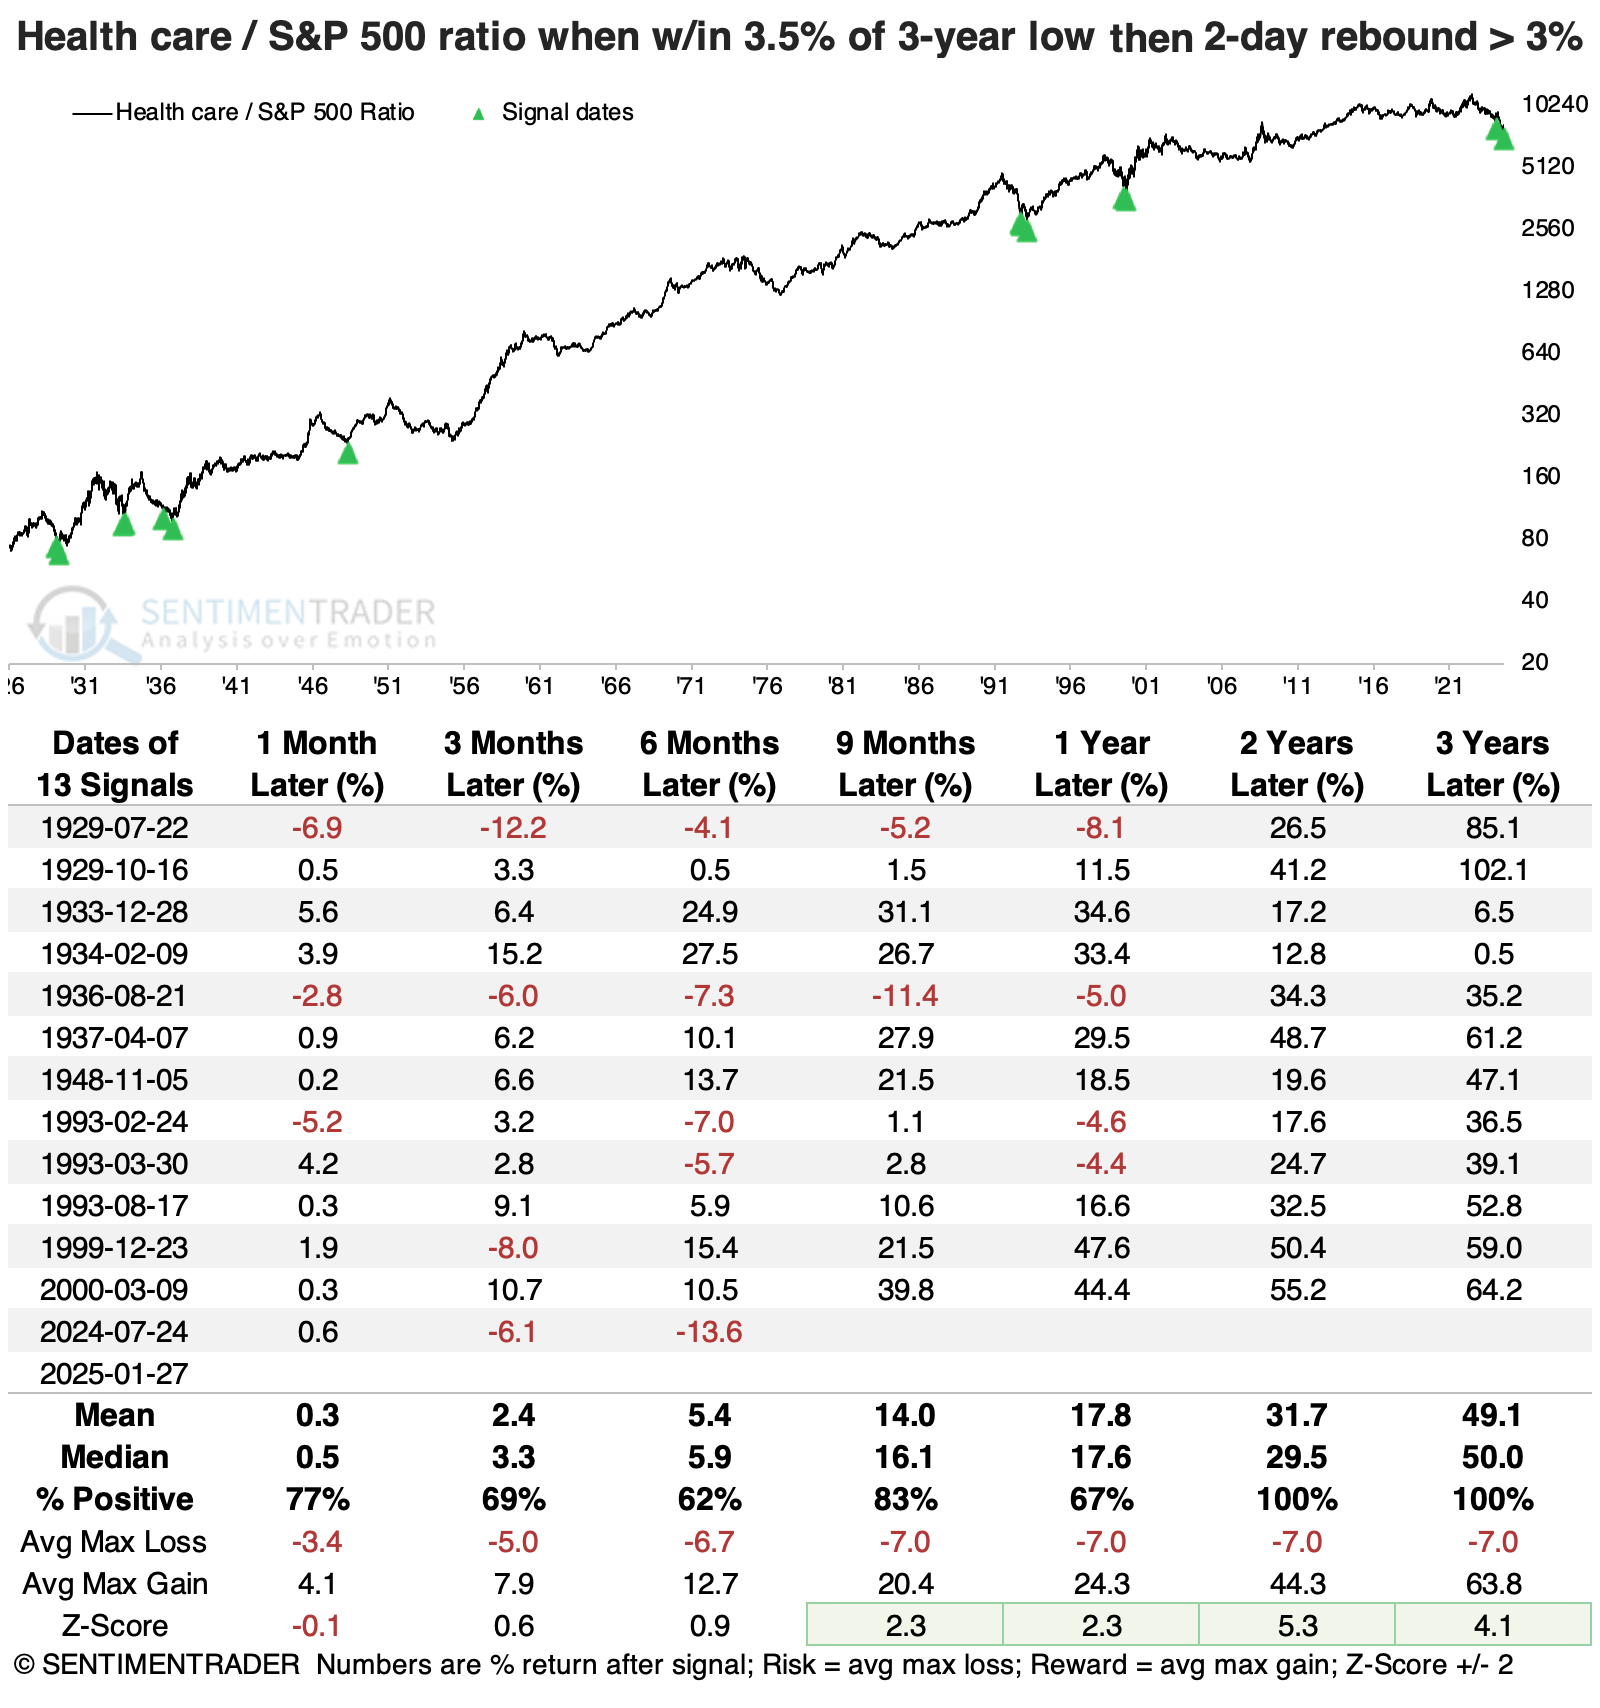
When the ratio of health care stocks to the S&P 500 had been meandering within 3.5% of a multi-year low, then buyers showed an abnormally large interest in piling in, the sector tended to keep outperforming.
These signals were triggered during some of the most important inflection points in the sector's relative fortunes. Over the next 2-3 years, it outperformed the market after every signal, and by an abnormally large amount.
Revenge of the average
Because investors left the mega-cap stocks and gravitated toward everything else, it was one of the best-ever quick rebounds for the average stock relative to the capitalization-weighted S&P 500 index.
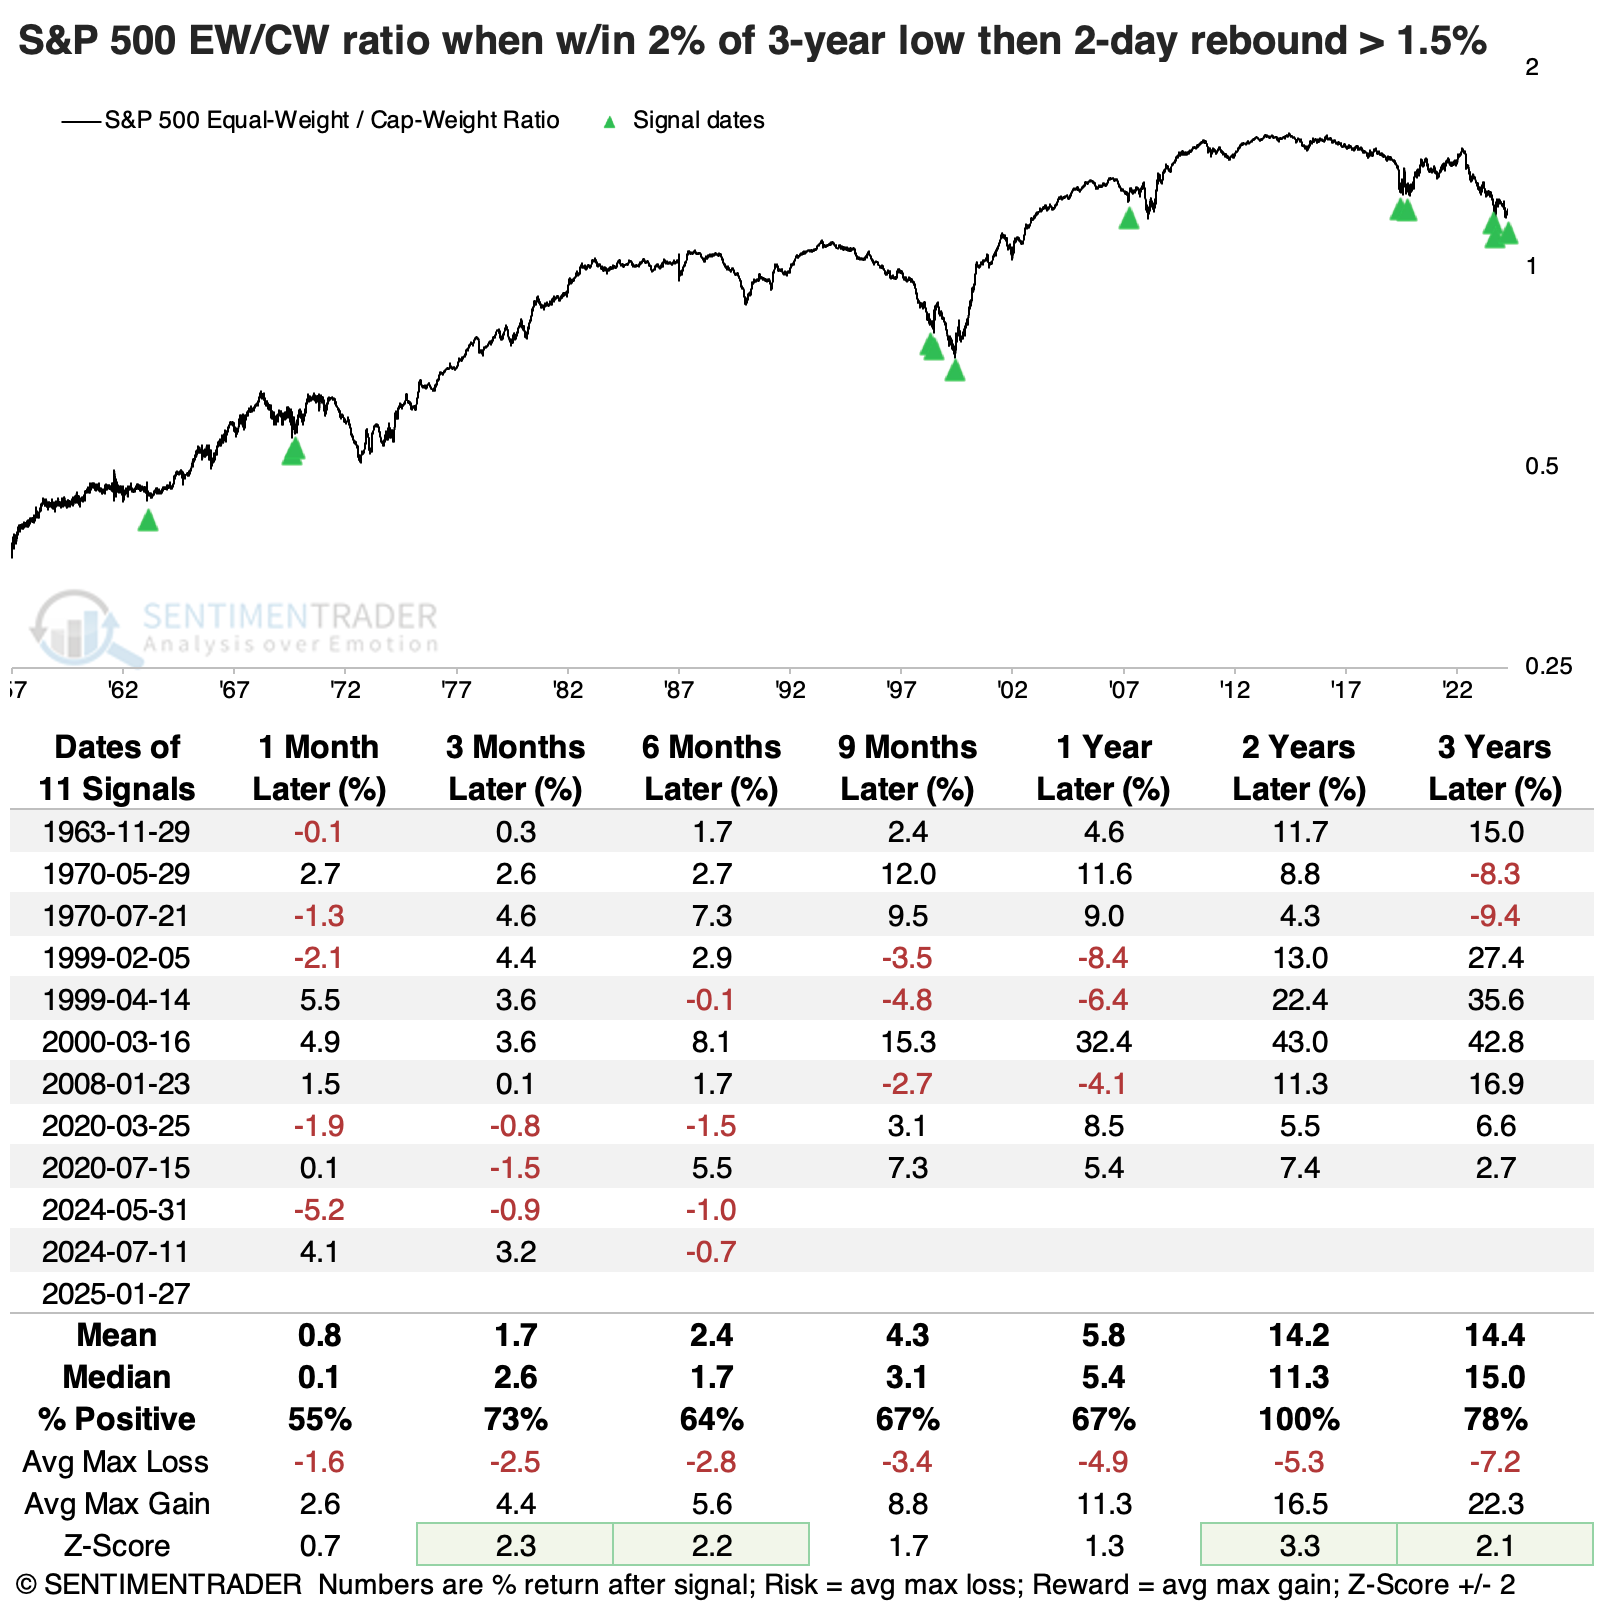
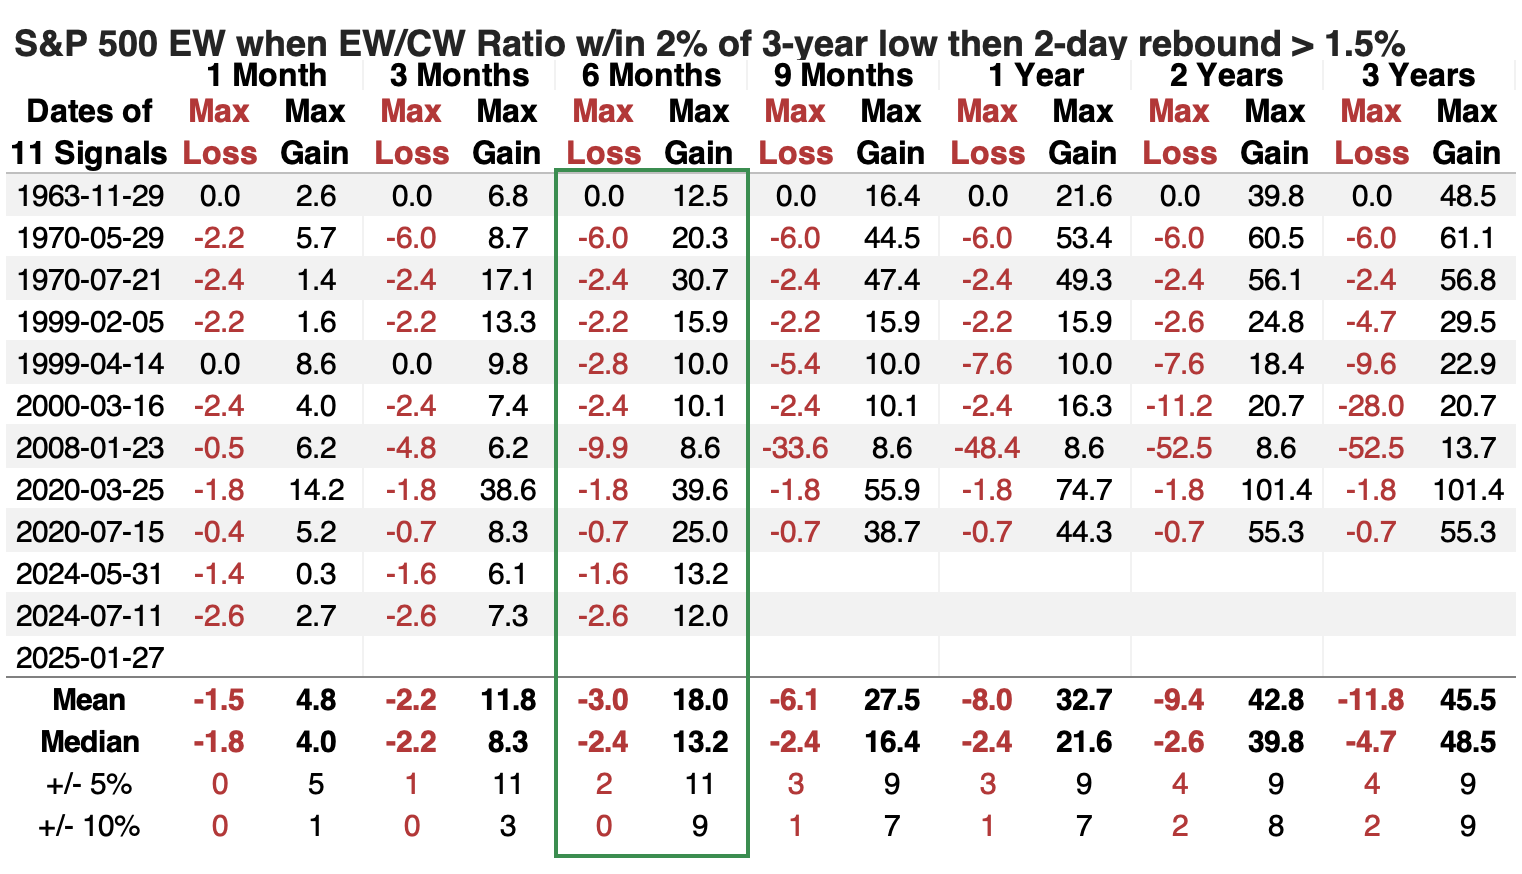
When the ratio of the equal-weighted S&P 500 to the cap-weighted version of the index was within spitting distance of a multi-year low and then enjoyed a large two-day rebound, the equal-weight version of the index outperformed every time over the next two years.
The only terrible signal on an absolute basis triggered as we headed into the global financial crisis. That preceded a gut-wrenching loss in the equal-weight S&P, but it was also the only signal that led to a loss from 9-24 months later.
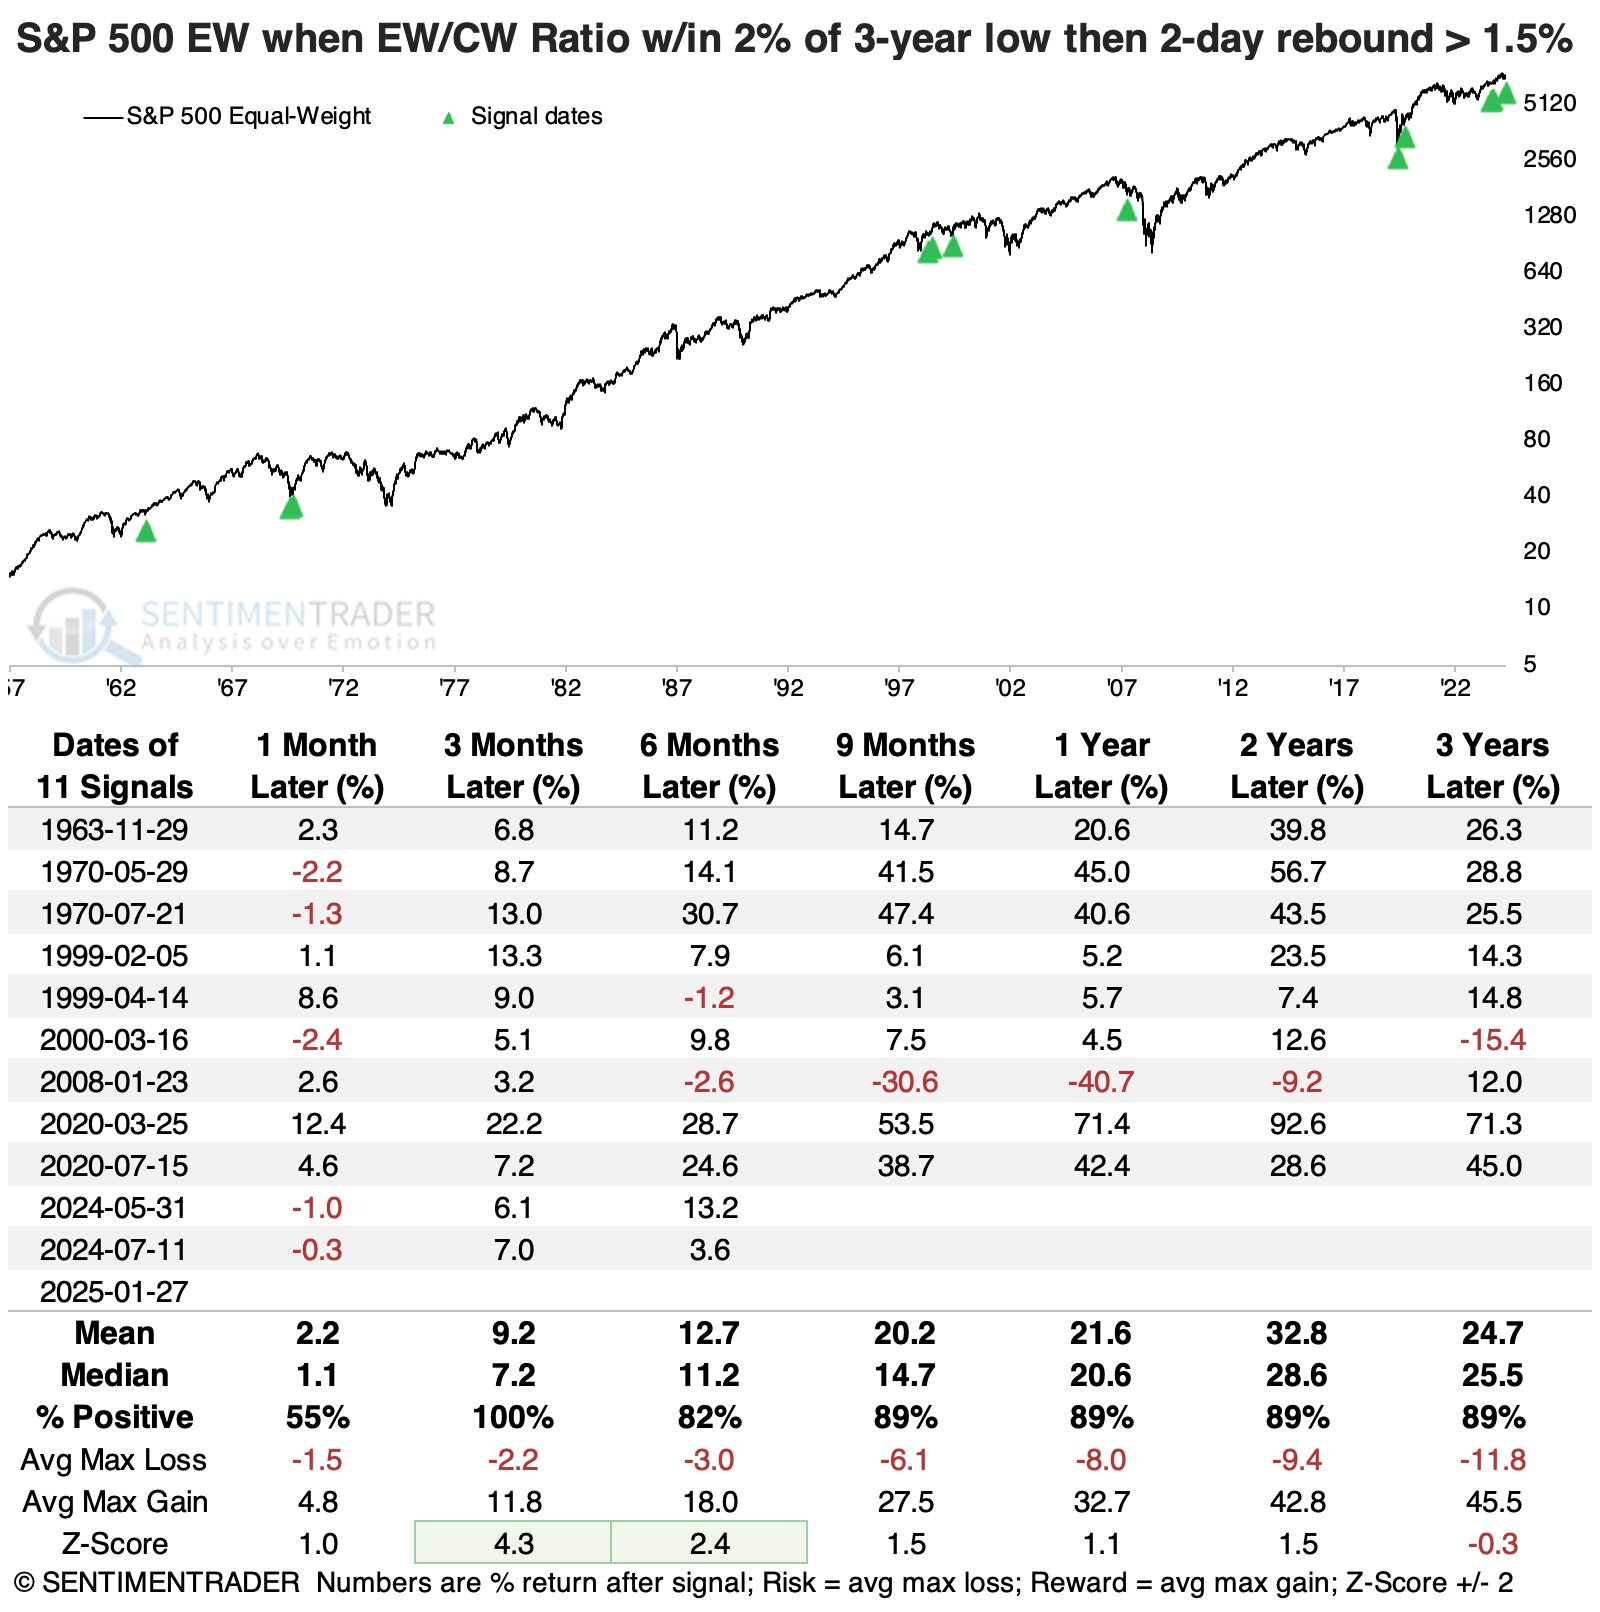
The table of maximum gains and losses across time frames shows how positively skewed these signals were. Within the following six months, every signal saw a gain larger than +5%, versus only two that suffered a drawdown larger than -5%. All but two witnessed a gain larger than +10%, while none of them lost more than -10%.
What the research tells us...
The wicked reversal in many AI-focused stocks was itself reversed to some degree on Tuesday, so perhaps the knee-jerk selling was all sound and fury, signifying nothing (except to the unfortunate traders who realized losses). But turning points in relative ratios - between sectors and the broader market - are often volatile affairs.
Above, we see that when investors suddenly and significantly rush into defensive sectors like staples and health care and even just into the average stock, it has tended to coincide with major turning points in their relative fortunes over long time frames. Along with the other evidence we've looked at in recent weeks, it's a compelling argument to no longer ignore funds like XLP, XLV, and RSP instead of being enthralled by the siren song of SPY and VOO.